Occupancy rate
82%

We arrange tours, appointments, and even moving support so you don’t have to


| Staff type | Hours / day | vs state avg |
|---|---|---|
|
Registered Nurse (RN)
| 39m per day | ▲ 11% State avg: 35m per day · National avg: 41m per day |
|
Nurse Aide
| 3h 38m per day | ▲ 57% State avg: 2h 19m per day · National avg: 2h 21m per day |
|
Total Nursing (Weekend)
| 5h 7m per day | ▲ 54% State avg: 3h 20m per day · National avg: 3h 26m per day |
|
Physical Therapist
| 9m per day | ▲ 80% State avg: 5m per day · National avg: 4m per day |
|
RN (Weekend)
| 24m per day | ▲ 4% State avg: 23m per day · National avg: 29m per day |
May offer a more intimate, personalized care environment.
This home supports both short-term rehab and long-term care, with residents staying for a wide range of durations.
44% of new residents, usually for short-term rehab.
54% of new residents, often for short stays.
2% of new residents, often for long-term daily care.
In North Carolina, the Department of Health and Human Services, Division of Health Service Regulation conducts unannounced surveys to ensure nursing and adult care homes meet safety standards.
9 resulted in violations
6 found no issues
9 with citations
0 without citations
North Carolina average: 19 inspections with citations
Deficiencies indicate regulatory issues. A higher number implies the facility had several areas requiring improvement.
North Carolina average: 46 deficiencies
The most recent inspection on August 14, 2025 identified deficiencies related to the timely completion and transmission of quarterly Minimum Data Set (MDS) assessments. Earlier inspections also noted issues with MDS transmission as well as medication administration errors, including a substantiated complaint about missed and improperly administered medications. Prior deficiencies involved resident assessments, medication self-administration documentation, and building maintenance concerns such as fire safety and cleanliness. No fines, immediate jeopardy findings, or license actions were listed in the available reports. The facility’s record shows recurring challenges with documentation and medication processes, with some improvement in addressing building and safety issues over time.
North Carolina average 4
Last Health inspection on Aug 2025
North Carolina average 20.9
North Carolina average 4.99
Health citations are formal notices following inspections when they fail to comply with safety and care standards.
4 of 5 citations resulted from standard inspections; and 1 of 5 came from combined inspections (standard and complaint).
North Carolina average: 1.3
North Carolina average: 0.9
Data sourced from CMS Health Deficiencies reports. Citation severity codes range from A (least serious) to L (most serious). Immediate Jeopardy (J-L) citations indicate situations where the facility's noncompliance has placed residents at risk of death or serious harm.
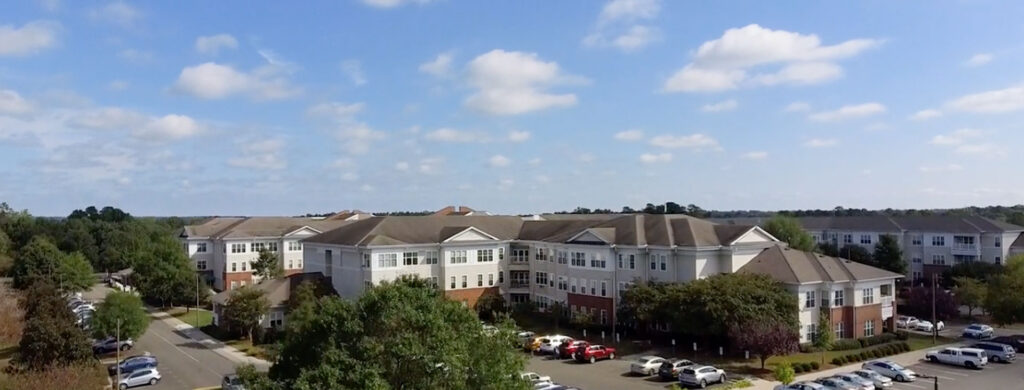
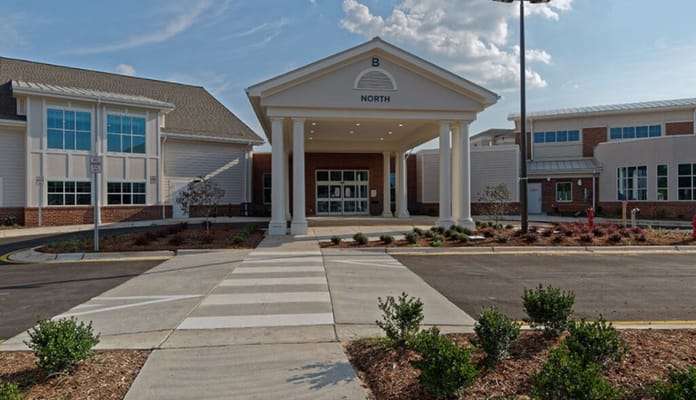
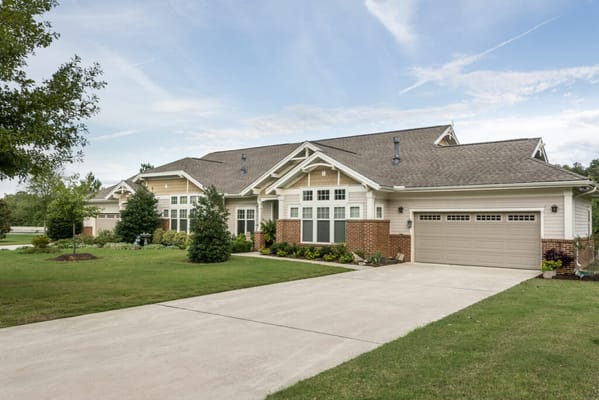
| Croasdaile Village |
NH Nursing Home Licensed facility providing 24/7 skilled nursing care for residents with complex, ongoing medical needs. Staffed by RNs, LPNs, and CNAs. Inspected and star-rated annually by CMS. Accepts Medicare (short-term rehab) and Medicaid (long-term care).
AL Assisted Living A licensed, long-term care setting for seniors or individuals with disabilities who need help with daily activities — like bathing, dressing, and medication management — but not 24-hour skilled nursing. Offers housing, meals, and around-the-clock support while aiming to maximize resident independence. | Durham | 166 | 82.2% | +8% | 5.75 | -23% | +45% | 1 | 5 | 1.7 | 0 | 86 | - | - | Ezekiel, Susan | $47.5M | $15.1M | 31.9% | 345501 | ||||
| Croasdaile Village |
NH Nursing Home Licensed facility providing 24/7 skilled nursing care for residents with complex, ongoing medical needs. Staffed by RNs, LPNs, and CNAs. Inspected and star-rated annually by CMS. Accepts Medicare (short-term rehab) and Medicaid (long-term care).
AL Assisted Living A licensed, long-term care setting for seniors or individuals with disabilities who need help with daily activities — like bathing, dressing, and medication management — but not 24-hour skilled nursing. Offers housing, meals, and around-the-clock support while aiming to maximize resident independence. | Durham | - | 82.2% | - | 5.75 | - | - | 1 | 5 | 1.7 | 0 | 86 | - | 3 | Ezekiel, Susan | $47.5M | $15.1M | 31.9% | 345501 | ||||
| Calyx Living of Durham | - |
NH Nursing Home Licensed facility providing 24/7 skilled nursing care for residents with complex, ongoing medical needs. Staffed by RNs, LPNs, and CNAs. Inspected and star-rated annually by CMS. Accepts Medicare (short-term rehab) and Medicaid (long-term care).
AL Assisted Living A licensed, long-term care setting for seniors or individuals with disabilities who need help with daily activities — like bathing, dressing, and medication management — but not 24-hour skilled nursing. Offers housing, meals, and around-the-clock support while aiming to maximize resident independence. | Durham | 84 | - | - | - | - | - | - | - | - | 0 | 0 | 0.0 | 0 | - | - | - | - | - | - | - | - |
| Carver Rehabilitation & Living Center | - |
NH Nursing Home Licensed facility providing 24/7 skilled nursing care for residents with complex, ongoing medical needs. Staffed by RNs, LPNs, and CNAs. Inspected and star-rated annually by CMS. Accepts Medicare (short-term rehab) and Medicaid (long-term care).
AL Assisted Living A licensed, long-term care setting for seniors or individuals with disabilities who need help with daily activities — like bathing, dressing, and medication management — but not 24-hour skilled nursing. Offers housing, meals, and around-the-clock support while aiming to maximize resident independence. | Durham | - | - | - | - | - | - | - | - | - | 0 | 0 | 0.0 | 0 | - | - | 31 | - | - | - | - | - |
| Concordia Transitional Care and Rehabilitation – Rose Manor | - |
NH Nursing Home Licensed facility providing 24/7 skilled nursing care for residents with complex, ongoing medical needs. Staffed by RNs, LPNs, and CNAs. Inspected and star-rated annually by CMS. Accepts Medicare (short-term rehab) and Medicaid (long-term care).
AL Assisted Living A licensed, long-term care setting for seniors or individuals with disabilities who need help with daily activities — like bathing, dressing, and medication management — but not 24-hour skilled nursing. Offers housing, meals, and around-the-clock support while aiming to maximize resident independence. | Durham | - | - | - | - | - | - | - | - | - | 0 | 0 | 0.0 | 0 | - | - | 47 | - | - | - | - | - |
![]() 5.2 miles from city center
5.2 miles from city center
![]() Estimated distance in miles from Durham's city center to Croasdaile Village's address, calculated via Google Maps.
Estimated distance in miles from Durham's city center to Croasdaile Village's address, calculated via Google Maps.
Add your location
This data corresponds to Q2 2025 and is based on CMS Payroll-Based Journal.
North Carolina average ratio: 1.85:1
North Carolina average: 8 hours
Manages medical care and health needs.
This role is partially covered by contractors.
Assists with medical care and medications.
This role is partially covered by contractors.
Helps with daily care and mobility.
This role is partially covered by contractors.
Total hours from contractors
8,361 contractor hours this quarter
| Certified Nursing Assistant | 55 | 54 | 109 | 23,623 | 91 | 100% | 7.9 |
| Licensed Practical Nurse | 23 | 21 | 44 | 10,125 | 91 | 100% | 9.3 |
| Registered Nurse | 14 | 1 | 15 | 3,362 | 91 | 100% | 8.8 |
| Medication Aide/Technician | 5 | 1 | 6 | 2,965 | 91 | 100% | 10.2 |
| Physical Therapy Aide | 0 | 6 | 6 | 1,224 | 66 | 73% | 6.4 |
| Dietitian | 2 | 0 | 2 | 1,020 | 72 | 79% | 8.3 |
| Speech Language Pathologist | 0 | 6 | 6 | 806 | 83 | 91% | 4.8 |
| Physical Therapy Assistant | 0 | 5 | 5 | 700 | 77 | 85% | 5.1 |
| Clinical Nurse Specialist | 2 | 0 | 2 | 664 | 62 | 68% | 8 |
| Respiratory Therapy Technician | 0 | 9 | 9 | 615 | 80 | 88% | 3.4 |
| Qualified Social Worker | 0 | 3 | 3 | 595 | 65 | 71% | 4.6 |
| RN Director of Nursing | 1 | 0 | 1 | 542 | 75 | 82% | 7.2 |
| Feeding Assistant | 2 | 0 | 2 | 536 | 64 | 70% | 7 |
| Mental Health Service Worker | 2 | 0 | 2 | 520 | 60 | 66% | 8 |
| Nurse Practitioner | 1 | 0 | 1 | 512 | 64 | 70% | 8 |
| Administrator | 1 | 0 | 1 | 472 | 59 | 65% | 8 |
| Occupational Therapy Aide | 0 | 1 | 1 | 440 | 55 | 60% | 8 |
| Other Physician | 0 | 1 | 1 | 104 | 13 | 14% | 8 |
| Medical Director | 0 | 1 | 1 | 96 | 12 | 13% | 8 |
Source: CMS Long-Term Care Facility Characteristics (Data as of Jan 2026)
Part of a Continuing Care Retirement Community offering multiple care levels
Data sourced from CMS Long-Term Care Facility Characteristics quarterly report. Payer mix reflects the current resident census by primary payment source.
These measures show how residents usually do over time at this home, based on health outcomes and preventive care.
North Carolina average: 11.5
North Carolina average: 20.6
North Carolina average: 17.5%
North Carolina average: 23.3%
North Carolina average: 21.4%
North Carolina average: 3.6%
North Carolina average: 6.3%
North Carolina average: 2.6%
North Carolina average: 7.4%
North Carolina average: 4.4%
North Carolina average: 13.4%
North Carolina average: 91.6%
North Carolina average: 94.1%
North Carolina average: 1.77
North Carolina average: 1.82
North Carolina average: 79.9%
North Carolina average: 1.5%
North Carolina average: 78.1%
North Carolina average: 22.9%
North Carolina average: 13.2%
North Carolina average: 0.8%
North Carolina average: 53.7%
North Carolina average: 50.6%
Quality measures are calculated from Minimum Data Set (MDS) assessments. For most measures, lower percentages indicate better care quality.
Federal penalties imposed by CMS for regulatory violations, including civil money penalties (fines) and denials of payment for new Medicare/Medicaid admissions.
Source: CMS Penalties Database (Data as of Jan 2026)
North Carolina average: $76K
North Carolina average: 2.3
North Carolina average: 0.4
Penalties are imposed by CMS for violations of federal nursing home regulations.
Last updated: Jan 2026
Historical financial and operational data for Croasdaile Village based on CMS SNF Cost Reports.
Loading trend charts...
Care Cost Calculator: See Prices in Your Area
Nursing Home Data Explorer
Don’t Wait Too Long: 7 Red Flag Signs Your Parent Needs Assisted Living Now
The True Cost of Assisted Living in 2025 – And How Families Are Paying For It
Understanding Senior Living Costs: Pricing Models, Discounts & Financial Assistance

Touring a community? Use this expert-backed checklist to stay organized, ask the right questions, and find the perfect fit.
We'll send you a PDF version of the touring checklist.
Thank you for your interest!
Our team will be in touch shortly to help with next steps.