


Total health inspections
4
Michigan average 6.5
Last Health inspection on Mar 2025


Renaissance Gardens at Fox Run is a 200-bed skilled nursing and assisted living community at 41215 Fox Run Road in Novi, Oakland County, Michigan, operated by Fox Run Village, Inc., a non-profit continuing care retirement community. Medicare and private pay are accepted, with most residents coming for short-term stays averaging 51 days.
The facility is graded 4 stars by CMS, 12.7 percent above Michigan average, with staffing as the defining strength: nurse hours reach 5h 42m per resident per day, 34 percent above state average and ranked 7th out of 133 Michigan skilled nursing facilities. Across 4 inspections since 2023, the facility totaled 23 citations, all moderate in severity with no critical or serious findings, and six small federal fines totaling $14,000 issued in September 2023, with no payment denials. Recurring deficiencies in tuberculosis screening compliance and medication documentation have been noted across multiple inspection cycles. The community currently has substantial availability at 14 percent occupancy, well below Michigan average.
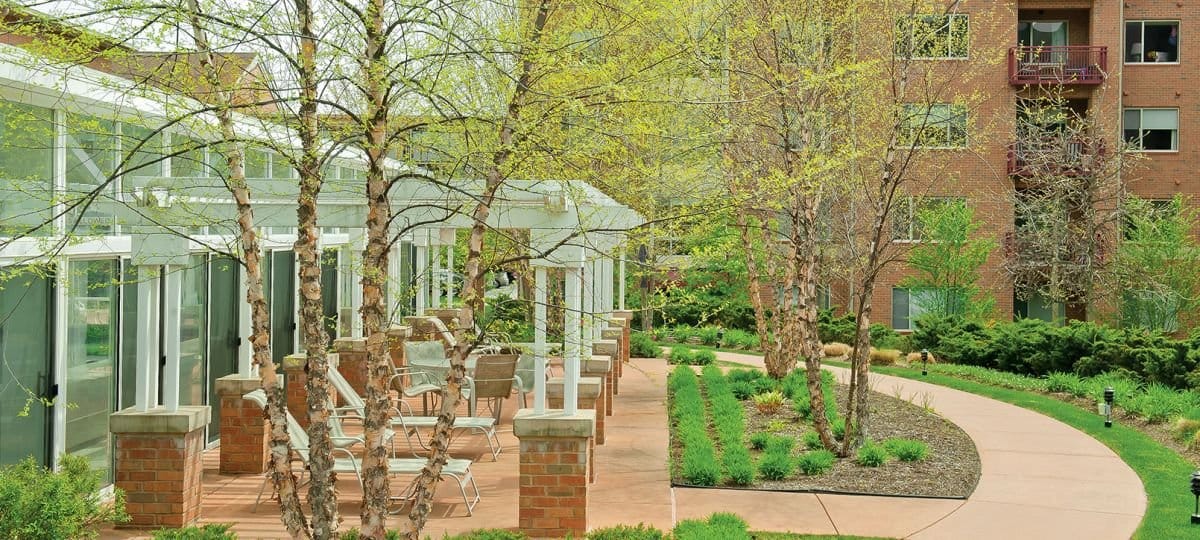
A fitness center, aquatics center, landscaped walking paths, and on-site dining are among the amenities. Offerings include rehabilitation services, respite care, and memory care.
With staffing levels among the highest in Michigan, Renaissance Gardens at Fox Run is built for short-term Medicare rehabilitation and assisted living within a full-continuum CCRC community in Novi.
| Staff type | Hours / Day / Resident | vs state avg |
|---|---|---|
|
Registered Nurse (RN)
| 1h 17m per day | ▲ 69% State avg: 46m per day · National avg: 41m per day |
|
LPN / LVN
| 1h 34m per day | ▲ 77% State avg: 53m per day · National avg: 52m per day |
|
Nurse Aide
| 2h 58m per day | ▲ 27% State avg: 2h 20m per day · National avg: 2h 20m per day |
|
Weekend Total Nursing
| 5h 3m per day | ▲ 44% State avg: 3h 31m per day · National avg: 3h 27m per day |
|
Physical Therapist
| 16m per day | ▲ 290% State avg: 4m per day · National avg: 4m per day |
|
Weekend RN
| 36m per day | ▲ 22% State avg: 29m per day · National avg: 29m per day |
In Michigan, the Department of Licensing and Regulatory Affairs (LARA) conducts unannounced inspections and investigations to ensure long-term care facilities comply with state health codes.
Deficiencies
| This Facility | MI Average | vs. MI Avg |
|---|---|---|---|
|
Total deficiencies
| 8 | 8 | This facility has total deficiencies in line with the Michigan average (8 vs. MI avg 8).— At avg |
|
Deficiencies per year
| 0.5 | 0.5 | This facility has deficiencies per year in line with the Michigan average (0.5 vs. MI avg 0.5).— At avg |
Michigan average 6.5
Last Health inspection on Mar 2025
Michigan average 33.5
Michigan average 5.18
Health citations are formal notices following inspections when they fail to comply with safety and care standards.
20 of 23 citations resulted from standard inspections; and 3 of 23 resulted from complaint investigations.
Michigan average: 0.3
Michigan average: 1.9
Reporting period: October 1 – December 31, 2025 (Q4 2025). Source: CMS Payroll-Based Journal report.
Manages medical care and health needs.
Assists with medical care and medications.
Helps with daily care and mobility.
Total hours from contractors
24 contractor hours this quarter
| Certified Nursing Assistant | 32 | 0 | 32 | 9,163 | 92 | 100% | 7 |
| Licensed Practical Nurse | 24 | 0 | 24 | 5,669 | 92 | 100% | 7.6 |
| Clinical Nurse Specialist | 12 | 0 | 12 | 2,415 | 85 | 92% | 7.9 |
| Registered Nurse | 8 | 0 | 8 | 1,801 | 91 | 99% | 6.6 |
| Medication Aide/Technician | 36 | 0 | 36 | 1,555 | 80 | 87% | 7 |
| Respiratory Therapy Technician | 12 | 0 | 12 | 971 | 83 | 90% | 4.4 |
| Other Dietary Services Staff | 4 | 0 | 4 | 899 | 79 | 86% | 7.8 |
| Physical Therapy Assistant | 9 | 0 | 9 | 863 | 79 | 86% | 5.4 |
| Mental Health Service Worker | 3 | 0 | 3 | 516 | 61 | 66% | 7.8 |
| Administrator | 1 | 0 | 1 | 472 | 59 | 64% | 8 |
| Nurse Practitioner | 1 | 0 | 1 | 456 | 57 | 62% | 8 |
| Dietitian | 1 | 0 | 1 | 448 | 56 | 61% | 8 |
| Occupational Therapy Aide | 1 | 0 | 1 | 426 | 53 | 58% | 8 |
| Qualified Social Worker | 4 | 0 | 4 | 240 | 50 | 54% | 4.6 |
| Speech Language Pathologist | 4 | 0 | 4 | 211 | 38 | 41% | 4.2 |
| Physical Therapy Aide | 2 | 0 | 2 | 58 | 14 | 15% | 3.9 |
| Occupational Therapy Assistant | 0 | 5 | 5 | 24 | 42 | 46% | 0.6 |
| Medical Director | 1 | 0 | 1 | 20 | 8 | 9% | 2.5 |
Includes penalties issued in 2023
Federal penalties imposed by CMS for regulatory violations, including civil money penalties (fines) and denials of payment for new Medicare/Medicaid admissions.
Source: CMS Penalties Database (Data as of Jan 2026)
Michigan average: $76K
Michigan average: 2.0
Michigan average: 0.8
Penalties are imposed by CMS for violations of federal nursing home regulations.
6 penalties in the past 3 years
Multiple penalties were reported in the last 3 years.
Last updated: Jan 2026
These measures show how residents usually do over time at this home, based on health outcomes and preventive care.
Michigan average: 8.4
Michigan average: 16.3
Michigan average: 12.5%
Michigan average: 21.0%
Michigan average: 3.2%
Michigan average: 5.7%
Michigan average: 1.7%
Michigan average: 5.7%
Michigan average: 3.9%
Michigan average: 15.0%
Michigan average: 94.9%
Michigan average: 95.0%
Michigan average: 82.5%
Michigan average: 1.4%
Michigan average: 79.5%
Quality measures are calculated from Minimum Data Set (MDS) assessments. For most measures, lower percentages indicate better care quality.
39% of new residents, usually for short-term rehab.
61% of new residents, often for short stays.
Source: CMS Long-Term Care Facility Characteristics (Data as of Jan 2026)
Residents meet regularly to discuss policies, care quality, and activities
Part of a Continuing Care Retirement Community offering multiple care levels
Organized group of residents that meets regularly to discuss facility policies, quality of life, and activities.
Data sourced from CMS Long-Term Care Facility Characteristics quarterly report. Payer mix reflects the current resident census by primary payment source.
Historical financial and operational data for Renaissance Gardens at Fox Run from 2011–2023, based on CMS SNF Cost Reports.
Based on CMS SNF Cost Report for fiscal year ending in 12/2023.
Residents typically stay for brief periods, with frequent admissions and discharges throughout the year.
Most new residents arrive under private pay (61% of admissions), and a typical private pay stay runs around 2 - 3 months.
Coverage residents most often arrive under.
Coverage residents most often leave under.
![]() 2.2 miles from city center
2.2 miles from city center
![]() Estimated distance in miles from Novi's city center to Renaissance Gardens at Fox Run's address, calculated via Google Maps.
Estimated distance in miles from Novi's city center to Renaissance Gardens at Fox Run's address, calculated via Google Maps.
Add your location
Renaissance Gardens at Fox Run is located in Novi, Michigan.
Here are the financial assistance programs available to residents in Michigan.
Renaissance Gardens at Fox Run is legally operated by Fox Run Village, Inc..
Renaissance Gardens at Fox Run has a walk score of 29. Somewhat walkable. A few nearby services may be reachable on foot, but most trips require transportation.
According to MI state health department records, Renaissance Gardens at Fox Run's license number is AH630306479.
According to MI state health department records, Renaissance Gardens at Fox Run's license expires on July 31, 2027.
Renaissance Gardens at Fox Run's occupancy is 97.5%.
Renaissance Gardens at Fox Run is registered as a non-profit in MI.
Renaissance Gardens at Fox Run has 200 beds.
Care Cost Calculator: See Prices in Your Area
Nursing Home Data Explorer
Don’t Wait Too Long: 7 Red Flag Signs Your Parent Needs Assisted Living Now
The True Cost of Assisted Living in 2025 – And How Families Are Paying For It
Understanding Senior Living Costs: Pricing Models, Discounts & Financial Assistance


