Winfield Rest Haven II Lc
Nursing Home & Independent Living · Winfield, KS
CMS overall rating Info CMS (the Centers for Medicare & Medicaid Services) is the federal agency that rates nursing home quality. Its Overall Rating runs from 1 to 5 stars, combining health inspections, staffing, and quality measures, with inspections weighted most heavily.

Winfield Rest Haven II Lc

Nursing Home & Independent Living · Winfield, KS
CMS overall rating Info CMS (the Centers for Medicare & Medicaid Services) is the federal agency that rates nursing home quality. Its Overall Rating runs from 1 to 5 stars, combining health inspections, staffing, and quality measures, with inspections weighted most heavily.
Calculator: See prices in your area
Winfield Rest Haven II Lc accepts Medicare, Medicaid, and private pay.

Overview of Winfield Rest Haven II Lc

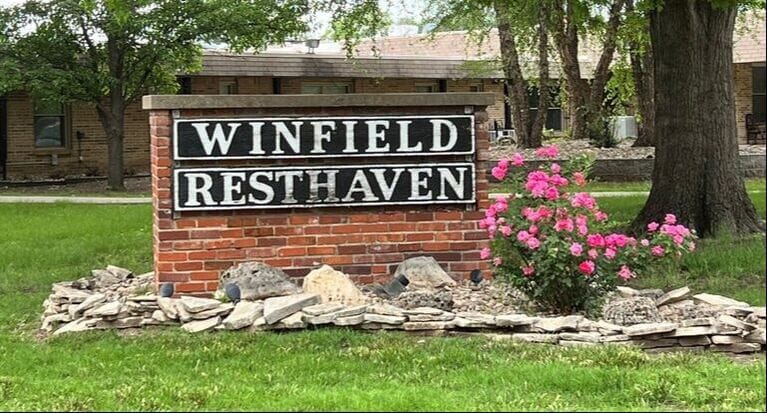
Winfield Rest Haven II LC is a 41-bed nonprofit skilled nursing facility located at 1611 Ritchie Street in Winfield, Kansas. Managed by a community-based nonprofit board, the facility provides long-term care and 24-hour skilled nursing for residents of Cowley County and the surrounding north-central region.

As a skilled nursing facility (SNF), the community provides around-the-clock clinical care and rehabilitation services under the federal Medicare and Medicaid frameworks. The facility currently carries a 2-out-of-5-star overall CMS rating, which reflects health inspection performance and quality measures that have trended below state averages. Notably, based on recent 2026 focused health filings, the community maintains a citations-per-inspection rate of zero for current infection control surveys. Occupancy typically remains high, with approximately 37 to 39 beds occupied at any given time.

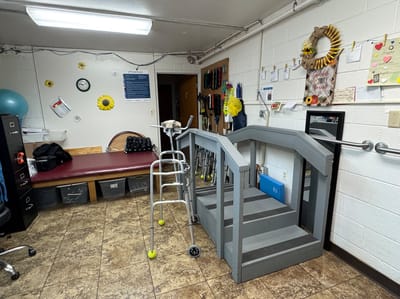
The staffing model is designed to support high-acuity residents requiring specialized medical oversight, ensuring a licensed nurse is on duty 24/7 to manage medication administration and acute clinical needs. The interdisciplinary team provides comprehensive therapy services, including physical, occupational, and speech therapy, to promote resident independence and a dedicated restorative program focusing on strength maintenance through guided exercise. Furthermore, the clinical staff assists with daily living tasks, memory care support, and post-surgical recovery.

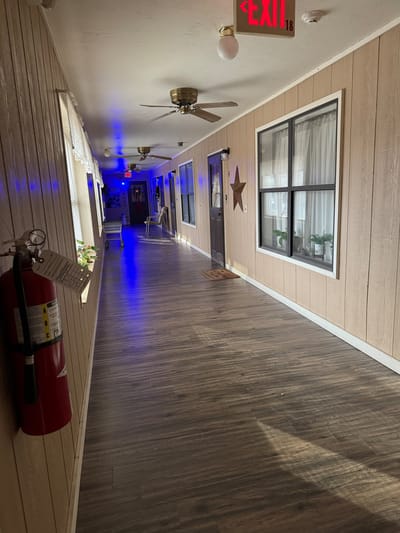
The facility is situated in a quiet residential area adjacent to Cherry Street Park, offering a “home away from home” environment where residents live in private or semi-private suites featuring 24-hour emergency response systems. All-inclusive services cover three nutritional meals daily with a focus on high-quality food, housekeeping, personal laundry, and scheduled transportation for medical appointments and shopping. Social life is anchored by a full-time activity director who coordinates programs such as zoo outings, Bible study, family bingo nights, and intergenerational social events.

Those seeking a community-rooted, nonprofit facility with a strong restorative care focus may find this setting appropriate. Individuals evaluating the home should contact the administrator directly to discuss current staffing disclosures and schedule an in-person tour to assess the safety protocols and residential wings firsthand.

Quality ratings

Measured by Centers for Medicare & Medicaid Services (CMS)

Overall rating Info The Overall CMS Rating combines results from health inspections, staffing levels and quality measures. Health inspections carry the most weight. Staffing and quality scores can increase or decrease the final rating based on performance compared to state and national standards.
Health Inspection Info Based on the results of the facility's three most recent standard inspections and any complaint investigations. CMS reviews the number, scope, and severity of deficiencies, with more recent findings weighted more heavily.
Staffing Info Measures average nursing staff hours per resident per day, including Registered Nurses (RNs) and total nursing staff. Ratings are adjusted based on the level of care residents require and are compared to state and national benchmarks.
Quality Measures Info Based on clinical and physical health indicators reported to CMS, such as hospital readmissions, falls, pressure ulcers, and improvements in mobility. These measures reflect how well residents' health needs are being managed.

Staffing hours breakdown

Info Daily nursing hours per resident by staff type, reported to CMS. Higher is generally better — compare this facility to state and national averages to see where staffing stands.

Hours per resident per day — compared to state averages

Total nursing care / resident Info Total adjusted nursing hours per resident per day, combining RN, LPN, and aide time. CMS adjusts this for case-mix so facilities can be fairly compared.
4h 20m per day
vs avg

5 of 6 metrics below state avg

Standout metric Nurse Aide is +6% above state avg
Staff typeHours / Day / Residentvs state avg
Registered Nurse (RN) Info RNs hold the highest nursing license and can assess residents, interpret test results, and direct care plans. More RN hours per day often signals stronger clinical oversight and faster response to health changes. 20m per day ▼ 53% State avg: 43m per day · National avg: 41m per day
LPN / LVN Info Licensed Practical Nurses (LPNs) or Licensed Vocational Nurses (LVNs) deliver routine hands-on care — medication administration, wound dressing, and monitoring vital signs. They work under RN supervision and make up a large share of daily bedside care. 27m per day ▼ 33% State avg: 40m per day · National avg: 52m per day
Nurse Aide Info Certified Nurse Aides (CNAs) provide the most direct day-to-day assistance: bathing, dressing, feeding, and mobility. Nurse aide hours are typically the largest staffing category and directly affect residents' quality of life. 2h 50m per day ▲ 6% State avg: 2h 41m per day · National avg: 2h 20m per day
Weekend Total Nursing Info Combined nursing hours (RN + LPN + Nurse Aide) per resident per day on weekends. Staffing often drops on weekends — this figure reveals whether the facility maintains adequate coverage outside of weekday hours. 3h 16m per day ▼ 9% State avg: 3h 35m per day · National avg: 3h 26m per day
Physical Therapist Info Hours per resident per day provided by licensed Physical Therapists (PTs) or PT Assistants. PT services help residents recover mobility after injury or illness and are especially important for post-acute (short-stay) rehabilitation. 1m per day ▼ 66% State avg: 2m per day · National avg: 4m per day
Weekend RN Info Registered nurse hours specifically on weekends. Facilities sometimes reduce RN presence on Saturdays and Sundays — a low weekend RN figure compared to weekday hours can indicate reduced clinical oversight when most administrative staff are absent. 22m per day ▼ 27% State avg: 30m per day · National avg: 28m per day

Capacity and availability

Avg. Length of Stay
315 days
Bed community size
41-bed community Rank #191 / 224Bed count — State benchmarkedThis home is ranked 191st out of 224 homes in Kansas. Shows this facility's certified or reported bed count compared to other Kansas facilities. Larger communities may offer more amenities, programs, and on-site services for residents and families.Rankings are based only on facilities in Kansas that report data for that category. Facilities without available data are excluded from the ranking.Click the rank badge to see the full State ranking.Click here to see the full State ranking.
A moderately sized community that may balance personal attention with shared amenities and social activities.
Walk Score
Walk Score: 78 / 100 Rank #25 / 363Walk Score — State benchmarkedThis home is ranked 25th out of 363 homes in Kansas. Shows how walkable this facility's neighborhood is compared to the average Walk Score across Kansas facilities. Higher scores benefit residents, families, and staff.Rankings are based only on facilities in Kansas that report data for that category. Facilities without available data are excluded from the ranking.Click the rank badge to see the full State ranking.Click here to see the full State ranking.
Very walkable. Most errands can be accomplished on foot, and many essentials are within a short walk.

About this community

Occupancy

Occupancy rate
98%
Higher than the Kansas average: 79.5%
Occupied beds
40 / 41
Average occupied beds in Kansas homes 50 beds

License Details

Facility TypeNursing Facility
StatusActive
CountyCowley
License Number175488

Ownership & Operating Entity

Winfield Rest Haven II Lc is administered by Amy Lemer.

Owner NameWinfield Rest Haven II Lc

Staffing

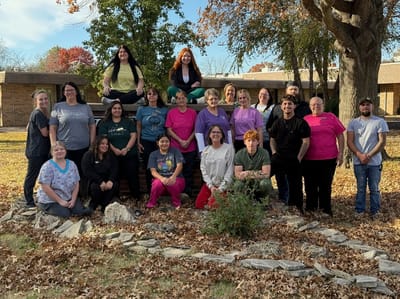
Key information about the people who lead and staff this community.

Leadership

ContactDereck Hutchison, Administrator

Therapy & Rehabilitation

1 service
Rehabilitation Services

Staffing & Medical

2 services
Licensed Nurses/CNAs
24-Hour Staffing

Amenities & Lifestyle

Specific ProgramsSkilled Care, Therapy Services, Restorative Care, Other Resident Services

Contact Winfield Rest Haven II Lc

Inspection History

In Kansas, the Department for Aging and Disability Services, Survey and Certification Commission performs the unannounced inspections required for facility licensing and federal certification.

Since 2012 · 14 years of data 207 deficiencies

Inspection Scorecard Info This scorecard compares key inspection, deficiency, and complaint metrics at this facility against the Kansas state average. Metrics rated ≥15% worse than average are highlighted in red; those ≥15% better are highlighted in green.

Since 2012 vs. Kansas state average
Overall vs. KS average 2 Worse Metrics worse than Kansas average:
• Total deficiencies (107% above)
• Deficiencies per year (108% above)
0 Better No metrics in this bucket.
Latest Inspection December 17, 2024

Deficiencies Info Deficiencies are formal regulatory issues recorded during state inspections.

This FacilityKS Averagevs. KS Avg
Total deficiencies Info Formal regulatory issues recorded by inspectors across all inspection types. 207100 This facility has 107% more total deficiencies than a typical Kansas assisted living residence (207 vs. KS avg 100).↑ 107% worse
Deficiencies per year Info Average deficiencies per year since 2012. 14.87.1 This facility has 108% more deficiencies per year than a typical Kansas assisted living residence (14.8 vs. KS avg 7.1).↑ 108% worse

Inspection Reports Summary Info An editor-reviewed summary of the themes and findings across this facility's recent inspection reports.

  • The most recent inspection on January 27, 2025 found no deficiencies, confirming that all prior issues cited in December 2024 were corrected by the end of that month. Earlier inspections showed a pattern of deficiencies related mainly to resident assessments, care planning, safety procedures—especially securing residents during whirlpool bath use—and medication monitoring, including psychotropic drug oversight and infection control practices. Complaint investigations substantiated some issues, such as a fall causing injury due to improper safety device use and a case of physical abuse by a staff member in 2020, which led to termination and reporting to authorities. Enforcement actions such as fines or license suspensions were not listed in the available reports. The facility’s record shows improvement over time, with recent inspections indicating correction of previously cited deficiencies and compliance with regulatory requirements.

Health Inspection History

Inspections since 2021
Total health inspections 3

State average N/A


Last Health inspection on Dec 2024

Total health citations
11

State average N/A

Citations per inspection
3.67

State average N/A


Health citations are formal notices following inspections when they fail to comply with safety and care standards.

9 of 11 citations resulted from standard inspections; and 2 of 11 came from combined inspections (standard and complaint).

Breakdown of citation severity (last 5 years)
Critical health citations
0
In line with State average

State average: N/A


Serious health citations
1
In line with State average

State average: N/A

0 critical citations State average: N/A

1 serious citation State average: N/A

10 moderate citations State average: N/A

0 minor citations State average: N/A
Citations history (last 5 years)
Infection Control moderate citation Dec 04, 2024
Corrected

Pharmacy moderate citation Dec 04, 2024
Corrected

Quality of Care serious citation Dec 04, 2024
Corrected

Care Planning moderate citation Dec 04, 2024
Corrected

Staffing Data

Reporting period: October 1 – December 31, 2025 (Q4 2025). Source: CMS Payroll-Based Journal report.

Total staff 66
Employees 58
Contractors 8
Staff to resident ratio 1.65 : 1
0% compared with State average

State average ratio: 0 : 0

Avg staff/day 23
Average shift 7.2 hours
0% compared with State average

State average: 0 hours

Total staff hours (quarter) 15,132

Nursing staff breakdown

Q4 2025 · Oct 1 – Dec 31 More info This data comes from the CMS Payroll-Based Journal report covering October 1 – December 31, 2025.
Registered Nurse

Manages medical care and health needs.

RN Staff Info 4 total: 2 full-time employees and 2 contractors. 4
Average shift length Info Average shift length. Calculated as total hours divided by days worked and average staff per day. 9.7 hours
Licensed Practical Nurse

Assists with medical care and medications.

LPN Staff Info All 4 LPN Staff are full-time employees. No contractors work on this role. 4
Average shift length Info Average shift length. Calculated as total hours divided by days worked and average staff per day. 9 hours
Certified Nursing Assistant

Helps with daily care and mobility.

CNA Staff Info All 35 CNA Staff are full-time employees. No contractors work on this role. 35
Average shift length Info Average shift length. Calculated as total hours divided by days worked and average staff per day. 7 hours

Contractor staffing

Q4 2025 · Oct 1 – Dec 31 More info This data comes from the CMS Payroll-Based Journal report covering October 1 – December 31, 2025.

Total hours from contractors

7.7%

1,159 contractor hours this quarter

Nurse Practitioner: 2 Registered Nurse: 2 Medical Director: 1 Administrator: 1 Occupational Therapy Assistant: 1 Occupational Therapy Aide: 1

Staff by category

Q4 2025 · Oct 1 – Dec 31 More info This data comes from the CMS Payroll-Based Journal report covering October 1 – December 31, 2025.
Certified Nursing Assistant350358,43492100%7
Medication Aide/Technician100101,62992100%7.8
Licensed Practical Nurse4041,5749199%9
Registered Nurse2247316773%9.7
Physical Therapy Aide1015277076%7.5
Dietitian1014906368%7.8
Dental Services Staff1014775863%8.2
Nurse Practitioner0224706065%7.8
Administrator0112784145%6.8
Medical Director0112566470%4
Qualified Social Worker1011426065%2.4
Physical Therapy Assistant101492426%2
Respiratory Therapy Technician101401516%2.6
Occupational Therapy Assistant0111555%3.1
Occupational Therapy Aide0111544%3.8
Speech Language Pathologist101322%1.7
35 Certified Nursing Assistant
% of Days 100%
10 Medication Aide/Technician
% of Days 100%
4 Licensed Practical Nurse
% of Days 99%
4 Registered Nurse
% of Days 73%
1 Physical Therapy Aide
% of Days 76%
1 Dietitian
% of Days 68%
1 Dental Services Staff
% of Days 63%
2 Nurse Practitioner
% of Days 65%
1 Administrator
% of Days 45%
1 Medical Director
% of Days 70%
1 Qualified Social Worker
% of Days 65%
1 Physical Therapy Assistant
% of Days 26%
1 Respiratory Therapy Technician
% of Days 16%
1 Occupational Therapy Assistant
% of Days 5%
1 Occupational Therapy Aide
% of Days 4%
1 Speech Language Pathologist
% of Days 2%

Penalties and fines

Federal penalties imposed by CMS for regulatory violations, including civil money penalties (fines) and denials of payment for new Medicare/Medicaid admissions.

Source: CMS Penalties Database

No penalties in the past 3 years

No civil money penalties or payment denials were reported in the last 3 years.

Quality of care over time

These measures show how residents usually do over time at this home, based on health outcomes and preventive care.

High-risk clinical events score Info A composite score based on pressure ulcers, falls with injury, weight loss, walking ability decline, and activities of daily living decline. 11.4
9% worse than State average

State average: 10.5

Functional decline score Info A composite score based on activities of daily living decline, walking ability decline, and incontinence. 24.4
18% worse than State average

State average: 20.7

Long-stay resident measures
Below average Info CMS star rating based on long-stay quality measure performance. 5 stars = significantly above average, 1 star = significantly below average.
Need for Help with Daily Activities Increased Info Percent of long-stay residents whose need for help with daily activities has increased 20.5%
7% worse than State average

State average: 19.0%

Walking Ability Worsened Info Percent of long-stay residents whose ability to move independently worsened 23.8%
23% worse than State average

State average: 19.4%

Low Risk Residents with Bowel/Bladder Incontinence Info Percent of low risk long-stay residents who lose control of their bowels or bladder 29.0%
22% worse than State average

State average: 23.8%

Falls with Major Injury Info Percent of long-stay residents experiencing one or more falls with major injury 3.3%
25% better than State average

State average: 4.4%

High Risk Residents with Pressure Ulcers Info Percent of long-stay high risk residents with pressure ulcers 0.0%
100% better than State average

State average: 4.6%

Urinary Tract Infection Info Percent of long-stay residents with a urinary tract infection 4.8%
52% worse than State average

State average: 3.1%

Lost Too Much Weight Info Percent of long-stay residents who lose too much weight 9.6%
89% worse than State average

State average: 5.1%

Depressive Symptoms Info Percent of long-stay residents who have depressive symptoms 3.5%
33% better than State average

State average: 5.2%

Antipsychotic Use Info Percent of long-stay residents who received an antipsychotic medication 24.8%
46% worse than State average

State average: 16.9%

Pneumococcal Vaccine Info Percent of long-stay residents assessed and appropriately given the pneumococcal vaccine 53.6%
42% worse than State average

State average: 91.9%

Influenza Vaccine Info Percent of long-stay residents assessed and appropriately given the seasonal influenza vaccine 85.7%
10% worse than State average

State average: 95.5%

Hospitalizations per 1,000 days Info Number of hospitalizations per 1,000 long-stay resident days. 1.06
42% better than State average

State average: 1.84

ED visits per 1,000 days Info Number of outpatient emergency department visits per 1,000 long-stay resident days. 1.95
10% better than State average

State average: 2.16

Short-stay resident measures
Pneumococcal Vaccine Info Percent of short-stay residents assessed and appropriately given the pneumococcal vaccine 22.2%
71% worse than State average

State average: 75.6%

Breakdown by payment type

Medicare

42% of new residents, usually for short-term rehab.

Typical stay 1 - 2 months

Private pay

47% of new residents, often for short stays.

Typical stay 6 months

Medicaid

11% of new residents, often for long-term daily care.

Typical stay 6 - 7 years

Facility Characteristics

Source: CMS Long-Term Care Facility Characteristics (Data as of Jan 2026)

Total residents 40
Medicare
2
5% of residents
Medicaid
31
77.5% of residents
Private pay or other
7
17.5% of residents
Programs & Services
Residents Group

Residents meet regularly to discuss policies, care quality, and activities

Nurse Aide Training

State-approved Nurse Aide Training and Competency Evaluation Program on-site

Active Resident Council

Organized group of residents that meets regularly to discuss facility policies, quality of life, and activities.

Finances and operations

Based on CMS SNF Cost Report for fiscal year ending in 12/2023.

Nonprofit
Other Nonprofit
Net patient revenue Info Net patient revenue — what the home actually collects for resident care, after contractual allowances, bad debt and discounts are subtracted from its gross charges (CMS cost report, Worksheet G-3). It covers resident care only; money the home earns from other sources is shown separately as "Other income."
$4.3M
Net patient income Info Net patient income: net patient revenue minus the home's total operating expenses. A positive figure means it earns more from resident care than it spends to deliver it; a negative figure means the opposite. It excludes non-operating "other income."
-$3.5K
Nonprofit Other Nonprofit
Net patient revenue Info Net patient revenue — what the home actually collects for resident care, after contractual allowances, bad debt and discounts are subtracted from its gross charges (CMS cost report, Worksheet G-3). It covers resident care only; money the home earns from other sources is shown separately as "Other income."
$4.3M
Net patient income Info Net patient income: net patient revenue minus the home's total operating expenses. A positive figure means it earns more from resident care than it spends to deliver it; a negative figure means the opposite. It excludes non-operating "other income."
-$3.5K
Other income Info Money the home earns outside of resident care — such as investments, grants, rentals and other non-operating sources (CMS cost report, Worksheet G-3). It is tracked separately from net patient revenue: it is not part of that figure, and it is not included in net patient income.
$21.5K
Payroll costs Info Staff salaries plus wage-related costs — benefits such as payroll taxes, health insurance and retirement — from the home's own accounting records (CMS cost report, Worksheet A). Contract or agency labor is counted separately, under other operating costs.
$2.2M 51.3% of net patient revenue Info Payroll as a share of revenue: staff salaries and wage-related benefits divided by net patient revenue. A higher figure means more of each revenue dollar goes to staff pay.
Other operating costs Info Everything it costs to run the home apart from payroll — food, utilities, supplies, maintenance, contract labor and administration. Calculated as total operating expense minus payroll (staff salaries and wage-related benefits).
$2.1M
Total costs Info The home's total operating expense for the year — all the costs of running it, salaries included (CMS cost report, Worksheet G-3).
$4.3M

Who this home usually serves

TYPE OF STAY

Mix of rehab and long-term care

This home supports both short-term rehab and long-term care, with residents staying for a wide range of durations.

New residents most often arrive under private pay (47% of admissions), and a typical private pay stay runs around 6 months.

Admissions
38 total

Coverage residents most often arrive under.

Medicare 42%
Private pay 47%
Medicaid 11%
Discharges
43 total

Coverage residents most often leave under.

Medicare 42%
Private pay 53%
Medicaid 5%

Places of interest near Winfield Rest Haven II Lc

Address 0.0 miles from city center Info Estimated distance in miles from Winfield's city center to Winfield Rest Haven II Lc's address, calculated via Google Maps.

Calculate Travel Distance to Winfield Rest Haven II Lc

Add your location

Address

Compare Nursing Homes around the area

Winfield Rest Haven II Lc
NH
IL
Winfield -41 - 78 -
Lexington Park Assisted Living
NH
AL
IL
Topeka (West Southwest 2) -60 A+ 60 studio / 1 bed

Frequently Asked Questions about Winfield Rest Haven II Lc

Is Winfield Rest Haven II Lc in a walkable area?

Winfield Rest Haven II Lc has a walk score of 78. Very walkable. Most errands can be accomplished on foot, and many essentials are within a short walk.

What is the license number of Winfield Rest Haven II Lc?

According to KS state health department records, Winfield Rest Haven II Lc's license number is 175488.

What is the occupancy rate at Winfield Rest Haven II Lc?

Winfield Rest Haven II Lc's occupancy is 98%.

Does Winfield Rest Haven II Lc operate as a for-profit or non-profit?

Winfield Rest Haven II Lc is registered as a non-profit in KS.

Who is the administrator of Winfield Rest Haven II Lc?

Amy Lemer is the administrator of Winfield Rest Haven II Lc.

How many beds does Winfield Rest Haven II Lc have?

Winfield Rest Haven II Lc has 41 beds.

Are there photos of Winfield Rest Haven II Lc?

Yes — there are 7 photos of Winfield Rest Haven II Lc in the photo gallery on this page.

Guides for Better Senior Living

Care Cost Calculator: See Prices in Your Area

Nursing Home Data Explorer

Don’t Wait Too Long: 7 Red Flag Signs Your Parent Needs Assisted Living Now

The True Cost of Assisted Living in 2025 – And How Families Are Paying For It

Understanding Senior Living Costs: Pricing Models, Discounts & Financial Assistance