Explore Open Rooms
1 Contact details
2 What type of senior care service are you looking for?
3 What budget do you have in mind for senior care?
4 How soon do you need to find care?
5 Additional details

Thank you for your interest!

Our team will be in touch shortly to help with next steps.

Nursing Home in Duluth

CMS overall rating Info The Overall CMS Rating combines results from health inspections, staffing levels and quality measures. Health inspections carry the most weight. Staffing and quality scores can increase or decrease the final rating based on performance compared to state and national standards.

Viewcrest Health Center

Overview of Viewcrest Health Center

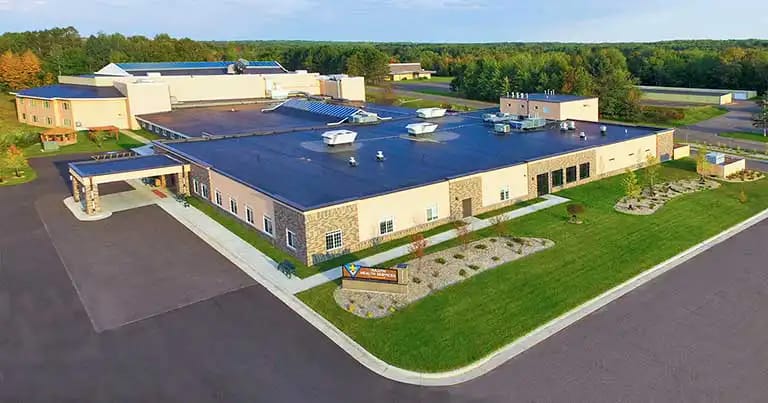
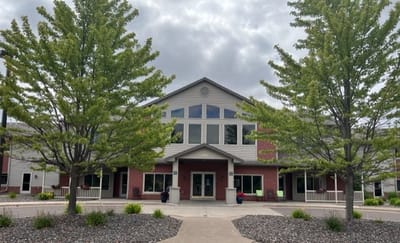
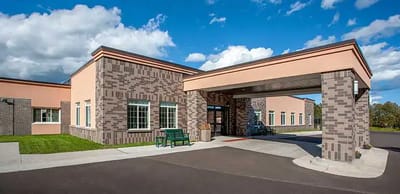
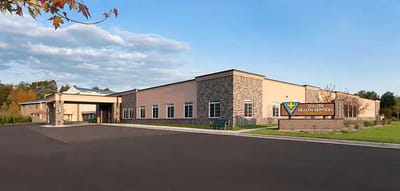
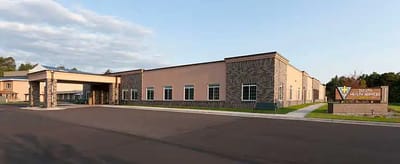
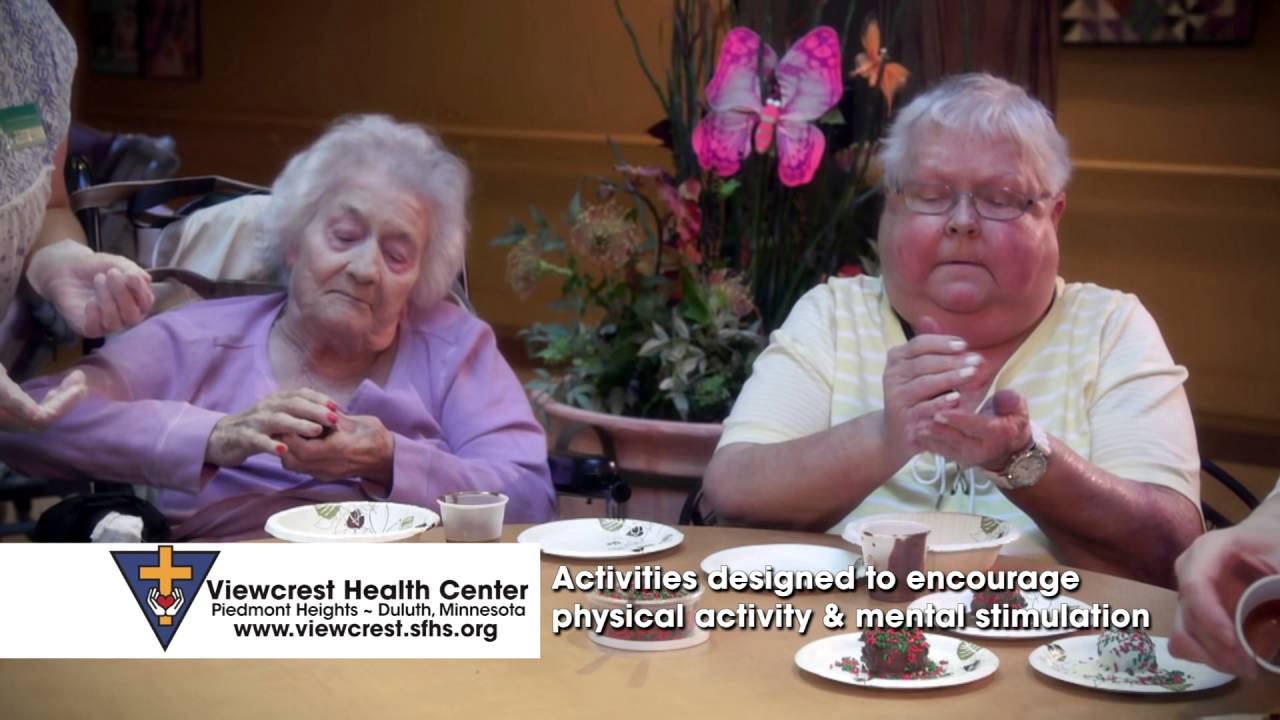
Viewcrest Health Center is a rehabilitation center that provides a sense of independence and individuality to residents regardless of the additional support being received. They boast a multidisciplinary care plan that approaches senior care holistically. As a member of the St. Francis Health Center, Viewcrew provides a home to its residents, so they can live a life as they please.

(218) 727-2773

Quality ratings

Measured by Centers for Medicare & Medicaid Services (CMS)

Overall rating Info The Overall CMS Rating combines results from health inspections, staffing levels and quality measures. Health inspections carry the most weight. Staffing and quality scores can increase or decrease the final rating based on performance compared to state and national standards.
3/5
Minnesota average: 3.2/5
Health Inspection Info Based on the results of the facility's three most recent standard inspections and any complaint investigations. CMS reviews the number, scope, and severity of deficiencies, with more recent findings weighted more heavily.
3/5
Minnesota average: 2.8/5
Staffing Info Measures average nursing staff hours per resident per day, including Registered Nurses (RNs) and total nursing staff. Ratings are adjusted based on the level of care residents require and are compared to state and national benchmarks.
4/5
Minnesota average: 4.1/5
Quality Measures Info Based on clinical and physical health indicators reported to CMS, such as hospital readmissions, falls, pressure ulcers, and improvements in mobility. These measures reflect how well residents' health needs are being managed.
3/5
Minnesota average: 3.1/5

Nursing care per resident

Info This shows how many total hours of nursing staff time are available per resident each day. Higher numbers usually mean more staff support.
4h 14m per day

This home provides 11% less nursing time per resident than the Minnesota average.

Minnesota average: 4h 46m per day

Staffing hours breakdown

Info Hours of care per resident per day, broken down by staff type. Data from CMS Medicare.
Staff type Facility State avg National avg
Registered Nurse (RN) Info Registered nurse hours per resident per day. 55m per day 1h 4m per day 41m per day
Nurse Aide Info Nurse aide hours per resident per day. 2h 32m per day 2h 33m per day 2h 21m per day
Total Nursing (Weekend) Info Total number of nurse staff hours per resident per day on weekends. 3h 15m per day 3h 41m per day 3h 26m per day
Physical Therapist Info Physical therapist staff hours per resident per day. 3m per day 4m per day 4m per day
RN (Weekend) Info Registered nurse hours per resident per day on weekends. 24m per day 41m per day 29m per day

Capacity and availability

Smaller home

May offer a more intimate, personalized care environment.

Total beds 88

This home usually has availability

Lower occupancy suggests more openings may be available.

Lower demand than the Minnesota average
Occupancy rate 83.3%
Residents per day (avg) 81
Occupancy rate
83.3%
Residents per day (avg)
81

Who this home usually serves

TYPE OF STAY

Mostly short-term rehab stays

Most residents typically stay for a few weeks or months before returning home or moving on.

Might be optimal for
Short stays Recovery Medicare-covered care

Breakdown by payment type

Medicare

51% of new residents, usually for short-term rehab.

Typical stay 22 days

Private pay

43% of new residents, often for short stays.

Typical stay 6 months

Medicaid

5% of new residents, often for long-term daily care.

Typical stay 6 - 7 years

Finances and operations

Voluntary non-profit community
Home revenue
$13.9M
Operating deficit
-$478.6K
Voluntary non-profit community
Home revenue
$13.9M
Operating deficit
-$478.6K
Payroll costs Info The portion of the home's budget spent on staff, including nurses, caregivers, and other employees who support care and operations.
$5.9M
42.1% of revenue
Other operating costs Info All remaining costs needed to run the home, such as food, utilities, building maintenance, supplies and administrative expenses.
$8.6M
Total costs $14.4M

Health Inspection History

Inspections
Total health inspections 6

Minnesota average 6


Last Health inspection on Mar 2025

Total health citations 24

Minnesota average 23.2

Citations per inspection
4

Minnesota average 3.76


Health citations are formal notices following inspections when they fail to comply with safety and care standards.

20 of 24 citations resulted from standard inspections; and 4 of 24 resulted from complaint investigations.

Breakdown of citation severity (last 3 years)
Critical Health citations More info 2
186% worse than Minnesota average

Minnesota average: 0.7


Serious Health citations More info 1
100% worse than Minnesota average

Minnesota average: 0.5

2 critical citations More info Minnesota average: 0.7

1 serious citation More info Minnesota average: 0.5

21 moderate citations More info Minnesota average: 21.2

0 minor citations More info Minnesota average: 0.8
Citations history (last 3 years)
Quality of Care critical citation Info Issues related to how well residents receive appropriate treatment and support for their medical and daily care needs. Mar 21, 2025
Corrected

Infection Control moderate citation Info Issues related to preventing and controlling infections, including hygiene practices and safety protocols. Aug 29, 2024
Corrected

Nutrition moderate citation Info Issues related to food quality, meal service, and resident's nutritional needs. Jul 11, 2024
Corrected

Nutrition moderate citation Info Issues related to food quality, meal service, and resident's nutritional needs. Jul 11, 2024
Corrected

Compare Nursing Homes around Duluth The information below is reported by the Minnesota Department of Health, Health Regulation Division.

1 facility compared · CMS & MN Dept. of Health data · Updated Apr 2026

Filter by care type
Viewcrest Health Center
NH

Nursing Home Licensed facility providing 24/7 skilled nursing care for residents with complex, ongoing medical needs. Staffed by RNs, LPNs, and CNAs. Inspected and star-rated annually by CMS. Accepts Medicare (short-term rehab) and Medicaid (long-term care).

AL

Assisted Living A licensed, long-term care setting for seniors or individuals with disabilities who need help with daily activities — like bathing, dressing, and medication management — but not 24-hour skilled nursing. Offers housing, meals, and around-the-clock support while aiming to maximize resident independence.

Duluth (Piedmont Heights)
88
83.3%
+5%
4.23
-3%
-11%
4
24
4.0
3
81
-
40
Edin, Colt
$13.6M
$5.9M
43.1%
245414

Places of interest near Viewcrest Health Center

Address 2.6 miles from city center — 2.54 miles to nearest hospital (Essentia Health-West Duluth Clinic: Physical Therapy (Clinic))

Calculate Travel Distance to Viewcrest Health Center

Add your location

Address

Staffing Data (Q2 2025)

This data corresponds to Q2 2025 and is based on CMS Payroll-Based Journal.

Total staff 173
Employees 105
Contractors 68
Staff to resident ratio 2.06:1
7% worse than Minnesota average

Minnesota average ratio: 2.22:1

Avg staff/day 45
Average shift 8.1 hours
8% better than Minnesota average

Minnesota average: 7.5 hours

Total staff hours (quarter) 33,226
Nursing staff breakdown
Registered Nurse

Manages medical care and health needs.

Total count 23
Average shift length Info Average shift length. Calculated as total hours divided by days worked and average staff per day. 8.6 hours

This role is partially covered by contractors.

Licensed Practical Nurse

Assists with medical care and medications.

Total count 12
Average shift length Info Average shift length. Calculated as total hours divided by days worked and average staff per day. 11.1 hours

This role is partially covered by contractors.

Certified Nursing Assistant

Helps with daily care and mobility.

Total count 98
Average shift length Info Average shift length. Calculated as total hours divided by days worked and average staff per day. 8.2 hours

This role is partially covered by contractors.

Contractor staffing

Total hours from contractors

20.3%

6,738 contractor hours this quarter

Certified Nursing Assistant: 35 Registered Nurse: 7 Qualified Social Worker: 5 Speech Language Pathologist: 4 Licensed Practical Nurse: 4 Physical Therapy Assistant: 4 Physical Therapy Aide: 3 Respiratory Therapy Technician: 3 Occupational Therapy Aide: 1 Medical Director: 1 Occupational Therapy Assistant: 1
Staff by category
Certified Nursing Assistant63359816,29291100%8.2
Registered Nurse167235,84791100%8.6
Licensed Practical Nurse84122,52291100%11.1
Medication Aide/Technician7072,05691100%9.1
Other Dietary Services Staff6061,95391100%7.6
Physical Therapy Assistant0445856470%5.7
Speech Language Pathologist0445096369%5.3
Nurse Practitioner1014725965%8
Clinical Nurse Specialist1014485662%8
Physical Therapy Aide0334426268%4.8
Dietitian1014405560%8
Dental Services Staff1014175965%7.1
Qualified Social Worker0554106673%5.2
Respiratory Therapy Technician0333956369%5.6
Administrator1012775459%5.1
Occupational Therapy Aide0111303640%3.6
Occupational Therapy Assistant01133910%3.7
Medical Director011111%1
98 Certified Nursing Assistant
% of Days 100%
23 Registered Nurse
% of Days 100%
12 Licensed Practical Nurse
% of Days 100%
7 Medication Aide/Technician
% of Days 100%
6 Other Dietary Services Staff
% of Days 100%
4 Physical Therapy Assistant
% of Days 70%
4 Speech Language Pathologist
% of Days 69%
1 Nurse Practitioner
% of Days 65%
1 Clinical Nurse Specialist
% of Days 62%
3 Physical Therapy Aide
% of Days 68%
1 Dietitian
% of Days 60%
1 Dental Services Staff
% of Days 65%
5 Qualified Social Worker
% of Days 73%
3 Respiratory Therapy Technician
% of Days 69%
1 Administrator
% of Days 59%
1 Occupational Therapy Aide
% of Days 40%
1 Occupational Therapy Assistant
% of Days 10%
1 Medical Director
% of Days 1%

Facility Characteristics

Source: CMS Long-Term Care Facility Characteristics (Data as of Jan 2026)

Total census
84 residents
Residents by payment source
Medicare
21 residents (25%)
Medicaid
42 residents (50%)
Private pay or other
21 residents (25%)
Programs & Services
Residents' Group

Residents meet regularly to discuss policies, care quality, and activities

Active Resident Council

Organized group of residents that meets regularly to discuss facility policies, quality of life, and activities.

Quality of care over time

These measures show how residents usually do over time at this home, based on health outcomes and preventive care.

High-risk clinical events score Info A composite score based on pressure ulcers, falls with injury, weight loss, walking ability decline, and activities of daily living decline. 13.6
23% worse than Minnesota average

Minnesota average: 11.1

Functional decline score Info A composite score based on activities of daily living decline, walking ability decline, and incontinence. 28.5
26% worse than Minnesota average

Minnesota average: 22.6

Long-stay resident measures
Average Minnesota avg: 2.9 Info CMS star rating based on long-stay quality measure performance. 5 stars = significantly above average, 1 star = significantly below average.
Need for Help with Daily Activities Increased Info Percent of long-stay residents whose need for help with daily activities has increased 23.9%
26% worse than Minnesota average

Minnesota average: 18.9%

Walking Ability Worsened Info Percent of long-stay residents whose ability to move independently worsened 32.6%
37% worse than Minnesota average

Minnesota average: 23.8%

Low Risk Residents with Bowel/Bladder Incontinence Info Percent of low risk long-stay residents who lose control of their bowels or bladder 29.1%
16% worse than Minnesota average

Minnesota average: 25.0%

Falls with Major Injury Info Percent of long-stay residents experiencing one or more falls with major injury 3.1%
18% better than Minnesota average

Minnesota average: 3.7%

High Risk Residents with Pressure Ulcers Info Percent of long-stay high risk residents with pressure ulcers 7.5%
38% worse than Minnesota average

Minnesota average: 5.4%

Urinary Tract Infection Info Percent of long-stay residents with a urinary tract infection 1.2%
57% better than Minnesota average

Minnesota average: 2.7%

Lost Too Much Weight Info Percent of long-stay residents who lose too much weight 1.0%
75% better than Minnesota average

Minnesota average: 4.1%

Depressive Symptoms Info Percent of long-stay residents who have depressive symptoms 7.9%
81% worse than Minnesota average

Minnesota average: 4.4%

Antipsychotic Use Info Percent of long-stay residents who received an antipsychotic medication 17.7%
In line with Minnesota average

Minnesota average: 17.2%

Pneumococcal Vaccine Info Percent of long-stay residents assessed and appropriately given the pneumococcal vaccine 82.3%
15% worse than Minnesota average

Minnesota average: 97.3%

Influenza Vaccine Info Percent of long-stay residents assessed and appropriately given the seasonal influenza vaccine 95.5%
In line with Minnesota average

Minnesota average: 96.0%

Hospitalizations per 1,000 days Info Number of hospitalizations per 1,000 long-stay resident days. 1.23
26% better than Minnesota average

Minnesota average: 1.67

ED visits per 1,000 days Info Number of outpatient emergency department visits per 1,000 long-stay resident days. 0.69
65% better than Minnesota average

Minnesota average: 1.99

Short-stay resident measures
Above average Minnesota avg: 2.7 Info CMS star rating based on short-stay quality measure performance. 5 stars = much above average, 1 star = much below average.
Pneumococcal Vaccine Info Percent of short-stay residents assessed and appropriately given the pneumococcal vaccine 49.6%
44% worse than Minnesota average

Minnesota average: 88.9%

Antipsychotic medication increase Info Percent of short-stay residents who newly received an antipsychotic medication 2.1%
8% worse than Minnesota average

Minnesota average: 1.9%

Influenza Vaccine Info Percent of short-stay residents assessed and appropriately given the seasonal influenza vaccine 77.3%
6% worse than Minnesota average

Minnesota average: 82.6%

Re-hospitalized after SNF stay Info Percentage of short-stay residents who were re-hospitalized after their nursing home admission. 13.6%
41% better than Minnesota average

Minnesota average: 23.1%

Emergency department visits Info Percentage of short-stay residents who had an outpatient emergency department visit. 7.2%
49% better than Minnesota average

Minnesota average: 14.0%

Falls with major injury Info Percentage of SNF residents who experience falls with major injury during their stay. 0.0%
100% better than Minnesota average

Minnesota average: 0.8%

Ability to care for self at discharge Info Percentage of residents at or above expected ability to care for themselves at discharge. 54.4%
In line with Minnesota average

Minnesota average: 53.7%

Successful return to home or community Info Rate of successful return to home or community from a skilled nursing facility. 52.0%
In line with Minnesota average

Minnesota average: 50.6%

Penalties and fines

Federal penalties imposed by CMS for regulatory violations, including civil money penalties (fines) and denials of payment for new Medicare/Medicaid admissions.

Source: CMS Penalties Database (Data as of Jan 2026)

Total fines amount $61K
37% higher than Minnesota average

Minnesota average: $44K

Number of fines 4
99% more fines than Minnesota average

Minnesota average: 2.0

Payment Denials Info Serious action where Medicare and/or Medicaid temporarily stops payments for new residents until issues are fixed. 0
100% fewer payment denials than Minnesota average

Minnesota average: 0.4

Fines amount comparison
This facility $61K
Minnesota average $44K
Penalty History

Penalties are imposed by CMS for violations of federal nursing home regulations.

Civil Money Penalty Info Fines imposed for noncompliance, which can be assessed per day or per instance of violation. Mar 21, 2025
$27K
Civil Money Penalty Info Fines imposed for noncompliance, which can be assessed per day or per instance of violation. Jul 11, 2024
$11K
Civil Money Penalty Info Fines imposed for noncompliance, which can be assessed per day or per instance of violation. May 14, 2024
$14K
Civil Money Penalty Info Fines imposed for noncompliance, which can be assessed per day or per instance of violation. Feb 14, 2024
$9K

Last updated: Jan 2026

Guides for Better Senior Living

Care Cost Calculator: See Prices in Your Area

Nursing Home Data Explorer

Don’t Wait Too Long: 7 Red Flag Signs Your Parent Needs Assisted Living Now

The True Cost of Assisted Living in 2025 – And How Families Are Paying For It

Understanding Senior Living Costs: Pricing Models, Discounts & Financial Assistance

Financial Aid for Minnesota Seniors

Get financial aid guidance

Elderly Waiver

Minnesota Medicaid EW

Age 65+, Minnesota resident, Medicaid-eligible, nursing home-level care need.

~$2,829/month (300% FBR, individual).

$3,000 (individual, higher than most states).

Higher asset limit; rural access focus.

Essential Community Supports (ECS)

Minnesota ECS

Age 65+, Minnesota resident, at risk of decline but not nursing home level.

~$1,732/month (individual, varies).

$3,000 (individual).

Bridges gap for those ineligible for waivers.

Alternative Care (AC) Program

Minnesota Alternative Care Program

Age 65+, Minnesota resident, NFLOC, not MA-eligible.

~$1,255-$2,829/month (100%-300% FPL); sliding scale copays.

$3,000 (individual); home equity limit $713,000.

CDCS option; statewide via counties.

Minnesota Senior Health Options (MSHO)

Minnesota Senior Health Options

Age 65+, Minnesota resident, eligible for MA and Medicare Parts A/B.

~$1,255/month (100% FPL for MA); spenddown allowed.

$3,000 (individual), $6,000 (couple).

7 health plans (e.g., UCare, HealthPartners); care coordinator assigned.

Minnesota Senior Care Plus (MSC+)

Minnesota Senior Care Plus

Age 65+, Minnesota resident, MA-eligible, not on Medicare.

~$1,255/month (100% FPL); spenddown allowed.

$3,000 (individual), $6,000 (couple).

Includes EW services; 7 health plans available.

Consumer Support Grant (CSG)

Minnesota Consumer Support Grant

Age 65+ or disabled, Minnesota resident, eligible for MA personal care but opts for grant.

~$1,255/month (MA-eligible); spenddown allowed.

$3,000 (individual).

Can hire family; statewide via counties.

Medicare Savings Program (MSP)

Minnesota Medicare Savings Program

Age 65+ or disabled, Minnesota resident, Medicare Part A/B.

~$2,510/month (QMB), ~$3,380/month (SLMB), ~$3,598/month (QI)—individual.

$9,430 (individual), $14,130 (couple).

Three tiers; no waitlist; includes Extra Help for Part D.

VA Aid and Attendance (A&A) and Housebound Benefits

Minnesota VA Aid and Attendance/Housebound

Age 65+ or disabled veteran/spouse, Minnesota resident, wartime service, need for ADL help (A&A) or homebound.

Net income < ~$1,984/month (veteran with dependent, A&A); pension offsets income.

~$155,356 (net worth limit).

High veteran demand in rural/urban areas.

Tour Icon
Planning a tour? Check our touring checklist.
Chat Icon
Thinking of living here? We can help you speak to a current resident