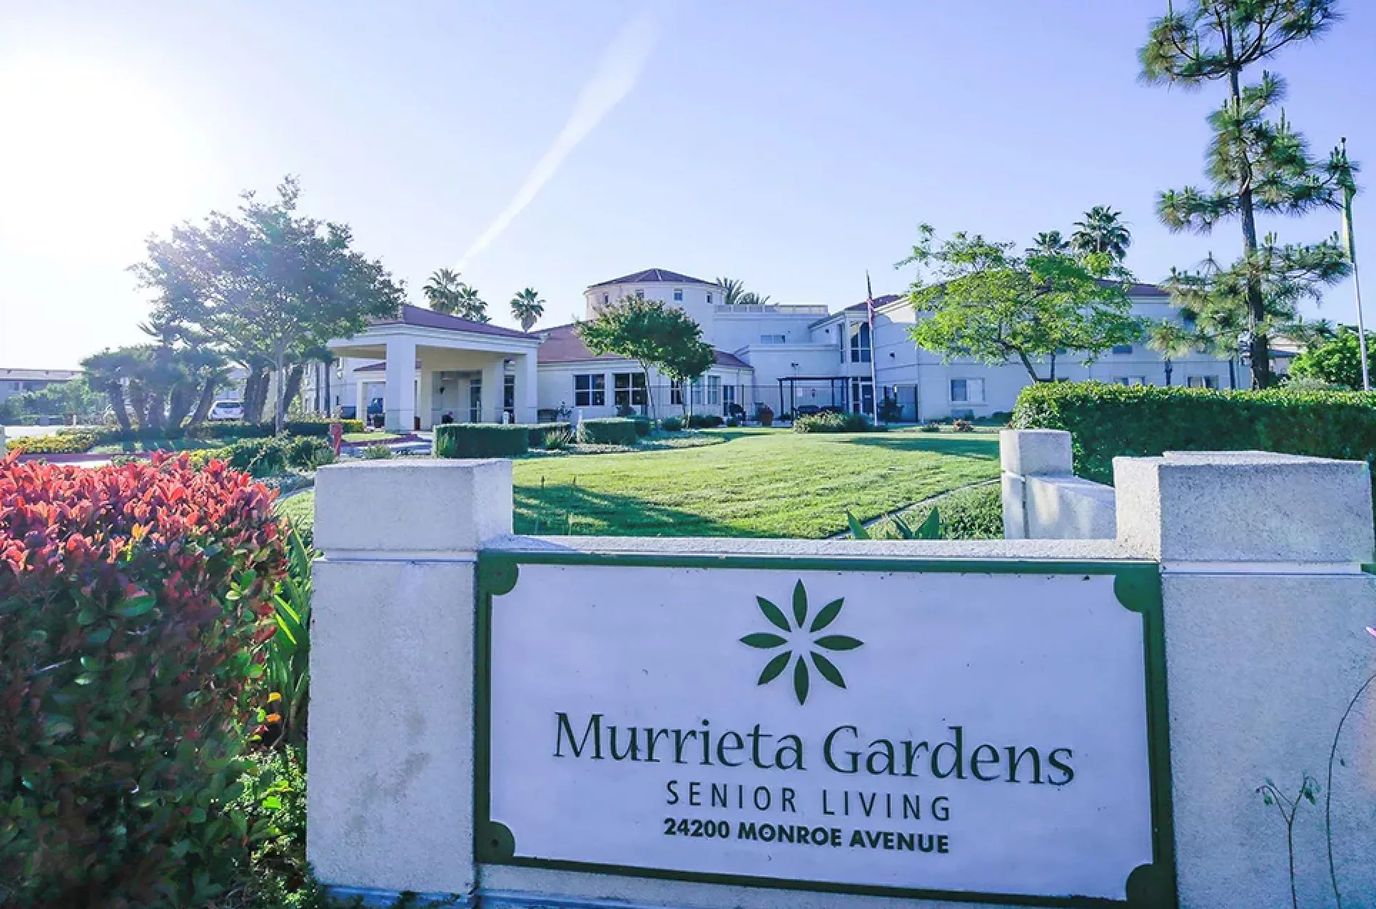

Murrieta Gardens
Nursing Home, Memory Care & Respite Care · Los Angeles, CA
CMS overall rating Info The Overall CMS Rating is scored from 1 to 5 stars and combines results from health inspections, staffing levels, and quality measures. Health inspections carry the most weight. Staffing and quality scores can increase or decrease the final rating based on performance compared to state and national standards.

Murrieta Gardens

Nursing Home, Memory Care & Respite Care · Los Angeles, CA
CMS overall rating Info The Overall CMS Rating is scored from 1 to 5 stars and combines results from health inspections, staffing levels, and quality measures. Health inspections carry the most weight. Staffing and quality scores can increase or decrease the final rating based on performance compared to state and national standards.
Calculator: See prices in your area
Murrieta Gardens accepts Medicare and private pay.

Overview of Murrieta Gardens

Murrieta Gardens is an elegant memory care community that provides compassionate and dedicated service in a warm and welcoming environment. With an emphasis on dementia or Alzheimer’s care, management creates an environment where seniors can holistically cultivate their wellness. This premier community promotes a person-centered approach focused on the needs of its residents that leads to receiving the best possible care.
The Murrieta Garden’s lifestyle revolves around comfort and convenience by offering a range of comprehensive amenities and services that help with everyday living; seniors receive medical and wellness services– ADLs, 24-hour care, medication administration, and personalized care plans. Other services include respite care, delicious dining, social activities, transportation, housekeeping, and stimulating programs.

Quality ratings

Measured by Centers for Medicare & Medicaid Services (CMS)

Overall rating Info The Overall CMS Rating combines results from health inspections, staffing levels and quality measures. Health inspections carry the most weight. Staffing and quality scores can increase or decrease the final rating based on performance compared to state and national standards.
▼ 44.4% Below CA avg. ▼ 44.4% Below CA avg.Click the badge to see the full State ranking.Click here to see the full State ranking.
Health Inspection Info Based on the results of the facility's three most recent standard inspections and any complaint investigations. CMS reviews the number, scope, and severity of deficiencies, with more recent findings weighted more heavily.
▼ 36.5% Below CA avg. ▼ 36.5% Below CA avg.Click the badge to see the full State ranking.Click here to see the full State ranking.
Staffing Info Measures average nursing staff hours per resident per day, including Registered Nurses (RNs) and total nursing staff. Ratings are adjusted based on the level of care residents require and are compared to state and national benchmarks.
▼ 13.0% Below CA avg. ▼ 13.0% Below CA avg.Click the badge to see the full State ranking.Click here to see the full State ranking.
Quality Measures Info Based on clinical and physical health indicators reported to CMS, such as hospital readmissions, falls, pressure ulcers, and improvements in mobility. These measures reflect how well residents' health needs are being managed.
▼ 6.1% Below CA avg. ▼ 6.1% Below CA avg.Click the badge to see the full State ranking.Click here to see the full State ranking.

Staffing hours breakdown

Info Daily nursing hours per resident by staff type, reported to CMS. Higher is generally better — compare this facility to state and national averages to see where staffing stands.

Hours per resident per day — compared to California state averages

Total nursing care / resident Info This home is ranked 122nd out of 346 homes in California. Total adjusted nursing hours per resident per day, combining RN, LPN, and aide time. CMS adjusts this for case-mix so facilities can be fairly compared.
4h 18m per day
Rank #122 / 346Nurse hours — State benchmarkedThis home is ranked 122nd out of 346 homes in California. Shows adjusted nurse hours per resident per day benchmarked to the California average, with a ranking across 346 California SNFs. More hours mean more direct care. The national average is about 3.5 hrs; below 3.0 is a red flag.Click the rank badge to see the full State ranking.Click here to see the full State ranking.
This facility California avg (4h 23m per day)
vs California avg
-2%

1 of 1 metrics below state avg

Staff typeHours / Day / Residentvs state avg
Weekend Total Nursing Info Combined nursing hours (RN + LPN + Nurse Aide) per resident per day on weekends. Staffing often drops on weekends — this figure reveals whether the facility maintains adequate coverage outside of weekday hours. 3h 46m per day ▼ 7% State avg: 4h 4m per day · National avg: 3h 25m per day

Types of Care at Murrieta Gardens

Memory Care Respite Care

Capacity and availability

Avg. Length of Stay
51 days
Bed community size
126-bed community Rank #521 / 1658Bed count — State benchmarkedThis home is ranked 521st out of 1658 homes in California. Shows this facility's certified or reported bed count compared to other California SNFs. Larger communities may offer more amenities, programs, and on-site services for residents and families.Click the rank badge to see the full State ranking.Click here to see the full State ranking.
A larger shared setting that may offer more common spaces and organized community services.
Years in operation
1 year in operation Rank #1259 / 1365Years in operation — State benchmarkedThis home is ranked 1259th out of 1365 homes in California. Shows how long this facility has been in operation compared to other California SNFs. Longer operating histories may benefit residents, families, and staff.Click the rank badge to see the full State ranking.Click here to see the full State ranking.
A newer community that may feature more recent facilities and programs.
Walk Score
Walk Score: 33 / 100 Rank #1680 / 2093Walk Score — State benchmarkedThis home is ranked 1680th out of 2093 homes in California. Shows how walkable this facility's neighborhood is compared to the average Walk Score across California SNFs. Higher scores benefit residents, families, and staff.Click the rank badge to see the full State ranking.Click here to see the full State ranking.
Somewhat walkable. A few nearby services may be reachable on foot, but most trips require transportation.

About this community

Occupancy

Occupancy rate
32%
Rank #1362 / 1407Occupancy rate — State benchmarkedThis home is ranked 1362nd out of 1407 homes in California. Shows this facility's occupancy rate versus the California average, with its Statewide rank out of 1407. Higher occupancy signals strong local demand and financial stability.Click the rank badge to see the full State ranking.Click here to see the full State ranking.
Lower than the California average: 72.8%
Occupied beds
40 / 126
Average occupied beds in California homes 87 beds

License Details

Facility TypeResidential Care Elderly
StatusLicensed
IssuanceOctober 18, 2024
CountyRiverside
RCFE Number331881582

Ownership & Operating Entity

Murrieta Gardens is legally operated by Murrieta Gardens Assisted Living Llc, and administrated by Brittany Kavenaugh.

Safety & Compliance

Safety FeaturesSafe, secure environment.

Therapy & Rehabilitation

1 service
Respite Care

Staffing & Medical

1 service
24-Hour Staffing

Amenities & Lifestyle

A Wide Selection Of Specialized Activities
Health Monitoring And Medication Management
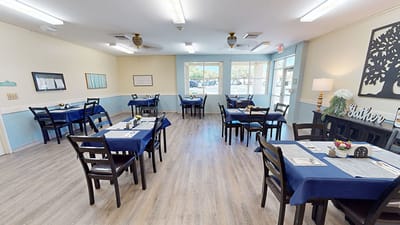
Three Freshly Prepared Meals A Day With Special Dietary Options Available
On-Site Laundry
Salon Services
Weekly Housekeeping
Arts And Crafts
Special Events
Specific ProgramsServices and Amenities, Floor Plans & Gallery, Career

Dining & Nutrition

Food DescriptionThree freshly prepared meals a day with special dietary options available.

Contact Murrieta Gardens

Inspection History

In California, the Department of Social Services (for assisted living facilities) and the Department of Public Health (for nursing homes) conduct inspections to ensure resident safety and regulatory compliance.

Inspection Score Info A composite 0–100 score combining this facility's inspections, citations, complaints, and enforcement actions relative to the California state average. See the nursing homes benchmark below for the typical California score; higher is better.

Above the California average for nursing homes.

California nursing homes benchmark: C- 70/100

Inspection score: 89 out of 100. Letter grade B+. Above the California average for nursing homes.

Inspection Scorecard Info This scorecard compares key inspection, citation, and complaint metrics at this facility against the California state average. Metrics rated ≥15% worse than average are highlighted in red; those ≥15% better are highlighted in green.

Since 2024 vs. California state average
Overall vs. CA average 0 Worse No metrics in this bucket. 5 Better Metrics better than California average:
• Total citations (100% below)
• Total visits (75% below)
• Complaint visits (85% below)
• Other visits (86% below)
• Official inspections (75% below)
Latest Inspection April 28, 2026

Citations Info Citations are formal regulatory issues recorded during state inspections.

This FacilityCA Averagevs. CA Avg
Total citations Info Formal regulatory issues recorded by inspectors across all inspection types. 010 This facility has 100% fewer total citations than a typical California nursing home (0 vs. CA avg 10).↓ 100% better

Inspections & Visits Info State inspections evaluate whether the facility meets health and safety standards.

This FacilityCA Averagevs. CA Avg
Total visits Info Combined count of complaint visits, other regulatory visits, and official scheduled inspections. 416 This facility has 75% fewer total visits than a typical California nursing home (4 vs. CA avg 16).↓ 75% better
Complaint visits Info On-site visits triggered by formal complaints filed by residents, families, or staff. 213 This facility has 85% fewer complaint visits than a typical California nursing home (2 vs. CA avg 13).↓ 85% better
Other visits Info Regulatory visits that are neither routine inspections nor complaint investigations — administrative check-ins, follow-up reviews, licensing-related visits. 17 This facility has 86% fewer other visits than a typical California nursing home (1 vs. CA avg 7).↓ 86% better
Official inspections Info Routine, scheduled inspections conducted by state regulators to evaluate whether the facility meets federal and state standards. 14 This facility has 75% fewer official inspections than a typical California nursing home (1 vs. CA avg 4).↓ 75% better

Inspection Reports Summary Info An editor-reviewed summary of the themes and findings across this facility's recent inspection reports.

This facility’s inspection record is mostly clean, with no deficiencies found during the last two annual and licensing visits in 2024 and 2025. The most recent inspection on March 3, 2026, was a complaint investigation that found insufficient evidence to substantiate an allegation of staff failing to prevent resident altercation. Records, safety equipment, and facility conditions were consistently compliant, and no substantiated complaints or safety hazards were reported.

Read the full inspection reports for this facility, including detailed findings and corrective actions.

Show Inspection Reports

Health Inspection History

Inspections since 2023
Total health inspections 20

California average 12.5


Last Health inspection on Jul 2025

Total health citations
70 Rank #289 / 354Health citations — State benchmarkedThis home is ranked 289th out of 354 homes in California. Shows this facility's total health deficiency citations benchmarked to the California State average, with a ranking across all 354 CA SNFs. Lower citation counts earn a better rank.Click the rank badge to see the full State ranking.Click here to see the full State ranking.

California average 50.2

Citations per inspection
3.5 Rank #110 / 354Citations per inspection — State benchmarkedThis home is ranked 110th out of 354 homes in California. Shows average deficiency citations per CMS inspection for this facility versus the California mean across 354 SNFs with citation data. Lower is better.Click the rank badge to see the full State ranking.Click here to see the full State ranking.

California average 4.65


Health citations are formal notices following inspections when they fail to comply with safety and care standards.

48 of 70 citations resulted from standard inspections; and 22 of 70 resulted from complaint investigations.

Breakdown of citation severity (last 3 years)
Critical health citations
0
100% better than California average

California average: 0.4


Serious health citations
0
100% better than California average

California average: 1

0 critical citations California average: 0.4

0 serious citations California average: 1

70 moderate citations California average: 47.2

0 minor citations California average: 1.5
Citations history (last 3 years)
Abuse/Neglect moderate citation Jul 03, 2025
Corrected

Abuse/Neglect moderate citation Jul 03, 2025
Corrected

Resident Rights moderate citation Mar 27, 2025
Corrected

Infection Control moderate citation Dec 12, 2024
Corrected

Staffing Data

Reporting period: October 1 – December 31, 2025 (Q4 2025). Source: CMS Payroll-Based Journal report.

Total staff 195
Employees 192
Contractors 3
Staff to resident ratio 1.50:1
17% worse than California average
California average ratio: 1.81:1 California average ratio: 1.81:1See full California ranking
Avg staff/day 87
Average shift 7.6 hours
0% compared with California average
California average: 7.7 hours California average shift: 7.7 hoursSee full California ranking
Total staff hours (quarter) 60,582

Nursing staff breakdown

Q4 2025 · Oct 1 – Dec 31 More info This data comes from the CMS Payroll-Based Journal report covering October 1 – December 31, 2025.
Registered Nurse

Manages medical care and health needs.

RN Staff 8
Average shift length Info Average shift length. Calculated as total hours divided by days worked and average staff per day. 7.5 hours

No contractors work on this role.

Licensed Practical Nurse

Assists with medical care and medications.

LPN Staff 45
Average shift length Info Average shift length. Calculated as total hours divided by days worked and average staff per day. 8.1 hours

No contractors work on this role.

Certified Nursing Assistant

Helps with daily care and mobility.

CNA Staff 96
Average shift length Info Average shift length. Calculated as total hours divided by days worked and average staff per day. 7.4 hours

No contractors work on this role.

Contractor staffing

Q4 2025 · Oct 1 – Dec 31 More info This data comes from the CMS Payroll-Based Journal report covering October 1 – December 31, 2025.

Total hours from contractors

0.2%

146 contractor hours this quarter

Occupational Therapy Assistant: 1 Medical Director: 1 Other Physician: 1

Staff by category

Q4 2025 · Oct 1 – Dec 31 More info This data comes from the CMS Payroll-Based Journal report covering October 1 – December 31, 2025.
Certified Nursing Assistant9609629,88292100%7.4
Licensed Practical Nurse4504515,79192100%8.1
Registered Nurse8083,27592100%7.5
Physical Therapy Assistant5051,5909098%7
Respiratory Therapy Technician5051,5558896%7.8
Physical Therapy Aide7071,3638390%6.5
Dental Services Staff3031,2836470%8.7
Speech Language Pathologist110111,2688997%6.6
Other Dietary Services Staff3031,04192100%7.8
RN Director of Nursing2021,0166470%8
Nurse Practitioner1015126470%8
Occupational Therapy Aide1015126470%8
Dietitian1015066874%7.4
Administrator1014565762%8
Qualified Social Worker3033867582%4.4
Occupational Therapy Assistant011921314%7.1
Other Physician011281213%2.3
Medical Director011261011%2.6
96 Certified Nursing Assistant
% of Days 100%
45 Licensed Practical Nurse
% of Days 100%
8 Registered Nurse
% of Days 100%
5 Physical Therapy Assistant
% of Days 98%
5 Respiratory Therapy Technician
% of Days 96%
7 Physical Therapy Aide
% of Days 90%
3 Dental Services Staff
% of Days 70%
11 Speech Language Pathologist
% of Days 97%
3 Other Dietary Services Staff
% of Days 100%
2 RN Director of Nursing
% of Days 70%
1 Nurse Practitioner
% of Days 70%
1 Occupational Therapy Aide
% of Days 70%
1 Dietitian
% of Days 74%
1 Administrator
% of Days 62%
3 Qualified Social Worker
% of Days 82%
1 Occupational Therapy Assistant
% of Days 14%
1 Other Physician
% of Days 13%
1 Medical Director
% of Days 11%

Penalties and fines

Federal penalties imposed by CMS for regulatory violations, including civil money penalties (fines) and denials of payment for new Medicare/Medicaid admissions.

Source: CMS Penalties Database

No penalties in the past 3 years

No civil money penalties or payment denials were reported in the last 3 years.

Quality of care over time

These measures show how residents usually do over time at this home, based on health outcomes and preventive care.

High-risk clinical events score Info A composite score based on pressure ulcers, falls with injury, weight loss, walking ability decline, and activities of daily living decline. 2.5
63% better than California average

California average: 6.6

Functional decline score Info A composite score based on activities of daily living decline, walking ability decline, and incontinence. 4.4
61% better than California average

California average: 11.3

Long-stay resident measures
Need for Help with Daily Activities Increased Info Percent of long-stay residents whose need for help with daily activities has increased 2.1%
81% better than California average

California average: 11.1%

Walking Ability Worsened Info Percent of long-stay residents whose ability to move independently worsened 4.6%
62% better than California average

California average: 12.0%

Low Risk Residents with Bowel/Bladder Incontinence Info Percent of low risk long-stay residents who lose control of their bowels or bladder 6.5%
42% better than California average

California average: 11.3%

Falls with Major Injury Info Percent of long-stay residents experiencing one or more falls with major injury 1.9%
13% worse than California average

California average: 1.7%

High Risk Residents with Pressure Ulcers Info Percent of long-stay high risk residents with pressure ulcers 1.8%
64% better than California average

California average: 5.0%

Urinary Tract Infection Info Percent of long-stay residents with a urinary tract infection 2.4%
96% worse than California average

California average: 1.2%

Lost Too Much Weight Info Percent of long-stay residents who lose too much weight 2.1%
51% better than California average

California average: 4.2%

Depressive Symptoms Info Percent of long-stay residents who have depressive symptoms 12.8%
91% worse than California average

California average: 6.7%

Antipsychotic Use Info Percent of long-stay residents who received an antipsychotic medication 9.0%
11% better than California average

California average: 10.1%

Pneumococcal Vaccine Info Percent of long-stay residents assessed and appropriately given the pneumococcal vaccine 100.0%
In line with California average

California average: 98.5%

Influenza Vaccine Info Percent of long-stay residents assessed and appropriately given the seasonal influenza vaccine 99.0%
In line with California average

California average: 98.2%

Short-stay resident measures
Pneumococcal Vaccine Info Percent of short-stay residents assessed and appropriately given the pneumococcal vaccine 99.5%
6% better than California average

California average: 94.0%

Antipsychotic medication increase Info Percent of short-stay residents who newly received an antipsychotic medication 0.4%
72% better than California average

California average: 1.5%

Influenza Vaccine Info Percent of short-stay residents assessed and appropriately given the seasonal influenza vaccine 99.0%
6% better than California average

California average: 93.2%

Breakdown by payment type

Medicare

21% of new residents, usually for short-term rehab.

Typical stay 25 days

Private pay

78% of new residents, often for short stays.

Typical stay 19 days

Facility Characteristics

Source: CMS Long-Term Care Facility Characteristics (Data as of Jan 2026)

Total residents 130
Medicare
6
4.6% of residents
Medicaid
92
70.8% of residents
Private pay or other
32
24.6% of residents
Programs & Services
Residents Group

Residents meet regularly to discuss policies, care quality, and activities

Nurse Aide Training

State-approved Nurse Aide Training and Competency Evaluation Program on-site

Active Resident Council

Organized group of residents that meets regularly to discuss facility policies, quality of life, and activities.

Finances and operations

Privately-owned community
Home revenue
$21.7M
Operating loss
-$170.8K
Privately-owned community
Home revenue
$21.7M Rank #118 / 347Revenue — State benchmarkedThis home is ranked 118th out of 347 homes in California. Shows this facility's annual revenue compared to the California SNF average. Higher revenue generally means more resources for staffing and capital — read alongside Payroll %.Click the rank badge to see the full State ranking.Click here to see the full State ranking.
Operating loss
-$170.8K
Payroll costs Info The portion of the home's budget spent on staff, including nurses, caregivers, and other employees who support care and operations. Rank #68 / 347Payroll — State benchmarkedThis home is ranked 68th out of 347 homes in California. Shows total annual staff payroll benchmarked to the California average. Higher payroll investment relative to peers often signals better staffing and less reliance on cheaper contract labor.Click the rank badge to see the full State ranking.Click here to see the full State ranking.
$12.1M
55.9% of revenue Rank #112 / 347Payroll % — State benchmarkedThis home is ranked 112th out of 347 homes in California. Shows payroll as a percentage of revenue versus the California average. Well-run California SNFs typically land around 56–67% — the top third Statewide. Below 25% may signal understaffing or heavy agency use — read with Staffing ratings.Click the rank badge to see the full State ranking.Click here to see the full State ranking.
Other operating costs Info All remaining costs needed to run the home, such as food, utilities, building maintenance, supplies and administrative expenses.
$9.8M
Total costs $21.9M

Who this home usually serves

TYPE OF STAY

Primarily short stays

Residents typically stay for brief periods, with frequent admissions and discharges throughout the year.

Video

Get to know the community with a high-definition video tour
Video tour: Murrieta Gardens
Watch this video about life at Murrieta Gardens
icon

Matterport

Experience a digital walkthrough
Loading tour...

Places of interest near Murrieta Gardens

Address 1.0 miles from city center Info Estimated distance in miles from Murrieta's city center to Murrieta Gardens's address, calculated via Google Maps. — 1.86 miles to nearest hospital (Children's Primary Care Medical Group Murrieta)

Calculate Travel Distance to Murrieta Gardens

Add your location

Address

Financial Assistance for
Nursing Home in California

Murrieta Gardens is located in Murrieta, California.
Here are the financial assistance programs available to residents in California.

Get Financial aid guidance

Multipurpose Senior Services Program

MSSP (Medi-Cal Waiver)

Age 65+
General California resident, Medi-Cal eligible, nursing home risk.
Income Limits (2025) ~$2,829/month 300% FBR, individual
Asset Limits $2,000 (individual), $3,000 (couple).
CA

County-managed; waitlists possible.

Benefits
In-home support (4-6 hours/day) Respite care (14 days/year) Meals (~$6/meal) Transportation (8 trips/month) Care management

In-Home Supportive Services (IHSS)

California IHSS

Age 65+
General California resident, Medicaid-eligible or low-income.
Income Limits ~$1,732/month individual, Medi-Cal threshold
Asset Limits $2,000 individual
CA

Can hire family as caregivers.

Benefits
Personal care (up to 283 hours/month) Homemaker services Respite (varies)

Multipurpose Senior Services Program (MSSP)

CA MSSP

Age 65+
General California resident, Medi-Cal-eligible, nursing home-eligible but community-capable.
Income Limits ~$2,829/month 300% FBR, individual
Asset Limits $2,000 individual
CA

Available in 38 counties; waitlists common.

Benefits
Case management Respite care (up to 10 days/year) Minor home mods (avg. $500) Adult day care (~$50/day)

Property Tax Postponement Program (PTP)

CA PTP

Age 62+
General California resident, own and live in home, 40% equity.
Income Limits (2025) ~$51,500/year household, adjusted annually
Asset Limits Equity-based; no strict asset cap.
CA

Deferred taxes accrue interest (5% as of 2024); repaid upon sale/death.

Benefits
Property tax deferral (avg. $1,000-$3,000/year, varies by county)

Assisted Living Waiver (ALW)

CA ALW

Age 65+ or disabled
General California resident, Medi-Cal-eligible, nursing home-eligible.
Income Limits ~$2,829/month 300% FBR, individual
Asset Limits $2,000 individual
CA

Available in 15 counties (e.g., LA, Sacramento); waitlists common.

Benefits
Personal care in ALFs (5-7 hours/day) Medication management Social services

California CARES Program

CA CARES

Age
General Caregivers of California residents 60+ needing help with 3+ daily activities; no caregiver age limit.
Income Limits No strict limit; cost-sharing above ~$2,500/month threshold.
Asset Limits Not applicable; need-based.
CA

High demand in urban areas; complements IHSS respite.

Benefits
Respite care (up to 10 days/year) Counseling (4-6 sessions/year) Training (2-3 workshops/year) Supplies (~$200/year)

Frequently Asked Questions about Murrieta Gardens

What neighborhood is Murrieta Gardens in?

Murrieta Gardens is in the California Oaks neighborhood of Murrieta.

Who is the owner of Murrieta Gardens?

The legal owner and operator of Murrieta Gardens is Murrieta Gardens Assisted Living Llc.

Is Murrieta Gardens in a walkable area?

Murrieta Gardens has a walk score of 33. Somewhat walkable. A few nearby services may be reachable on foot, but most trips require transportation.

What is the occupancy rate at Murrieta Gardens?

Murrieta Gardens's occupancy is 32%.

Who is the administrator of Murrieta Gardens?

Brittany Kavenaugh is the administrator of Murrieta Gardens.

How many beds does Murrieta Gardens have?

Murrieta Gardens has 126 beds.

Has Murrieta Gardens had any recent deficiencies or citations?

Murrieta Gardens has had 1 recently reported deficiency.

Guides for Better Senior Living

Care Cost Calculator: See Prices in Your Area

Nursing Home Data Explorer

Don’t Wait Too Long: 7 Red Flag Signs Your Parent Needs Assisted Living Now

The True Cost of Assisted Living in 2025 – And How Families Are Paying For It

Understanding Senior Living Costs: Pricing Models, Discounts & Financial Assistance

Explore Open Rooms
1 Contact details
2 What type of senior care service are you looking for?
3 What budget do you have in mind for senior care?
4 How soon do you need to find care?
5 Additional details

Thank you for your interest!

Our team will be in touch shortly to help with next steps.