Legendary Nursing & Rehabilitation
CMS overall rating Info CMS (the Centers for Medicare & Medicaid Services) is the federal agency that rates nursing home quality. Its Overall Rating runs from 1 to 5 stars, combining health inspections, staffing, and quality measures, with inspections weighted most heavily.

Legendary Nursing & Rehabilitation

CMS overall rating Info CMS (the Centers for Medicare & Medicaid Services) is the federal agency that rates nursing home quality. Its Overall Rating runs from 1 to 5 stars, combining health inspections, staffing, and quality measures, with inspections weighted most heavily.
Calculator: See prices in your area
Legendary Nursing & Rehabilitation accepts Medicare, Medicaid, and private pay.

Overview of Legendary Nursing & Rehabilitation

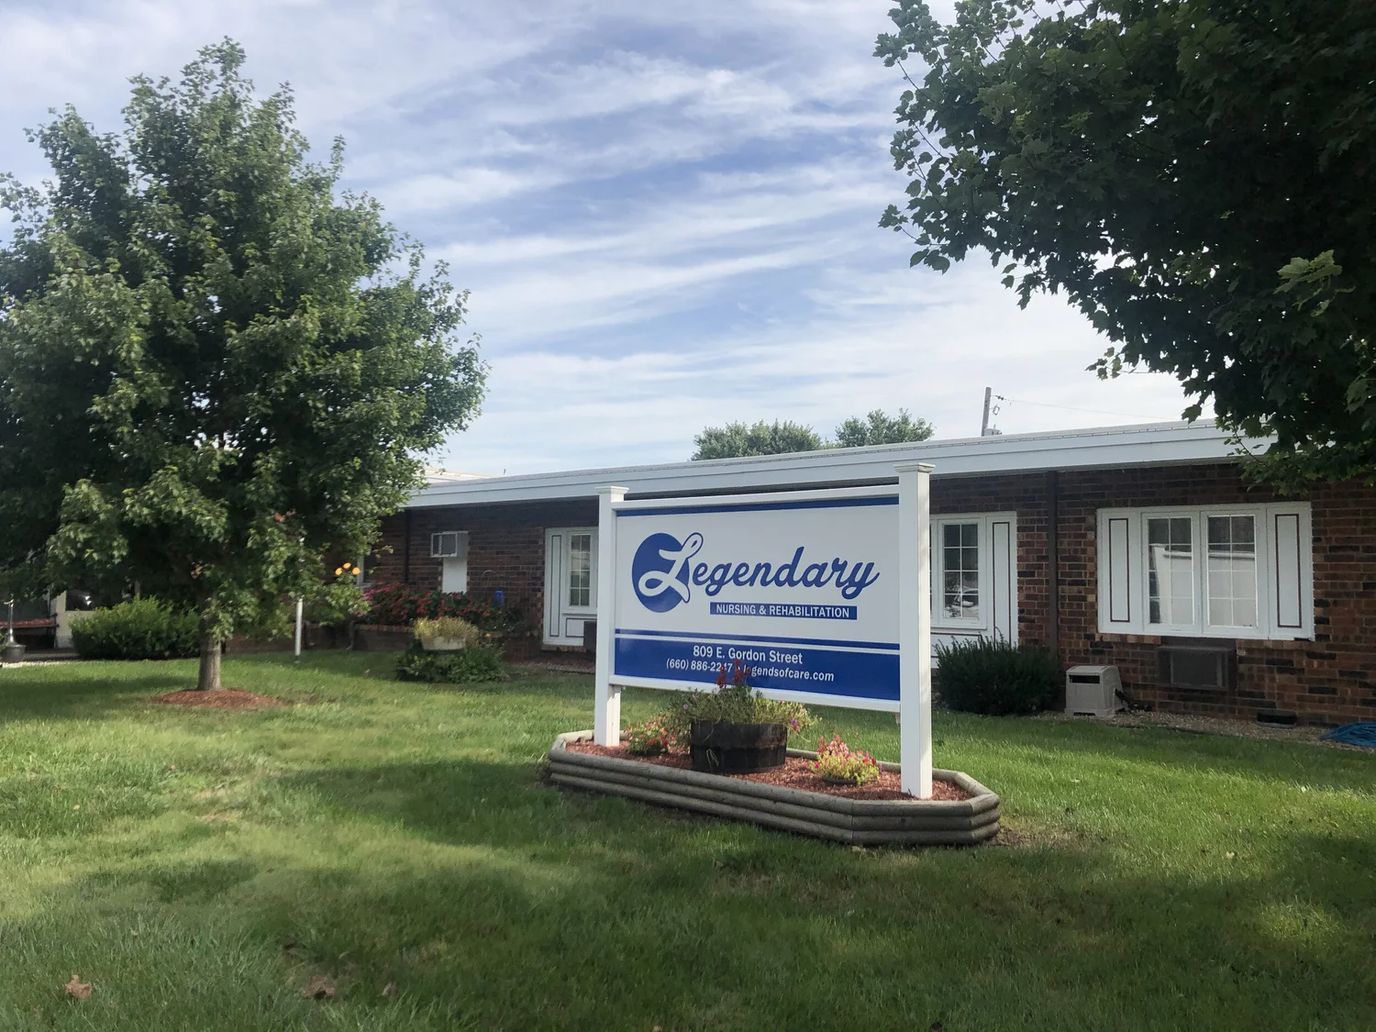
Legendary Nursing & Rehabilitation is a nursing home in Marshall, MO, offering skilled nursing and rehabilitation. With a nurturing and welcoming environment, the community ensures older adults are treated well during their stay. Residents also experience a worry-free lifestyle, with 24-hour care, therapies, and recreational opportunities. The community also strives to help residents live to their potential through an interdisciplinary approach to care.

Light exercises and social events provide residents with more opportunities to explore new interests and gain meaningful experiences. Spacious rooms and lively gathering areas also ensure residents can rest and move around comfortably. Situated in the peaceful residential area of Marshall, the community ensures residents have a laid-back lifestyle. This nursing home is a good option for senior living in Missouri, as it has top-notch services dedicated to older adults’ well-being.

Quality ratings

Measured by Centers for Medicare & Medicaid Services (CMS)

Overall rating Info The Overall CMS Rating combines results from health inspections, staffing levels and quality measures. Health inspections carry the most weight. Staffing and quality scores can increase or decrease the final rating based on performance compared to state and national standards.
▼ 59.7% Below MO avg. ▼ 59.7% Below MO avg.MO average: 2.5Click the badge to see the full State ranking.Click here to see the full State ranking.
Health Inspection Info Based on the results of the facility's three most recent standard inspections and any complaint investigations. CMS reviews the number, scope, and severity of deficiencies, with more recent findings weighted more heavily.
▼ 64.0% Below MO avg. ▼ 64.0% Below MO avg.MO average: 2.8Click the badge to see the full State ranking.Click here to see the full State ranking.
Staffing Info Measures average nursing staff hours per resident per day, including Registered Nurses (RNs) and total nursing staff. Ratings are adjusted based on the level of care residents require and are compared to state and national benchmarks.
▼ 54.3% Below MO avg. ▼ 54.3% Below MO avg.MO average: 2.2Click the badge to see the full State ranking.Click here to see the full State ranking.
Quality Measures Info Based on clinical and physical health indicators reported to CMS, such as hospital readmissions, falls, pressure ulcers, and improvements in mobility. These measures reflect how well residents' health needs are being managed.
▼ 62.4% Below MO avg. ▼ 62.4% Below MO avg.MO average: 2.7Click the badge to see the full State ranking.Click here to see the full State ranking.

Staffing hours breakdown

Info Daily nursing hours per resident by staff type, reported to CMS. Higher is generally better — compare this facility to state and national averages to see where staffing stands.

Hours per resident per day — compared to Missouri state averages

Total nursing care / resident Info This home is ranked 21st out of 282 homes in Missouri for nurse hours. Total adjusted nursing hours per resident per day, combining RN, LPN, and aide time. CMS adjusts this for case-mix so facilities can be fairly compared.
5h 12m per day
Rank #21 / 282Nurse hours — State benchmarkedThis home is ranked 21st out of 282 homes in Missouri. Shows adjusted nurse hours per resident per day benchmarked to the Missouri average, with a ranking across 282 Missouri facilities. More hours mean more direct care. The national average is about 3.5 hrs; below 3.0 is a red flag.Rankings are based only on facilities in Missouri that report data for that category. Facilities without available data are excluded from the ranking.Click the rank badge to see the full State ranking.Click here to see the full State ranking.
This facility Missouri avg (3h 44m per day)
vs Missouri avg
+39%

6 of 6 metrics below state avg

Staff typeHours / Day / Residentvs state avg
Registered Nurse (RN) Info RNs hold the highest nursing license and can assess residents, interpret test results, and direct care plans. More RN hours per day often signals stronger clinical oversight and faster response to health changes. 17m per day ▼ 37% State avg: 28m per day · National avg: 41m per day
LPN / LVN Info Licensed Practical Nurses (LPNs) or Licensed Vocational Nurses (LVNs) deliver routine hands-on care — medication administration, wound dressing, and monitoring vital signs. They work under RN supervision and make up a large share of daily bedside care. 32m per day ▼ 21% State avg: 41m per day · National avg: 52m per day
Nurse Aide Info Certified Nurse Aides (CNAs) provide the most direct day-to-day assistance: bathing, dressing, feeding, and mobility. Nurse aide hours are typically the largest staffing category and directly affect residents' quality of life. 1h 43m per day ▼ 26% State avg: 2h 19m per day · National avg: 2h 20m per day
Weekend Total Nursing Info Combined nursing hours (RN + LPN + Nurse Aide) per resident per day on weekends. Staffing often drops on weekends — this figure reveals whether the facility maintains adequate coverage outside of weekday hours. 2h 10m per day ▼ 29% State avg: 3h 3m per day · National avg: 3h 27m per day
Physical Therapist Info Hours per resident per day provided by licensed Physical Therapists (PTs) or PT Assistants. PT services help residents recover mobility after injury or illness and are especially important for post-acute (short-stay) rehabilitation. 0m per day ▼ 95% State avg: 3m per day · National avg: 4m per day
Weekend RN Info Registered nurse hours specifically on weekends. Facilities sometimes reduce RN presence on Saturdays and Sundays — a low weekend RN figure compared to weekday hours can indicate reduced clinical oversight when most administrative staff are absent. 16m per day ▼ 22% State avg: 20m per day · National avg: 29m per day

Capacity and availability

This home usually has availability

Lower occupancy than the Missouri average: 66.6%
Occupancy rate
38.6% Rank #388 / 434Occupancy rate — State benchmarkedThis home is ranked 388th out of 434 homes in Missouri. Shows this facility's occupancy rate versus the Missouri average, with its Statewide rank out of 434. Higher occupancy signals strong local demand and financial stability.Rankings are based only on facilities in Missouri that report data for that category. Facilities without available data are excluded from the ranking.Click the rank badge to see the full State ranking.Click here to see the full State ranking.
Avg. Length of Stay
84 days
Bed community size
92-bed community Rank #217 / 454Bed count — State benchmarkedThis home is ranked 217th out of 454 homes in Missouri. Shows this facility's certified or reported bed count compared to other Missouri facilities. Larger communities may offer more amenities, programs, and on-site services for residents and families.Rankings are based only on facilities in Missouri that report data for that category. Facilities without available data are excluded from the ranking.Click the rank badge to see the full State ranking.Click here to see the full State ranking.
A larger shared setting that may offer more common spaces and organized community services.
Walk Score
Walk Score: 49 / 100 Rank #254 / 563Walk Score — State benchmarkedThis home is ranked 254th out of 563 homes in Missouri. Shows how walkable this facility's neighborhood is compared to the average Walk Score across Missouri facilities. Higher scores benefit residents, families, and staff.Rankings are based only on facilities in Missouri that report data for that category. Facilities without available data are excluded from the ranking.Click the rank badge to see the full State ranking.Click here to see the full State ranking.
Somewhat walkable. A few nearby services may be reachable on foot, but most trips require transportation.

Contact Legendary Nursing & Rehabilitation

Staffing Data

Reporting period: October 1 – December 31, 2025 (Q4 2025). Source: CMS Payroll-Based Journal report.

Total staff 59
Employees 46
Contractors 13
Staff to resident ratio 1.90 : 1
12% more staff per resident than Missouri average
Missouri average ratio: 1.69 : 1 Missouri average ratio: 1.69 : 1See full Missouri ranking
Avg staff/day 16
Average shift 7.3 hours
10% worse than Missouri average
Missouri average: 8.1 hours Missouri average shift: 8.1 hoursSee full Missouri ranking
Total staff hours (quarter) 10,674

Nursing staff breakdown

Q4 2025 · Oct 1 – Dec 31 More info This data comes from the CMS Payroll-Based Journal report covering October 1 – December 31, 2025.
Registered Nurse

Manages medical care and health needs.

RN Staff Info All 2 RN Staff are full-time employees. No contractors work on this role. 2
Average shift length Info Average shift length. Calculated as total hours divided by days worked and average staff per day. 9.5 hours
Licensed Practical Nurse

Assists with medical care and medications.

LPN Staff Info All 9 LPN Staff are full-time employees. No contractors work on this role. 9
Average shift length Info Average shift length. Calculated as total hours divided by days worked and average staff per day. 8.4 hours
Certified Nursing Assistant

Helps with daily care and mobility.

CNA Staff Info All 19 CNA Staff are full-time employees. No contractors work on this role. 19
Average shift length Info Average shift length. Calculated as total hours divided by days worked and average staff per day. 7.5 hours

Contractor staffing

Q4 2025 · Oct 1 – Dec 31 More info This data comes from the CMS Payroll-Based Journal report covering October 1 – December 31, 2025.

Total hours from contractors

4.9%

521 contractor hours this quarter

Physical Therapy Assistant: 3 Physical Therapy Aide: 2 Speech Language Pathologist: 2 Respiratory Therapy Technician: 2 Occupational Therapy Aide: 1 Medical Director: 1 Occupational Therapy Assistant: 1 Qualified Social Worker: 1

Staff by category

Q4 2025 · Oct 1 – Dec 31 More info This data comes from the CMS Payroll-Based Journal report covering October 1 – December 31, 2025.
Certified Nursing Assistant190194,1097986%7.5
Licensed Practical Nurse9092,0257986%8.4
Medication Aide/Technician5051,4297885%7.8
Nurse Aide in Training6069156267%7.6
Registered Nurse2026296672%9.5
Administrator1014405560%8
Nurse Practitioner1013364246%8
Physical Therapy Aide0222875964%4.4
Clinical Nurse Specialist1011281617%8
Dental Services Staff101791314%6.1
Physical Therapy Assistant033732022%3.2
Mental Health Service Worker1016489%8
Qualified Social Worker011522325%2.3
Speech Language Pathologist022282123%1.3
Medical Director0112433%8
Occupational Therapy Assistant0112433%8
Occupational Therapy Aide0112433%8
Respiratory Therapy Technician022978%1.3
19 Certified Nursing Assistant
% of Days 86%
9 Licensed Practical Nurse
% of Days 86%
5 Medication Aide/Technician
% of Days 85%
6 Nurse Aide in Training
% of Days 67%
2 Registered Nurse
% of Days 72%
1 Administrator
% of Days 60%
1 Nurse Practitioner
% of Days 46%
2 Physical Therapy Aide
% of Days 64%
1 Clinical Nurse Specialist
% of Days 17%
1 Dental Services Staff
% of Days 14%
3 Physical Therapy Assistant
% of Days 22%
1 Mental Health Service Worker
% of Days 9%
1 Qualified Social Worker
% of Days 25%
2 Speech Language Pathologist
% of Days 23%
1 Medical Director
% of Days 3%
1 Occupational Therapy Assistant
% of Days 3%
1 Occupational Therapy Aide
% of Days 3%
2 Respiratory Therapy Technician
% of Days 8%

Penalties and fines

Includes penalties issued in 2023-2025

Federal penalties imposed by CMS for regulatory violations, including civil money penalties (fines) and denials of payment for new Medicare/Medicaid admissions.

Source: CMS Penalties Database (Data as of Jan 2026)

Total fines amount $92K Rank #261 / 289Federal fines — State benchmarkedThis home is ranked 261st out of 289 homes in Missouri. Shows this facility's cumulative CMS federal fine dollars versus the Missouri average among facilities with fines, and where it ranks among 289 facilities in the pool. Lower total dollars mean a better rank.Rankings are based only on facilities in Missouri that report data for that category. Facilities without available data are excluded from the ranking.Click the rank badge to see the full State ranking.Click here to see the full State ranking.
26% higher than Missouri average

Missouri average: $73K

Number of fines 2
18% fewer fines than Missouri average

Missouri average: 2.4

Payment Denials Info Serious action where Medicare and/or Medicaid temporarily stops payments for new residents until issues are fixed. 2
191% more payment denials than Missouri average

Missouri average: 0.7

Fines amount comparison
This facility $92K
Missouri average $73K
Penalty History

Penalties are imposed by CMS for violations of federal nursing home regulations.

4 penalties in the past 3 years

Multiple penalties were reported in the last 3 years.

Civil Money Penalty Info Fines imposed for noncompliance, which can be assessed per day or per instance of violation. May 20, 2025
$54K
Payment Denial Info Serious action where Medicare and/or Medicaid temporarily stops payments for new residents until issues are fixed. May 20, 2025
8 days
Civil Money Penalty Info Fines imposed for noncompliance, which can be assessed per day or per instance of violation. Mar 4, 2025
$38K
Payment Denial Info Serious action where Medicare and/or Medicaid temporarily stops payments for new residents until issues are fixed. Aug 11, 2023
33 days

Last updated: Jan 2026

Quality of care over time

These measures show how residents usually do over time at this home, based on health outcomes and preventive care.

High-risk clinical events score Info A composite score based on pressure ulcers, falls with injury, weight loss, walking ability decline, and activities of daily living decline. 15.6
42% worse than Missouri average

Missouri average: 10.9

Functional decline score Info A composite score based on activities of daily living decline, walking ability decline, and incontinence. 28.7
48% worse than Missouri average

Missouri average: 19.5

Long-stay resident measures
Need for Help with Daily Activities Increased Info Percent of long-stay residents whose need for help with daily activities has increased 36.1%
83% worse than Missouri average

Missouri average: 19.8%

Walking Ability Worsened Info Percent of long-stay residents whose ability to move independently worsened 30.3%
47% worse than Missouri average

Missouri average: 20.6%

Low Risk Residents with Bowel/Bladder Incontinence Info Percent of low risk long-stay residents who lose control of their bowels or bladder 19.8%
9% worse than Missouri average

Missouri average: 18.1%

Falls with Major Injury Info Percent of long-stay residents experiencing one or more falls with major injury 0.8%
81% better than Missouri average

Missouri average: 4.0%

High Risk Residents with Pressure Ulcers Info Percent of long-stay high risk residents with pressure ulcers 4.4%
13% better than Missouri average

Missouri average: 5.0%

Urinary Tract Infection Info Percent of long-stay residents with a urinary tract infection 0.8%
72% better than Missouri average

Missouri average: 2.7%

Lost Too Much Weight Info Percent of long-stay residents who lose too much weight 6.3%
12% worse than Missouri average

Missouri average: 5.6%

Depressive Symptoms Info Percent of long-stay residents who have depressive symptoms 13.6%
6% worse than Missouri average

Missouri average: 12.8%

Antipsychotic Use Info Percent of long-stay residents who received an antipsychotic medication 38.8%
76% worse than Missouri average

Missouri average: 22.0%

Pneumococcal Vaccine Info Percent of long-stay residents assessed and appropriately given the pneumococcal vaccine 95.5%
12% better than Missouri average

Missouri average: 85.2%

Influenza Vaccine Info Percent of long-stay residents assessed and appropriately given the seasonal influenza vaccine 100.0%
10% better than Missouri average

Missouri average: 90.9%

Short-stay resident measures
Pneumococcal Vaccine Info Percent of short-stay residents assessed and appropriately given the pneumococcal vaccine 70.9%
6% better than Missouri average

Missouri average: 66.6%

Antipsychotic medication increase Info Percent of short-stay residents who newly received an antipsychotic medication 0.0%
100% better than Missouri average

Missouri average: 2.2%

Breakdown by payment type

Medicare

22% of new residents, usually for short-term rehab.

Typical stay 24 days

Private pay

23% of new residents, often for short stays.

Typical stay 1 - 2 months

Medicaid

55% of new residents, often for long-term daily care.

Typical stay 4 - 5 months

Facility Characteristics

Source: CMS Long-Term Care Facility Characteristics (Data as of Jan 2026)

Total residents 31
Medicaid
25
80.6% of residents
Private pay or other
6
19.4% of residents
Programs & Services
Residents Group

Residents meet regularly to discuss policies, care quality, and activities

Active Resident Council

Organized group of residents that meets regularly to discuss facility policies, quality of life, and activities.

Finances and operations

Based on CMS SNF Cost Report for fiscal year ending in 12/2023.

For-profit
Operated by a single business entity.
Net patient revenue Info Net patient revenue — what the home actually collects for resident care, after contractual allowances, bad debt and discounts are subtracted from its gross charges (CMS cost report, Worksheet G-3). It covers resident care only; money the home earns from other sources is shown separately as "Other income."
$2.6M
Net patient income Info Net patient income: net patient revenue minus the home's total operating expenses. A positive figure means it earns more from resident care than it spends to deliver it; a negative figure means the opposite. It excludes non-operating "other income."
-$470.2K
For-profit Operated by a single business entity.
Net patient revenue Info Net patient revenue — what the home actually collects for resident care, after contractual allowances, bad debt and discounts are subtracted from its gross charges (CMS cost report, Worksheet G-3). It covers resident care only; money the home earns from other sources is shown separately as "Other income."
$2.6M Rank #278 / 292Revenue — State benchmarkedThis home is ranked 278th out of 292 homes in Missouri. Shows this facility's annual revenue compared to the Missouri average. Higher revenue generally means more resources for staffing and capital — read alongside Payroll %.Rankings are based only on facilities in Missouri that report data for that category. Facilities without available data are excluded from the ranking.Click the rank badge to see the full State ranking.Click here to see the full State ranking.
Net patient income Info Net patient income: net patient revenue minus the home's total operating expenses. A positive figure means it earns more from resident care than it spends to deliver it; a negative figure means the opposite. It excludes non-operating "other income."
-$470.2K
Other income Info Money the home earns outside of resident care — such as investments, grants, rentals and other non-operating sources (CMS cost report, Worksheet G-3). It is tracked separately from net patient revenue: it is not part of that figure, and it is not included in net patient income.
$4.5K
Payroll costs Info Staff salaries plus wage-related costs — benefits such as payroll taxes, health insurance and retirement — from the home's own accounting records (CMS cost report, Worksheet A). Contract or agency labor is counted separately, under other operating costs. Rank #244 / 292Payroll — State benchmarkedThis home is ranked 244th out of 292 homes in Missouri. Shows total annual staff payroll benchmarked to the Missouri average. Higher payroll investment relative to peers often signals better staffing and less reliance on cheaper contract labor.Rankings are based only on facilities in Missouri that report data for that category. Facilities without available data are excluded from the ranking.Click the rank badge to see the full State ranking.Click here to see the full State ranking.
$2.0M 75.7% of net patient revenue Info Payroll as a share of revenue: staff salaries and wage-related benefits divided by net patient revenue. A higher figure means more of each revenue dollar goes to staff pay. Rank #12 / 292Payroll % — State benchmarkedThis home is ranked 12th out of 292 homes in Missouri. Shows payroll as a percentage of revenue versus the Missouri average. Well-run Missouri facilities typically land around 60–71% — the top third Statewide. Below 25% may signal understaffing or heavy agency use — read with Staffing ratings.Rankings are based only on facilities in Missouri that report data for that category. Facilities without available data are excluded from the ranking.Click the rank badge to see the full State ranking.Click here to see the full State ranking.
Other operating costs Info Everything it costs to run the home apart from payroll — food, utilities, supplies, maintenance, contract labor and administration. Calculated as total operating expense minus payroll (staff salaries and wage-related benefits).
$1.1M
Total costs Info The home's total operating expense for the year — all the costs of running it, salaries included (CMS cost report, Worksheet G-3).
$3.1M

What does this home offer?

Housing options icon

Housing Options: Private Rooms

Building type icon
Building type icon

Building Type: Single-story

Rehabilitative support icon

Rehabilitative Support

On-site medical care and health services icon

On-site Medical Care and Health Services

Who this home usually serves

TYPE OF STAY

Mostly long-term care residents

Most residents stay for extended periods and receive ongoing daily care.

Most new residents arrive under Medicaid (55% of admissions), and a typical Medicaid stay runs around 4 - 5 months.

Admissions
153 total

Coverage residents most often arrive under.

Medicare 22%
Private pay 23%
Medicaid 55%
Discharges
154 total

Coverage residents most often leave under.

Medicare 12%
Private pay 22%
Medicaid 66%

Places of interest near Legendary Nursing & Rehabilitation

Address 809 E Gordon St, Marshall, MO 65340

Calculate Travel Distance to Legendary Nursing & Rehabilitation

Add your location

Address

Compare Nursing Homes around Marshall

The information below is reported by the Missouri Department of Health and Senior Services, Division of Regulation and Licensure.

2 facilities compared · CMS & MO Dept. of Health data

The Living Center
NH
MC
RC
Marshall
99
Facility 99
MO AVG 97
Rank #186 / 454
65.3%
Facility 65.3%
MO AVG 66.6%
Rank #233 / 434
-2%
5.00
Facility 5.00
MO AVG 3.74
Rank #32 / 282
-12%+34%
$0
Facility $0
MO AVG $76.9k
Rank #1 / 289
29
Facility 29
MO AVG 36.5
Rank #133 / 287
5.8
Facility 5.8
MO AVG 5.7
Rank #176 / 287
265-
20
Facility 20
MO AVG 45
Rank #451 / 563
Fitzgibbon Health Services
$5.4M
Facility $5.4M
MO AVG $8.4M
Rank #150 / 292
$3.5M
Facility $3.5M
MO AVG $3.3M
Rank #86 / 292
64.7%
Facility 64.7%
MO AVG 45.6%
Rank #15 / 292
265688
Legendary Nursing & Rehabilitation
NH
Marshall
92
Facility 92
MO AVG 97
Rank #217 / 454
38.6%
Facility 38.6%
MO AVG 66.6%
Rank #388 / 434
-42%
5.19
Facility 5.19
MO AVG 3.74
Rank #21 / 282
-56%+39%
$93.2k
Facility $93.2k
MO AVG $76.9k
Rank #261 / 289
40
Facility 40
MO AVG 36.5
Rank #188 / 287
6.7
Facility 6.7
MO AVG 5.7
Rank #213 / 287
241-
49
Facility 49
MO AVG 45
Rank #254 / 563
Michelle Aycock
$2.6M
Facility $2.6M
MO AVG $8.4M
Rank #278 / 292
$2.0M
Facility $2.0M
MO AVG $3.3M
Rank #244 / 292
75.7%
Facility 75.7%
MO AVG 45.6%
Rank #12 / 292
265508

Financial Assistance for
Nursing Home in Missouri

Legendary Nursing & Rehabilitation is located in Marshall, Missouri.
Here are the financial assistance programs available to residents in Missouri.

Get Financial aid guidance

Aged and Disabled Waiver

Missouri Medicaid A&D Waiver

Age 65+ or disabled
General Missouri resident, Medicaid- eligible, nursing home-level care need.
Income Limits (2025) ~$2,829/month 300% FBR, individual
Asset Limits $2,000 (individual), $3,000 (couple).
MO

Rural access prioritized.

Benefits
Personal care (5-7 hours/day) Respite (240 hours/year) Adult day care (~$65/day) Home health services

Missouri Supplemental Nursing Care (SNC)

MO SNC

Age 65+
General Missouri resident, in approved facility.
Income Limits ~$1,215/month individual
Asset Limits $2,000 individual
MO

Supplements SSI; facility-based only.

Benefits
Monthly cash payment (~$156-$292/month) for care costs

Structured Family Caregiving Waiver (SFCW)

Missouri Structured Family Caregiving Waiver

Age 65+
General Missouri resident, MO HealthNet-eligible, NFLOC, dementia diagnosis, live with caregiver.
Income Limits (2025) ~$2,901/month (300% FBR, individual); QIT required.
Asset Limits $5,909.25 (individual), $11,818.45 (couple).
MO

Caregiver must be family; small program size.

Benefits
Cash stipend ($1,000-$1,500/month) to family caregiver Respite Training Supplies ($500/year)

MO HealthNet Aged, Blind, and Disabled (ABD)

Missouri MO HealthNet ABD

Age 65+ or disabled
General Missouri resident, MO HealthNet-eligible, needs help with 1+ ADL.
Income Limits (2025) ~$1,690/month (individual, projected); spenddown allowed.
Asset Limits $5,909.25 (individual), $11,818.45 (couple).
MO

Less intensive than waivers; statewide access.

Benefits
Personal care (2-4 hours/day) Homemaker services Limited respite Medical equipment

Medicare Savings Program (MSP)

Missouri Medicare Savings Program

Age 65+ or disabled
General Missouri resident, Medicare Part A/B.
Income Limits (2025) ~$2,510/month (QMB), ~$3,380/month (SLMB), ~$3,598/month (QI)—individual.
Asset Limits $9,430 (individual), $14,130 (couple).
MO

Three tiers; no waitlist; includes Extra Help for Part D.

Benefits
Covers Part B premiums ($174.70/month) Deductibles ($240/year) Copays (~20%)

Missouri Caregiver Program (Customized Caregiver Training & Relief)

Missouri Caregiver Program

Age
General Caregivers of 60+ with dementia, Missouri resident, functional needs (2+ ADLs).
Income Limits (2025) No strict cap; prioritizes low-income ~$24,980/year individual
Asset Limits Not assessed; need-based.
MO

Administered via AAAs and Alzheimer’s Association; rural focus.

Benefits
Respite (4-6 hours/week) Training Assistive tech ($500/year) Supplies

VA Aid and Attendance (A&A) and Housebound Benefits

Missouri VA Aid and Attendance/Housebound

Age 65+ or disabled veteran/spouse
General Missouri resident, wartime service, need for ADL help (A&A) or homebound.
Income Limits (2025) Net income < ~$1,984/month (veteran with dependent, A&A); pension offsets income.
Asset Limits ~$155,356 net worth limit
MO

High veteran demand in rural/urban areas.

Benefits
Cash (~$1,433-$2,642/month veteran, ~$951-$1,318 spouse) for care costs (e.g., in-home, assisted living)

Frequently Asked Questions about Legendary Nursing & Rehabilitation

Is Legendary Nursing & Rehabilitation in a walkable area?

Legendary Nursing & Rehabilitation has a walk score of 49. Somewhat walkable. A few nearby services may be reachable on foot, but most trips require transportation.

What is the occupancy rate at Legendary Nursing & Rehabilitation?

Legendary Nursing & Rehabilitation's occupancy is 38.6%.

Does Legendary Nursing & Rehabilitation operate as a for-profit or non-profit?

Legendary Nursing & Rehabilitation is registered as a for-profit.

Are there photos of Legendary Nursing & Rehabilitation?

Yes — there is 1 photo of Legendary Nursing & Rehabilitation in the photo gallery on this page.

What is the address of Legendary Nursing & Rehabilitation?

Legendary Nursing & Rehabilitation is located at 809 E Gordon St, Marshall, MO 65340.

What is the phone number of Legendary Nursing & Rehabilitation?

(660) 886-2247 will put you in contact with the team at Legendary Nursing & Rehabilitation.

Is Legendary Nursing & Rehabilitation Medicare or Medicaid certified?

Yes — Legendary Nursing & Rehabilitation is a CMS-certified provider of Medicare and Medicaid.

Guides for Better Senior Living

Care Cost Calculator: See Prices in Your Area

Nursing Home Data Explorer

Don’t Wait Too Long: 7 Red Flag Signs Your Parent Needs Assisted Living Now

The True Cost of Assisted Living in 2025 – And How Families Are Paying For It

Understanding Senior Living Costs: Pricing Models, Discounts & Financial Assistance