


Total staff
110
Employees
91
Contractors
19
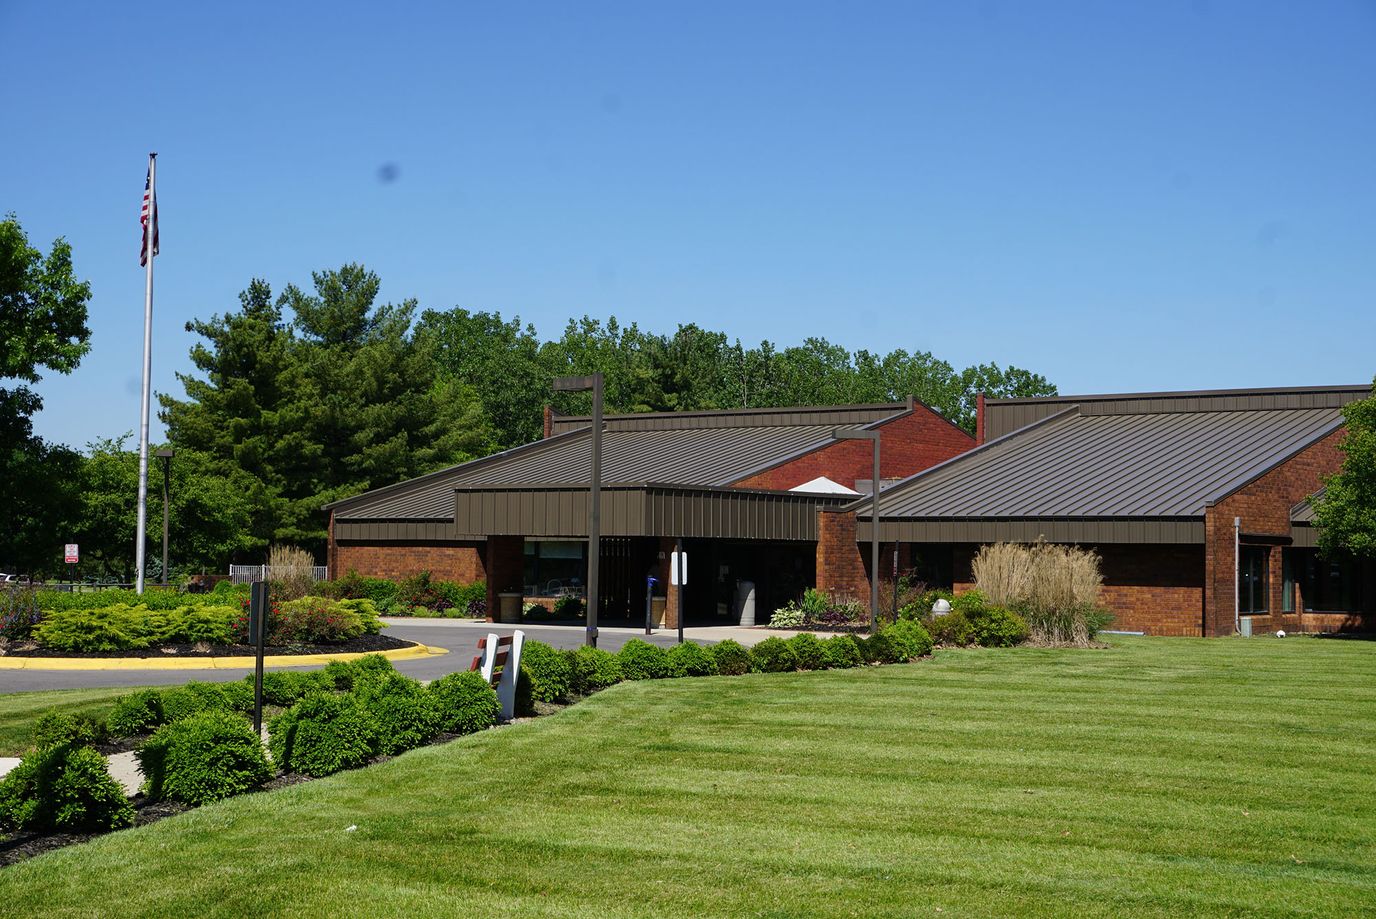
Columbus Colony for Elderly Care is a 99-bed nursing home where residents stay for an average of 249 days. This long stay timeframe shows that the building focuses mostly on long-term residential care rather than quick rehab turnarounds. The neighborhood has a walk score of 46, so while a few local spots might be within walking distance, you will still need a car or transit for most errands around the area.
The daily routine is managed by a nursing team that averages 3 hours and 2 minutes of direct care per resident each day. To break that down, nurse aides cover 1 hour and 58 minutes of that time, registered nurses provide 40 minutes, and practical nurses handle the remaining 29 minutes. This crew splits their shifts to take care of daily personal help, medication schedules, and standard health monitoring.
Individuals exploring local options can get in touch with the admissions office to check on room availability or ask about the move-in process. The front desk can explain how they set up payment through traditional Medicare, state Medicaid, or private funds, and they can walk you through their daily activity schedules.
| Staff type | Hours / Day / Resident | vs state avg |
|---|---|---|
|
Registered Nurse (RN)
| 40m per day | ▲ 6% State avg: 38m per day · National avg: 41m per day |
|
LPN / LVN
| 29m per day | ▼ 49% State avg: 58m per day · National avg: 52m per day |
|
Nurse Aide
| 1h 58m per day | ▼ 8% State avg: 2h 8m per day · National avg: 2h 21m per day |
|
Weekend Total Nursing
| 2h 47m per day | ▼ 15% State avg: 3h 17m per day · National avg: 3h 26m per day |
|
Physical Therapist
| 1m per day | ▼ 72% State avg: 3m per day · National avg: 4m per day |
|
Weekend RN
| 31m per day | ▲ 26% State avg: 25m per day · National avg: 29m per day |
Reporting period: October 1 – December 31, 2025 (Q4 2025). Source: CMS Payroll-Based Journal report.
Manages medical care and health needs.
Assists with medical care and medications.
Helps with daily care and mobility.
Total hours from contractors
1,680 contractor hours this quarter
| Certified Nursing Assistant | 51 | 0 | 51 | 14,812 | 92 | 100% | 11 |
| Registered Nurse | 16 | 0 | 16 | 4,070 | 92 | 100% | 11.7 |
| Licensed Practical Nurse | 9 | 0 | 9 | 2,775 | 90 | 98% | 11.9 |
| RN Director of Nursing | 3 | 0 | 3 | 907 | 62 | 67% | 8.8 |
| Dental Services Staff | 3 | 0 | 3 | 690 | 65 | 71% | 8.6 |
| Speech Language Pathologist | 0 | 3 | 3 | 543 | 66 | 72% | 7.8 |
| Dietitian | 1 | 0 | 1 | 512 | 64 | 70% | 8 |
| Clinical Nurse Specialist | 3 | 0 | 3 | 499 | 54 | 59% | 7.8 |
| Administrator | 1 | 0 | 1 | 488 | 61 | 66% | 8 |
| Nurse Practitioner | 1 | 0 | 1 | 472 | 59 | 64% | 8 |
| Physical Therapy Assistant | 0 | 3 | 3 | 462 | 70 | 76% | 6.5 |
| Other Dietary Services Staff | 1 | 0 | 1 | 391 | 51 | 55% | 7.7 |
| Therapeutic Recreation Specialist | 0 | 1 | 1 | 356 | 65 | 71% | 5.5 |
| Occupational Therapy Aide | 2 | 0 | 2 | 201 | 34 | 37% | 5.7 |
| Qualified Social Worker | 0 | 4 | 4 | 146 | 48 | 52% | 3 |
| Respiratory Therapy Technician | 0 | 5 | 5 | 106 | 44 | 48% | 2.3 |
| Occupational Therapy Assistant | 0 | 1 | 1 | 39 | 6 | 7% | 6.4 |
| Medical Director | 0 | 1 | 1 | 24 | 4 | 4% | 6 |
| Physical Therapy Aide | 0 | 1 | 1 | 6 | 3 | 3% | 1.9 |
Includes penalties issued in 2024
Federal penalties imposed by CMS for regulatory violations, including civil money penalties (fines) and denials of payment for new Medicare/Medicaid admissions.
Source: CMS Penalties Database (Data as of Jan 2026)
Ohio average: $69K
Ohio average: 1.9
Ohio average: 0.5
Penalties are imposed by CMS for violations of federal nursing home regulations.
1 penalty in the past 3 years
Feb 2, 2024 · $170K
Last updated: Jan 2026
These measures show how residents usually do over time at this home, based on health outcomes and preventive care.
Ohio average: 5.8
Ohio average: 12.7
Ohio average: 6.8%
Ohio average: 8.9%
Ohio average: 22.0%
Ohio average: 3.4%
Ohio average: 3.9%
Ohio average: 0.5%
Ohio average: 6.2%
Ohio average: 24.0%
Ohio average: 8.4%
Ohio average: 92.4%
Ohio average: 94.5%
Ohio average: 78.0%
Ohio average: 1.3%
Ohio average: 25.1%
Ohio average: 12.5%
Quality measures are calculated from Minimum Data Set (MDS) assessments. For most measures, lower percentages indicate better care quality.
9% of new residents, usually for short-term rehab.
71% of new residents, often for short stays.
20% of new residents, often for long-term daily care.
Source: CMS Long-Term Care Facility Characteristics (Data as of Jan 2026)
Data sourced from CMS Long-Term Care Facility Characteristics quarterly report. Payer mix reflects the current resident census by primary payment source.
Historical financial and operational data for Columbus Colony For Elderly Care from 2011–2023, based on CMS SNF Cost Reports.
Key figures below are for fiscal year ending in 12/2023.
Based on CMS SNF Cost Report for fiscal year ending in 12/2023.
Most residents stay long-term, while a smaller portion are admitted for short-term rehab.
Most new residents arrive under private pay (71% of admissions), and a typical private pay stay runs around 9 - 10 months.
Coverage residents most often arrive under.
Coverage residents most often leave under.
Columbus Colony For Elderly Care is located in Westerville, Ohio.
Here are the financial assistance programs available to residents in Ohio.
Columbus Colony For Elderly Care has a walk score of 46. Somewhat walkable. A few nearby services may be reachable on foot, but most trips require transportation.
Columbus Colony For Elderly Care's occupancy is 79.9%.
No, Columbus Colony For Elderly Care has a no-pet policy.
Columbus Colony For Elderly Care is registered as a for-profit.
Yes — there is 1 photo of Columbus Colony For Elderly Care in the photo gallery on this page.
(614) 891-5055 will put you in contact with the team at Columbus Colony For Elderly Care.
Yes — Columbus Colony For Elderly Care is a CMS-certified provider of Medicare and Medicaid.
Care Cost Calculator: See Prices in Your Area
Nursing Home Data Explorer
Don’t Wait Too Long: 7 Red Flag Signs Your Parent Needs Assisted Living Now
The True Cost of Assisted Living in 2025 – And How Families Are Paying For It
Understanding Senior Living Costs: Pricing Models, Discounts & Financial Assistance


