

Total staff
264
Employees
231
Contractors
33

We arrange tours, appointments, and even moving support so you don’t have to
Pearl City Nursing Home is a unique and exceptional home in Hawaii that stands out with its own distinct character. This home is the perfect haven for individuals who have recently been discharged from the hospital and need a little extra assistance during their transition. One of the remarkable aspects of this home is the special unit designed specifically for residents requiring ventilator and tracheostomy care. For those facing breathing challenges, Pearl City Nursing Home provides a nurturing environment where maximum recovery with minimal mechanical support is achievable.
In addition to exceptional medical care, Pearl City Nursing Home offers a wide range of nursing home activities for social engagement. These activities not only promote social interaction but also nurture overall health and well-being. Moreover, their culinary delights are nothing short of amazing, as they cater to various dietary requirements. From special dietary needs to personal preferences, every aspect of a resident’s satisfaction and mental state is attentively considered. Discover a place where comfort, safety, and personalized attention converge to create an extraordinary living experience.
| Staff type | Hours / Day / Resident | vs state avg |
|---|---|---|
|
Registered Nurse (RN)
| 2h 11m per day | ▲ 34% State avg: 1h 38m per day · National avg: 41m per day |
|
LPN / LVN
| 33m per day | ▲ 56% State avg: 21m per day · National avg: 52m per day |
|
Nurse Aide
| 3h 30m per day | ▲ 28% State avg: 2h 44m per day · National avg: 2h 21m per day |
|
Weekend Total Nursing
| 5h 33m per day | ▲ 33% State avg: 4h 11m per day · National avg: 3h 26m per day |
|
Physical Therapist
| 8m per day | ▲ 64% State avg: 5m per day · National avg: 4m per day |
|
Weekend RN
| 1h 39m per day | ▲ 34% State avg: 1h 14m per day · National avg: 29m per day |
Reporting period: October 1 – December 31, 2025 (Q4 2025). Source: CMS Payroll-Based Journal report.
Manages medical care and health needs.
Assists with medical care and medications.
Helps with daily care and mobility.
Total hours from contractors
6,308 contractor hours this quarter
| Certified Nursing Assistant | 83 | 4 | 87 | 32,999 | 92 | 100% | 8.4 |
| Registered Nurse | 44 | 4 | 48 | 18,873 | 92 | 100% | 9.7 |
| Qualified Activities Professional | 30 | 2 | 32 | 7,450 | 92 | 100% | 11 |
| Licensed Practical Nurse | 19 | 1 | 20 | 5,736 | 92 | 100% | 9.5 |
| Other Dietary Services Staff | 11 | 0 | 11 | 3,979 | 92 | 100% | 7.9 |
| Nurse Aide in Training | 19 | 0 | 19 | 3,667 | 90 | 98% | 8.4 |
| Clinical Nurse Specialist | 16 | 0 | 16 | 3,644 | 91 | 99% | 8.1 |
| Respiratory Therapy Technician | 0 | 5 | 5 | 1,437 | 81 | 88% | 7.7 |
| Physical Therapy Aide | 0 | 6 | 6 | 1,201 | 72 | 78% | 6.6 |
| Dental Services Staff | 2 | 0 | 2 | 966 | 65 | 71% | 7.8 |
| Speech Language Pathologist | 0 | 4 | 4 | 950 | 70 | 76% | 7.5 |
| Administrator | 2 | 0 | 2 | 776 | 64 | 70% | 8 |
| Physical Therapy Assistant | 0 | 3 | 3 | 687 | 70 | 76% | 8.8 |
| Occupational Therapy Aide | 2 | 0 | 2 | 647 | 62 | 67% | 5.4 |
| Dietitian | 1 | 0 | 1 | 496 | 62 | 67% | 8 |
| Nurse Practitioner | 1 | 0 | 1 | 472 | 59 | 64% | 8 |
| Qualified Social Worker | 0 | 2 | 2 | 465 | 72 | 78% | 6.3 |
| Mental Health Service Worker | 1 | 0 | 1 | 445 | 56 | 61% | 7.9 |
| Occupational Therapy Assistant | 0 | 1 | 1 | 41 | 7 | 8% | 5.8 |
| Medical Director | 0 | 1 | 1 | 25 | 7 | 8% | 3.6 |
Federal penalties imposed by CMS for regulatory violations, including civil money penalties (fines) and denials of payment for new Medicare/Medicaid admissions.
Source: CMS Penalties Database
No penalties in the past 3 years
No civil money penalties or payment denials were reported in the last 3 years.
These measures show how residents usually do over time at this home, based on health outcomes and preventive care.
Hawaii average: 10.2
Hawaii average: 20.0
Hawaii average: 17.6%
Hawaii average: 25.8%
Hawaii average: 18.3%
Hawaii average: 2.1%
Hawaii average: 3.6%
Hawaii average: 2.4%
Hawaii average: 4.7%
Hawaii average: 1.5%
Hawaii average: 10.1%
Hawaii average: 96.3%
Hawaii average: 95.4%
Hawaii average: 83.4%
Hawaii average: 1.2%
Hawaii average: 84.7%
Hawaii average: 19.6%
Hawaii average: 10.9%
Hawaii average: 0.8%
Hawaii average: 53.7%
Hawaii average: 50.6%
Quality measures are calculated from Minimum Data Set (MDS) assessments. For most measures, lower percentages indicate better care quality.
38% of new residents, usually for short-term rehab.
56% of new residents, often for short stays.
6% of new residents, often for long-term daily care.
Source: CMS Long-Term Care Facility Characteristics (Data as of Jan 2026)
Residents meet regularly to discuss policies, care quality, and activities
Organized group of residents that meets regularly to discuss facility policies, quality of life, and activities.
Data sourced from CMS Long-Term Care Facility Characteristics quarterly report. Payer mix reflects the current resident census by primary payment source.
Historical financial and operational data for Pearl City Nursing Home based on CMS SNF Cost Reports.
Housing Options: Private / Shared Rooms

On-site Medical Care and Health Services
This home supports both short-term rehab and long-term care, with residents staying for a wide range of durations.
![]() 2.6 miles from city center
2.6 miles from city center
![]() Estimated distance in miles from Pearl City's city center to Pearl City Nursing Home's address, calculated via Google Maps.
— 2.22 miles to nearest hospital (Pali Momi Medical Center)
Estimated distance in miles from Pearl City's city center to Pearl City Nursing Home's address, calculated via Google Maps.
— 2.22 miles to nearest hospital (Pali Momi Medical Center)
Add your location
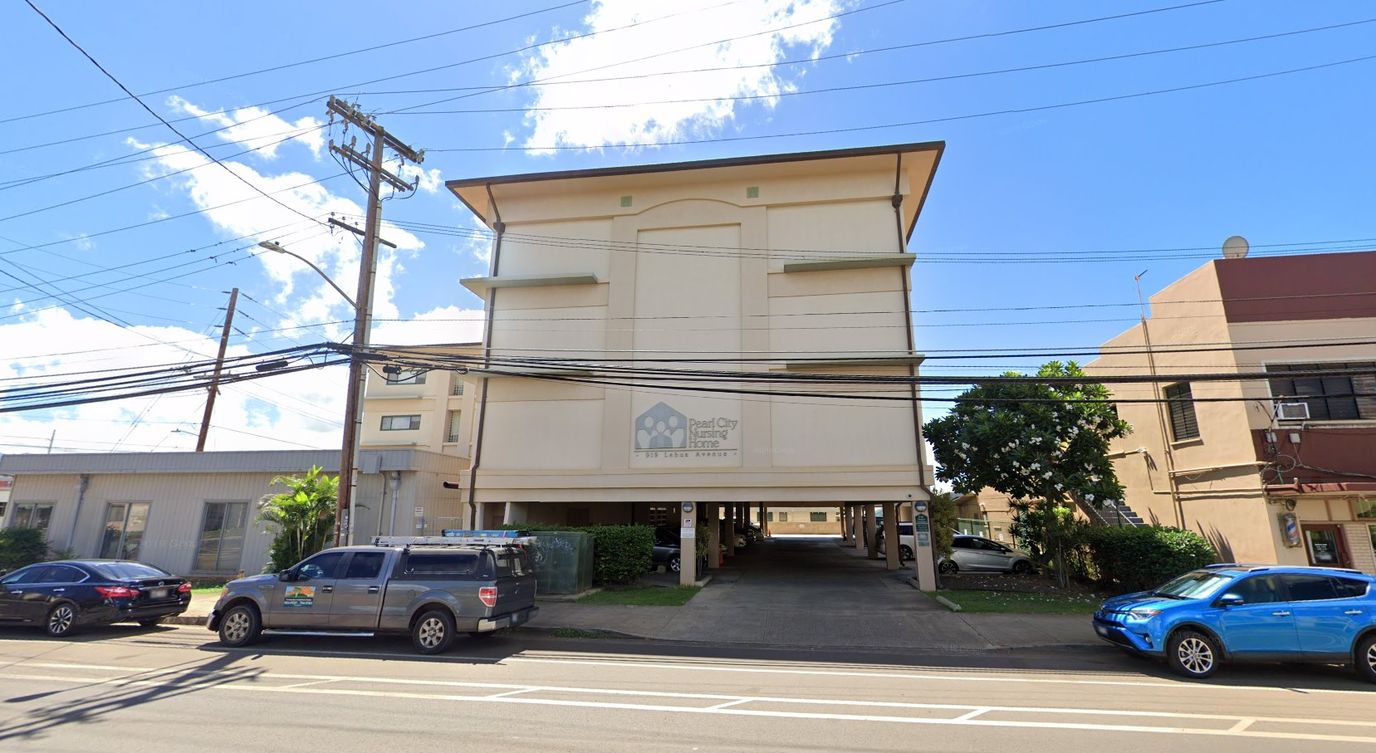
Pearl City Nursing Home is located in Pearl City, Hawaii.
Here are the financial assistance programs available to residents in Hawaii.
Pearl City Nursing Home is in the Lehua Avenue neighborhood.
Pearl City Nursing Home has a walk score of 73. Very walkable. Most errands can be accomplished on foot, and many essentials are within a short walk.
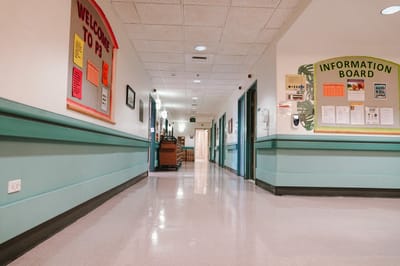
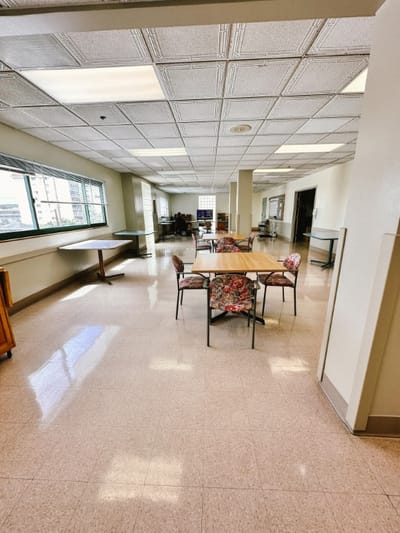
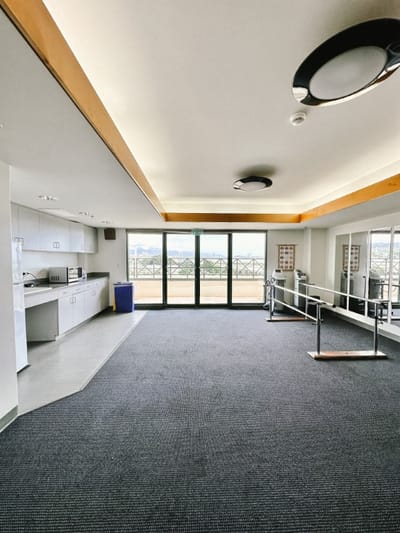
Yes — there are 4 photos of Pearl City Nursing Home in the photo gallery on this page.
Pearl City Nursing Home is located at 919 Lehua Ave, Pearl City, HI 96782, United States.
(808) 687-3200 will put you in contact with the team at Pearl City Nursing Home.
Yes — Pearl City Nursing Home is a CMS-certified provider of Medicare and Medicaid.
Care Cost Calculator: See Prices in Your Area
Nursing Home Data Explorer
Don’t Wait Too Long: 7 Red Flag Signs Your Parent Needs Assisted Living Now
The True Cost of Assisted Living in 2025 – And How Families Are Paying For It
Understanding Senior Living Costs: Pricing Models, Discounts & Financial Assistance


Thank you for your interest!
Our team will be in touch shortly to help with next steps.
