The Blossoms at Fort Smith Rehab & Nursing Center
Nursing Home, Memory Care, Palliative Care, Respite Care & Skilled Nursing · Fort Smith, AR
CMS overall rating Info CMS (the Centers for Medicare & Medicaid Services) is the federal agency that rates nursing home quality. Its Overall Rating runs from 1 to 5 stars, combining health inspections, staffing, and quality measures, with inspections weighted most heavily.

The Blossoms at Fort Smith Rehab & Nursing Center

Nursing Home, Memory Care, Palliative Care, Respite Care & Skilled Nursing · Fort Smith, AR
CMS overall rating Info CMS (the Centers for Medicare & Medicaid Services) is the federal agency that rates nursing home quality. Its Overall Rating runs from 1 to 5 stars, combining health inspections, staffing, and quality measures, with inspections weighted most heavily.
Calculator: See prices in your area
The Blossoms at Fort Smith Rehab & Nursing Center accepts Medicare, Medicaid, and private pay.

Overview of The Blossoms at Fort Smith Rehab & Nursing Center

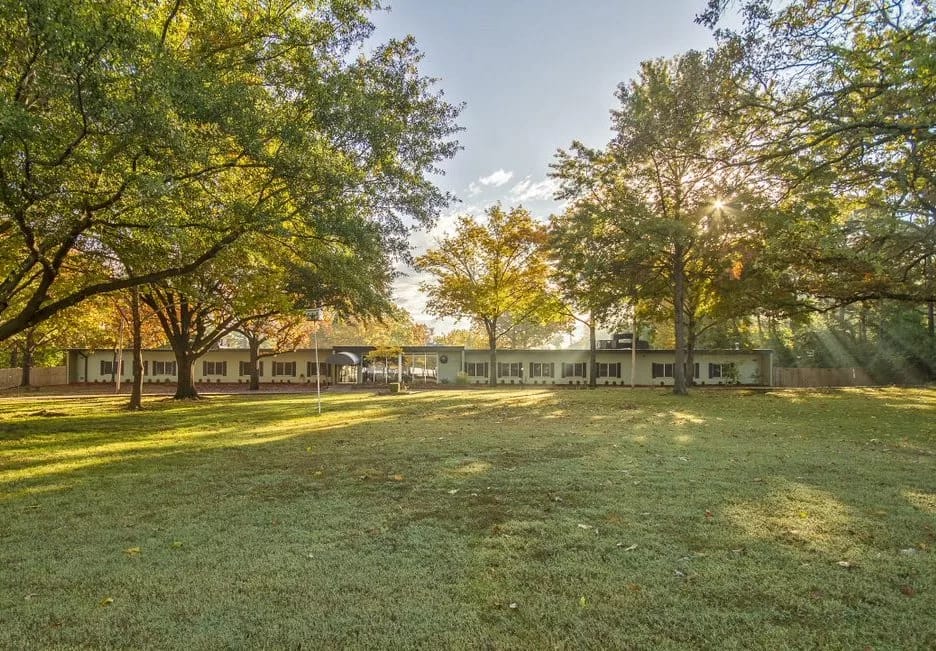
The Blossoms at Fort Smith Rehab & Nursing Center, nestled in the vibrant city of Fort Smith, is a place that truly stands out. With their unwavering commitment to excellence in nursing home care, this haven creates a nurturing environment where residents’ well-being is always the top priority. The dedicated staff takes a patient-centered approach, ensuring that each individual receives the personalized attention they deserve. The result is a premier community that sets the standard for exceptional care.
At The Blossoms, residents have a plethora of opportunities to engage in recreational activities that bring joy and entertainment to their days. From delightful movie nights to thrilling bingo evenings and captivating musical performances, there’s always something exciting happening. And let’s not forget about the exquisite gourmet-style meals that are served daily, prepared with care and expertise. With a registered dietitian overseeing the culinary offerings, residents can savor delicious and nutritious dishes that cater to their individual needs. For those looking to stay active and fit, a spacious gym equipped with state-of-the-art equipment awaits. The Blossoms truly leaves no stone unturned when it comes to providing a comprehensive and enriching living experience.

Quality ratings

Measured by Centers for Medicare & Medicaid Services (CMS)

Overall rating Info The Overall CMS Rating combines results from health inspections, staffing levels and quality measures. Health inspections carry the most weight. Staffing and quality scores can increase or decrease the final rating based on performance compared to state and national standards.
▼ 36.3% Below AR avg. ▼ 36.3% Below AR avg.AR average: 3.1Click the badge to see the full State ranking.Click here to see the full State ranking.
Health Inspection Info Based on the results of the facility's three most recent standard inspections and any complaint investigations. CMS reviews the number, scope, and severity of deficiencies, with more recent findings weighted more heavily.
▼ 30.8% Below AR avg. ▼ 30.8% Below AR avg.AR average: 2.9Click the badge to see the full State ranking.Click here to see the full State ranking.
Staffing Info Measures average nursing staff hours per resident per day, including Registered Nurses (RNs) and total nursing staff. Ratings are adjusted based on the level of care residents require and are compared to state and national benchmarks.
▼ 37.2% Below AR avg. ▼ 37.2% Below AR avg.AR average: 3.2Click the badge to see the full State ranking.Click here to see the full State ranking.
Quality Measures Info Based on clinical and physical health indicators reported to CMS, such as hospital readmissions, falls, pressure ulcers, and improvements in mobility. These measures reflect how well residents' health needs are being managed.
▲ 9.3% Above AR avg. ▲ 9.3% Above AR avg.AR average: 3.7Click the badge to see the full State ranking.Click here to see the full State ranking.

Staffing hours breakdown

Info Daily nursing hours per resident by staff type, reported to CMS. Higher is generally better — compare this facility to state and national averages to see where staffing stands.

Hours per resident per day — compared to Arkansas state averages

Total nursing care / resident Info Total adjusted nursing hours per resident per day, combining RN, LPN, and aide time. CMS adjusts this for case-mix so facilities can be fairly compared.
3h 53m per day
This facility Arkansas avg (4h 40m per day)
vs Arkansas avg
-17%

5 of 6 metrics below state avg

Standout metric Physical Therapist is +15% above state avg
Staff typeHours / Day / Residentvs state avg
Registered Nurse (RN) Info RNs hold the highest nursing license and can assess residents, interpret test results, and direct care plans. More RN hours per day often signals stronger clinical oversight and faster response to health changes. 12m per day ▼ 49% State avg: 24m per day · National avg: 41m per day
LPN / LVN Info Licensed Practical Nurses (LPNs) or Licensed Vocational Nurses (LVNs) deliver routine hands-on care — medication administration, wound dressing, and monitoring vital signs. They work under RN supervision and make up a large share of daily bedside care. 44m per day ▼ 23% State avg: 57m per day · National avg: 52m per day
Nurse Aide Info Certified Nurse Aides (CNAs) provide the most direct day-to-day assistance: bathing, dressing, feeding, and mobility. Nurse aide hours are typically the largest staffing category and directly affect residents' quality of life. 2h 16m per day ▼ 17% State avg: 2h 44m per day · National avg: 2h 21m per day
Weekend Total Nursing Info Combined nursing hours (RN + LPN + Nurse Aide) per resident per day on weekends. Staffing often drops on weekends — this figure reveals whether the facility maintains adequate coverage outside of weekday hours. 2h 49m per day ▼ 19% State avg: 3h 29m per day · National avg: 3h 26m per day
Physical Therapist Info Hours per resident per day provided by licensed Physical Therapists (PTs) or PT Assistants. PT services help residents recover mobility after injury or illness and are especially important for post-acute (short-stay) rehabilitation. 2m per day ▲ 15% State avg: 2m per day · National avg: 4m per day
Weekend RN Info Registered nurse hours specifically on weekends. Facilities sometimes reduce RN presence on Saturdays and Sundays — a low weekend RN figure compared to weekday hours can indicate reduced clinical oversight when most administrative staff are absent. 14m per day ▼ 12% State avg: 16m per day · National avg: 29m per day

Capacity and availability

Avg. Length of Stay Info Average number of days residents stay at this facility, based on CMS cost report data. Shorter stays often reflect post-acute or rehab care; longer stays reflect long-term care.
244 days
Bed community size
130-bed community Rank #47 / 330Bed count — State benchmarkedThis home is ranked 47th out of 330 homes in Arkansas. Shows this facility's certified or reported bed count compared to other Arkansas facilities. Larger communities may offer more amenities, programs, and on-site services for residents and families.Rankings are based only on facilities in Arkansas that report data for that category. Facilities without available data are excluded from the ranking.Click the rank badge to see the full State ranking.Click here to see the full State ranking.
A larger shared setting that may offer more common spaces and organized community services.
Walk Score
Walk Score: 34 / 100 Rank #203 / 419Walk Score — State benchmarkedThis home is ranked 203rd out of 419 homes in Arkansas. Shows how walkable this facility's neighborhood is compared to the average Walk Score across Arkansas facilities. Higher scores benefit residents, families, and staff.Rankings are based only on facilities in Arkansas that report data for that category. Facilities without available data are excluded from the ranking.Click the rank badge to see the full State ranking.Click here to see the full State ranking.
Somewhat walkable. A few nearby services may be reachable on foot, but most trips require transportation.

About this community

Occupancy

Occupancy rate
82%
Higher than the Arkansas average: 71.3%
Occupied beds
107 / 130
Average occupied beds in Arkansas homes 77 beds

License Details

Facility TypeSkilled Nursing Facility With Dual Certified Beds (medicaid/medicare)
CountySebastian
Business TypeLimited Liability Company
Certification TypeMedicaid / Medicare

Ownership & Operating Entity

The Blossoms at Fort Smith Rehab & Nursing Center is legally operated by Wheeler Avenue Operating LLC, and administered by Sanford Yarbrough.

Type Of Units

Medicaid and Medicare
130 units
Total beds
130 units

Contact Information

Fax479-434-4081

Contact The Blossoms at Fort Smith Rehab & Nursing Center

Inspection History

In Arkansas, the Department of Human Services, Office of Long Term Care is authorized to conduct unannounced inspections and issue official quality of care reports for all senior living providers.

Since 2023 · 3 years of data 66 deficiencies

Inspection Scorecard Info This scorecard compares key inspection, deficiency, and complaint metrics at this facility against the Arkansas state average. Metrics rated ≥15% worse than average are highlighted in red; those ≥15% better are highlighted in green.

Since 2023 vs. Arkansas state average
Overall vs. AR average 2 Worse Metrics worse than Arkansas average:
• Total deficiencies (214% above)
• Deficiencies per year (214% above)
0 Better No metrics in this bucket.
Latest Inspection September 19, 2025 Routine

Deficiencies Info Deficiencies are formal regulatory issues recorded during state inspections.

This FacilityAR Averagevs. AR Avg
Total deficiencies Info Formal regulatory issues recorded by inspectors across all inspection types. 6621 This facility has 214% more total deficiencies than a typical Arkansas nursing home (66 vs. AR avg 21).↑ 214% worse
Deficiencies per year Info Average deficiencies per year since 2023. 227 This facility has 214% more deficiencies per year than a typical Arkansas nursing home (22 vs. AR avg 7).↑ 214% worse

Inspection Reports Summary Info An editor-reviewed summary of the themes and findings across this facility's recent inspection reports.

  • September 19, 2025 inspection found 5 deficiencies including medication errors, allowing inappropriate resident self-administration, failure to implement physician orders, and poor infection control during wound care.
  • March 18, 2025 complaint investigation substantiated failure to timely report verbal abuse allegations involving two residents, with staff disciplinary actions documented.
  • April 16, 2025 annual inspection found 2 deficiencies for failing to obtain PASARR II evaluation and not employing a certified social worker in a facility over 120 beds.

Health Inspection History

Inspections since 2021
Total health inspections 10

Arkansas average 4.2


Last Health inspection on Apr 2025

Total health citations
37

Arkansas average 21.8

Citations per inspection
3.7

Arkansas average 5.32


Health citations are formal notices following inspections when they fail to comply with safety and care standards.

20 of 37 citations resulted from standard inspections; and 17 of 37 resulted from complaint investigations.

Breakdown of citation severity (last 5 years)
Critical health citations
0
100% better than Arkansas average

Arkansas average: 0.4


Serious health citations
1
400% worse than Arkansas average

Arkansas average: 0.2

0 critical citations Arkansas average: 0.4

1 serious citation Arkansas average: 0.2

35 moderate citations Arkansas average: 20.9

1 minor citation Arkansas average: 0.4
Citations history (last 5 years)
Administration moderate citation Apr 16, 2025
Corrected

Care Planning moderate citation Apr 16, 2025
Corrected

Abuse/Neglect moderate citation Mar 18, 2025
Corrected

Quality of Care moderate citation Jan 08, 2025
Corrected

Staffing Data

Reporting period: October 1 – December 31, 2025 (Q4 2025). Source: CMS Payroll-Based Journal report.

Total staff 134
Employees 109
Contractors 25
Staff to resident ratio 1.22 : 1
23% fewer staff per resident than Arkansas average
Arkansas average ratio: 1.59 : 1 Arkansas average ratio: 1.59 : 1See full Arkansas ranking
Avg staff/day 53
Average shift 8.1 hours
0% compared with Arkansas average
Arkansas average: 8 hours Arkansas average shift: 8 hoursSee full Arkansas ranking
Total staff hours (quarter) 39,693

Nursing staff breakdown

Q4 2025 · Oct 1 – Dec 31 More info This data comes from the CMS Payroll-Based Journal report covering October 1 – December 31, 2025.
Registered Nurse

Manages medical care and health needs.

RN Staff Info All 6 RN Staff are full-time employees. No contractors work on this role. 6
Average shift length Info Average shift length. Calculated as total hours divided by days worked and average staff per day. 9.3 hours
Licensed Practical Nurse

Assists with medical care and medications.

LPN Staff Info 20 total: 19 full-time employees and 1 contractor. 20
Average shift length Info Average shift length. Calculated as total hours divided by days worked and average staff per day. 9.1 hours
Certified Nursing Assistant

Helps with daily care and mobility.

CNA Staff Info All 69 CNA Staff are full-time employees. No contractors work on this role. 69
Average shift length Info Average shift length. Calculated as total hours divided by days worked and average staff per day. 8.1 hours

Contractor staffing

Q4 2025 · Oct 1 – Dec 31 More info This data comes from the CMS Payroll-Based Journal report covering October 1 – December 31, 2025.

Total hours from contractors

10.6%

4,199 contractor hours this quarter

Speech Language Pathologist: 4 Physical Therapy Aide: 4 Clinical Nurse Specialist: 3 Occupational Therapy Aide: 2 Qualified Social Worker: 2 Dental Services Staff: 2 Physician Assistant: 2 Medical Director: 2 Respiratory Therapy Technician: 1 Physical Therapy Assistant: 1 Licensed Practical Nurse: 1 Occupational Therapy Assistant: 1

Staff by category

Q4 2025 · Oct 1 – Dec 31 More info This data comes from the CMS Payroll-Based Journal report covering October 1 – December 31, 2025.
Certified Nursing Assistant6906923,26892100%8.1
Licensed Practical Nurse191206,00192100%9.1
RN Director of Nursing5051,8968491%7.4
Registered Nurse6061,1697076%9.3
Speech Language Pathologist0441,0306773%7.9
Nurse Aide in Training4049117582%9.7
Physical Therapy Aide0448426672%7.7
Qualified Social Worker0227086975%7.8
Physician Assistant0225506267%8.2
Clinical Nurse Specialist1345436368%8.2
Dental Services Staff1235195863%7.6
Nurse Practitioner2024935964%8.2
Administrator1014806166%7.9
Respiratory Therapy Technician0114156672%6.3
Medication Aide/Technician1013164650%6.9
Physical Therapy Assistant0112974953%6.1
Occupational Therapy Aide0221574043%3.9
Medical Director022522022%2.6
Occupational Therapy Assistant0115033%16.6
69 Certified Nursing Assistant
% of Days 100%
20 Licensed Practical Nurse
% of Days 100%
5 RN Director of Nursing
% of Days 91%
6 Registered Nurse
% of Days 76%
4 Speech Language Pathologist
% of Days 73%
4 Nurse Aide in Training
% of Days 82%
4 Physical Therapy Aide
% of Days 72%
2 Qualified Social Worker
% of Days 75%
2 Physician Assistant
% of Days 67%
4 Clinical Nurse Specialist
% of Days 68%
3 Dental Services Staff
% of Days 63%
2 Nurse Practitioner
% of Days 64%
1 Administrator
% of Days 66%
1 Respiratory Therapy Technician
% of Days 72%
1 Medication Aide/Technician
% of Days 50%
1 Physical Therapy Assistant
% of Days 53%
2 Occupational Therapy Aide
% of Days 43%
2 Medical Director
% of Days 22%
1 Occupational Therapy Assistant
% of Days 3%

Penalties and fines

Federal penalties imposed by CMS for regulatory violations, including civil money penalties (fines) and denials of payment for new Medicare/Medicaid admissions.

Source: CMS Penalties Database

No penalties in the past 3 years

No civil money penalties or payment denials were reported in the last 3 years.

Quality of care over time

These measures show how residents usually do over time at this home, based on health outcomes and preventive care.

High-risk clinical events score Info A composite score based on pressure ulcers, falls with injury, weight loss, walking ability decline, and activities of daily living decline. 7.3
In line with Arkansas average

Arkansas average: 7.7

Functional decline score Info A composite score based on activities of daily living decline, walking ability decline, and incontinence. 15.7
17% worse than Arkansas average

Arkansas average: 13.3

Long-stay resident measures
Above average Arkansas avg: 4.2 Info CMS star rating based on long-stay quality measure performance. 5 stars = significantly above average, 1 star = significantly below average.
Need for Help with Daily Activities Increased Info Percent of long-stay residents whose need for help with daily activities has increased 12.7%
10% worse than Arkansas average

Arkansas average: 11.5%

Walking Ability Worsened Info Percent of long-stay residents whose ability to move independently worsened 12.6%
6% better than Arkansas average

Arkansas average: 13.4%

Low Risk Residents with Bowel/Bladder Incontinence Info Percent of low risk long-stay residents who lose control of their bowels or bladder 21.7%
43% worse than Arkansas average

Arkansas average: 15.1%

Falls with Major Injury Info Percent of long-stay residents experiencing one or more falls with major injury 2.9%
27% better than Arkansas average

Arkansas average: 3.9%

High Risk Residents with Pressure Ulcers Info Percent of long-stay high risk residents with pressure ulcers 4.4%
8% better than Arkansas average

Arkansas average: 4.7%

Urinary Tract Infection Info Percent of long-stay residents with a urinary tract infection 0.3%
81% better than Arkansas average

Arkansas average: 1.3%

Lost Too Much Weight Info Percent of long-stay residents who lose too much weight 4.1%
19% better than Arkansas average

Arkansas average: 5.0%

Depressive Symptoms Info Percent of long-stay residents who have depressive symptoms 1.9%
20% worse than Arkansas average

Arkansas average: 1.5%

Antipsychotic Use Info Percent of long-stay residents who received an antipsychotic medication 26.2%
150% worse than Arkansas average

Arkansas average: 10.5%

Pneumococcal Vaccine Info Percent of long-stay residents assessed and appropriately given the pneumococcal vaccine 99.8%
6% better than Arkansas average

Arkansas average: 94.4%

Influenza Vaccine Info Percent of long-stay residents assessed and appropriately given the seasonal influenza vaccine 100.0%
In line with Arkansas average

Arkansas average: 96.2%

Hospitalizations per 1,000 days Info Number of hospitalizations per 1,000 long-stay resident days. 1.75
11% better than Arkansas average

Arkansas average: 1.97

ED visits per 1,000 days Info Number of outpatient emergency department visits per 1,000 long-stay resident days. 1.71
22% better than Arkansas average

Arkansas average: 2.18

Short-stay resident measures
Significantly above average Arkansas avg: 2.7 Info CMS star rating based on short-stay quality measure performance. 5 stars = much above average, 1 star = much below average.
Pneumococcal Vaccine Info Percent of short-stay residents assessed and appropriately given the pneumococcal vaccine 92.0%
14% better than Arkansas average

Arkansas average: 80.9%

Antipsychotic medication increase Info Percent of short-stay residents who newly received an antipsychotic medication 0.0%
100% better than Arkansas average

Arkansas average: 1.5%

Influenza Vaccine Info Percent of short-stay residents assessed and appropriately given the seasonal influenza vaccine 92.9%
20% better than Arkansas average

Arkansas average: 77.7%

Re-hospitalized after SNF stay Info Percentage of short-stay residents who were re-hospitalized after their nursing home admission. 18.1%
28% better than Arkansas average

Arkansas average: 25.2%

Emergency department visits Info Percentage of short-stay residents who had an outpatient emergency department visit. 8.4%
39% better than Arkansas average

Arkansas average: 13.8%

Falls with major injury Info Percentage of SNF residents who experience falls with major injury during their stay. 0.0%
100% better than Arkansas average

Arkansas average: 0.8%

Ability to care for self at discharge Info Percentage of residents at or above expected ability to care for themselves at discharge. 69.6%
30% better than Arkansas average

Arkansas average: 53.7%

Breakdown by payment type

Medicare

20% of new residents, usually for short-term rehab.

Typical stay 1 - 2 months

Private pay

37% of new residents, often for short stays.

Typical stay 2 - 3 months

Medicaid

43% of new residents, often for long-term daily care.

Typical stay 1 years

Facility Characteristics

Source: CMS Long-Term Care Facility Characteristics (Data as of Jan 2026)

Total residents 110
Medicare
5
4.5% of residents
Medicaid
95
86.4% of residents
Private pay or other
10
9.1% of residents
Programs & Services
Residents Group

Residents meet regularly to discuss policies, care quality, and activities

Nurse Aide Training

State-approved Nurse Aide Training and Competency Evaluation Program on-site

Active Resident Council

Organized group of residents that meets regularly to discuss facility policies, quality of life, and activities.

Finances and operations

Based on CMS SNF Cost Report for fiscal year ending in 06/2024.

For-profit
Operated by a business corporation.
Net patient revenue Info Net patient revenue — what the home actually collects for resident care, after contractual allowances, bad debt and discounts are subtracted from its gross charges (CMS cost report, Worksheet G-3). It covers resident care only; money the home earns from other sources is shown separately as "Other income."
$11.7M
Net patient income Info Net patient income: net patient revenue minus the home's total operating expenses. A positive figure means it earns more from resident care than it spends to deliver it; a negative figure means the opposite. It excludes non-operating "other income."
$987.7K
For-profit Operated by a business corporation.
Net patient revenue Info Net patient revenue — what the home actually collects for resident care, after contractual allowances, bad debt and discounts are subtracted from its gross charges (CMS cost report, Worksheet G-3). It covers resident care only; money the home earns from other sources is shown separately as "Other income."
$11.7M
Net patient income Info Net patient income: net patient revenue minus the home's total operating expenses. A positive figure means it earns more from resident care than it spends to deliver it; a negative figure means the opposite. It excludes non-operating "other income."
$987.7K
Other income Info Money the home earns outside of resident care — such as investments, grants, rentals and other non-operating sources (CMS cost report, Worksheet G-3). It is tracked separately from net patient revenue: it is not part of that figure, and it is not included in net patient income.
$874
Payroll costs Info Staff salaries plus wage-related costs — benefits such as payroll taxes, health insurance and retirement — from the home's own accounting records (CMS cost report, Worksheet A). Contract or agency labor is counted separately, under other operating costs.
$4.5M 38.9% of net patient revenue Info Payroll as a share of revenue: staff salaries and wage-related benefits divided by net patient revenue. A higher figure means more of each revenue dollar goes to staff pay.
Other operating costs Info Everything it costs to run the home apart from payroll — food, utilities, supplies, maintenance, contract labor and administration. Calculated as total operating expense minus payroll (staff salaries and wage-related benefits).
$6.2M
Total costs Info The home's total operating expense for the year — all the costs of running it, salaries included (CMS cost report, Worksheet G-3).
$10.7M

Who this home usually serves

TYPE OF STAY

Mostly long-term care residents

Most residents stay for extended periods and receive ongoing daily care.

New residents most often arrive under Medicaid (43% of admissions), and a typical Medicaid stay runs around 1 years.

Admissions
185 total

Coverage residents most often arrive under.

Medicare 20%
Private pay 37%
Medicaid 43%
Discharges
171 total

Coverage residents most often leave under.

Medicare 11%
Private pay 32%
Medicaid 57%

Places of interest near The Blossoms at Fort Smith Rehab & Nursing Center

Address 3.5 miles from city center Info Estimated distance in miles from Fort Smith's city center to The Blossoms at Fort Smith Rehab & Nursing Center's address, calculated via Google Maps.

Calculate Travel Distance to The Blossoms at Fort Smith Rehab & Nursing Center

Add your location

Address

Compare Nursing Homes around Fort Smith

The information below is reported by the Arkansas Department of Human Services, Office of Long Term Care.

5 facilities compared · CMS & AR Dept. of Health data

Chapel Ridge Health and Rehab
NH
SNF
Fort Smith
84
Facility 84
AR AVG 84
Rank #176 / 330
96.4% +35%5.51 -43%+18%$0204.0-69A+
6
Facility 6
AR AVG 34
Rank #363 / 419
Jennifer Williams$9.3MFiscal year ending 12/2023$4.4MFiscal year ending 12/202347.3%Fiscal year ending 12/202345364
Covington Court Health And Rehabilitation Center
NH
PC
SNF
Fort Smith
140
Facility 140
AR AVG 84
Rank #17 / 330
69.3% -3%5.17 +30%+11%$12.2k375.3197-
39
Facility 39
AR AVG 34
Rank #165 / 419
Dow Wilson$14.6MFiscal year ending 12/2023$7.0MFiscal year ending 12/202347.9%Fiscal year ending 12/202345363
Arbor Oaks Healthcare and Rehabilitation Center
NH
RC
SNF
Malvern
94
Facility 94
AR AVG 84
Rank #154 / 330
52.9% -26%4.11 -50%-12%$8.0k204.0167-
5
Facility 5
AR AVG 34
Rank #369 / 419
James Towers$6.8MFiscal year ending 12/2023$3.0MFiscal year ending 12/202343.7%Fiscal year ending 12/202345270
Fianna Hills Nursing and Rehabilitation Center
NH
HOS
MC
RC
SNF
Fort Smith
102
Facility 102
AR AVG 84
Rank #125 / 330
85.3% +20%4.84 -30%+4%$02010.0-95A+
73
Facility 73
AR AVG 34
Rank #12 / 419
Rhs Nursing, LLC$11.5MFiscal year ending 12/2023$4.4MFiscal year ending 12/202338.1%Fiscal year ending 12/202345354
The Blossoms at Fort Smith Rehab & Nursing Center
NH
MC
PC
RC
SNF
Fort Smith (Mill Creek)
130
Facility 130
AR AVG 84
Rank #47 / 330
82.3% +15%3.88 -17%-17%$0373.71118-
34
Facility 34
AR AVG 34
Rank #203 / 419
Brandon Brown$11.7MFiscal year ending 06/2024$4.5MFiscal year ending 06/202438.9%Fiscal year ending 06/202445345

Financial Assistance for
Nursing Home in Arkansas

The Blossoms at Fort Smith Rehab & Nursing Center is located in Fort Smith, Arkansas.
Here are the financial assistance programs available to residents in Arkansas.

Get Financial aid guidance

ARChoices

Arkansas Medicaid ARChoices

Age 65+ or 21+ with disability
General Arkansas resident, Medicaid- eligible, nursing home-level care need.
Income Limits (2025) ~$2,829/month 300% FBR, individual
Asset Limits $2,000 (individual), $3,000 (couple).
AR

Rural focus; possible waitlists.

Benefits
Personal care (5-7 hours/day) Meals ($7/meal) Respite care (240 hours/year) Adult day services ($60/day)

Choices in Living Resource Center

Arkansas Choices in Living

Age 60+
General Arkansas resident.
Income Limits No strict limit; prioritizes low-income.
Asset Limits Not applicable.
AR

Limited direct funding; mostly referral-based.

Benefits
Care coordination Limited respite (up to 5 days/year) Transportation assistance (~5 trips/month)

Living Choices Assisted Living Waiver

Arkansas Medicaid Living Choices Assisted Living Waiver

Age 65+
General Arkansas resident, requires nursing home-level care, lives in a Level II assisted living facility.
Income Limits (2025) ~$2,829/month 300% FBR, individual
Asset Limits $2,000 (individual), $3,000 (couple); spousal rules apply.
AR

Limited provider network; excludes Level I facilities (no nursing services).

Benefits
Personal care (~5 hours/day) Medication management Nursing Activities Transportation

Program of All-Inclusive Care for the Elderly (PACE)

Arkansas Medicaid PACE

Age 55+
General Arkansas resident, nursing home-level care, safe with PACE support.
Income Limits (2025) ~$2,829/month 300% FBR
Asset Limits $2,000 (individual), $3,000 (couple).
AR

Limited geographic availability.

Benefits
Primary/preventive care Personal care (5-7 hours/day) Meals Transportation Therapy

Arkansas State Plan Personal Care

Arkansas Medicaid Personal Care Program

Age
General Any age, Arkansas resident, needs ADL/IADL help, Medicaid-eligible.
Income Limits (2025) ~$1,004/month individual
Asset Limits $9,660 (individual), $14,470 (couple).
AR

No nursing home-level care requirement.

Benefits
Personal care (~4-6 hours/day) Homemaker services (e.g., meal prep)

Frequently Asked Questions about The Blossoms at Fort Smith Rehab & Nursing Center

What neighborhood is The Blossoms at Fort Smith Rehab & Nursing Center in?

The Blossoms at Fort Smith Rehab & Nursing Center is in the Mill Creek neighborhood of Fort Smith.

Who is the owner of The Blossoms at Fort Smith Rehab & Nursing Center?

The Blossoms at Fort Smith Rehab & Nursing Center is legally operated by Wheeler Avenue Operating LLC, and administered by Sanford Yarbrough.

Is The Blossoms at Fort Smith Rehab & Nursing Center in a walkable area?

The Blossoms at Fort Smith Rehab & Nursing Center has a walk score of 34. Somewhat walkable. A few nearby services may be reachable on foot, but most trips require transportation.

What is the occupancy rate at The Blossoms at Fort Smith Rehab & Nursing Center?

The Blossoms at Fort Smith Rehab & Nursing Center's occupancy is 82%.

Does The Blossoms at Fort Smith Rehab & Nursing Center operate as a for-profit or non-profit?

The Blossoms at Fort Smith Rehab & Nursing Center is registered as a for-profit in AR.

Who is the administrator of The Blossoms at Fort Smith Rehab & Nursing Center?

Sanford Yarbrough is the administrator of The Blossoms at Fort Smith Rehab & Nursing Center.

How many beds does The Blossoms at Fort Smith Rehab & Nursing Center have?

The Blossoms at Fort Smith Rehab & Nursing Center has 130 beds.

Guides for Better Senior Living

Care Cost Calculator: See Prices in Your Area

Nursing Home Data Explorer

Don’t Wait Too Long: 7 Red Flag Signs Your Parent Needs Assisted Living Now

The True Cost of Assisted Living in 2025 – And How Families Are Paying For It

Understanding Senior Living Costs: Pricing Models, Discounts & Financial Assistance