Life Care Center of West Bridgewater
Nursing Home · Easton, MA
CMS overall rating Info The Overall CMS Rating is scored from 1 to 5 stars and combines results from health inspections, staffing levels, and quality measures. Health inspections carry the most weight. Staffing and quality scores can increase or decrease the final rating based on performance compared to state and national standards.

Life Care Center of West Bridgewater

Nursing Home · Easton, MA
CMS overall rating Info The Overall CMS Rating is scored from 1 to 5 stars and combines results from health inspections, staffing levels, and quality measures. Health inspections carry the most weight. Staffing and quality scores can increase or decrease the final rating based on performance compared to state and national standards.
Calculator: See prices in your area
Life Care Center of West Bridgewater accepts Medicare, Medicaid, and private pay.

Overview of Life Care Center of West Bridgewater

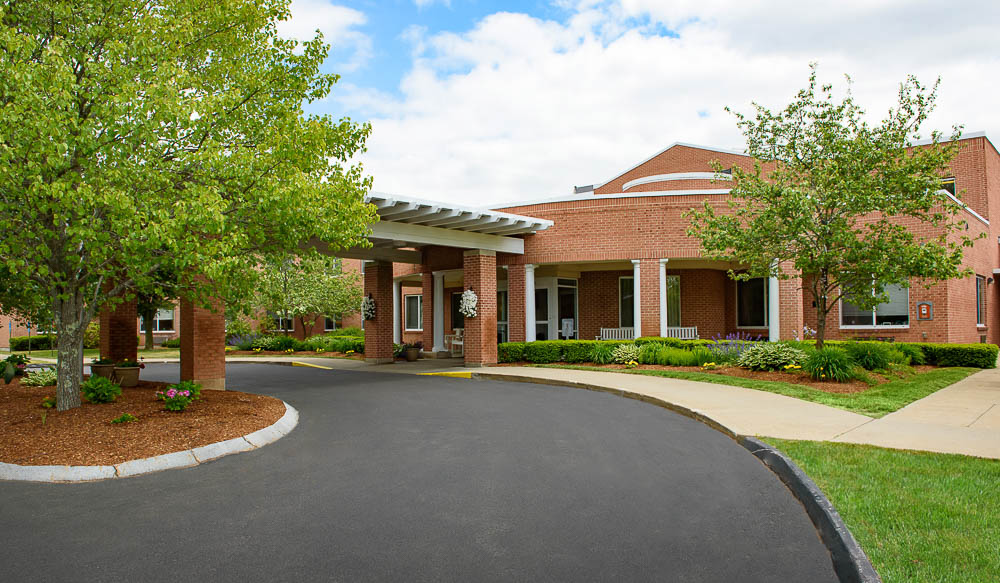
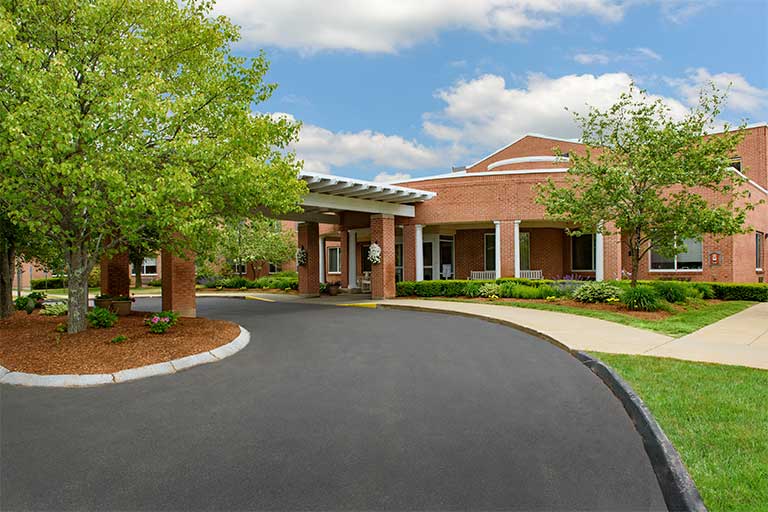
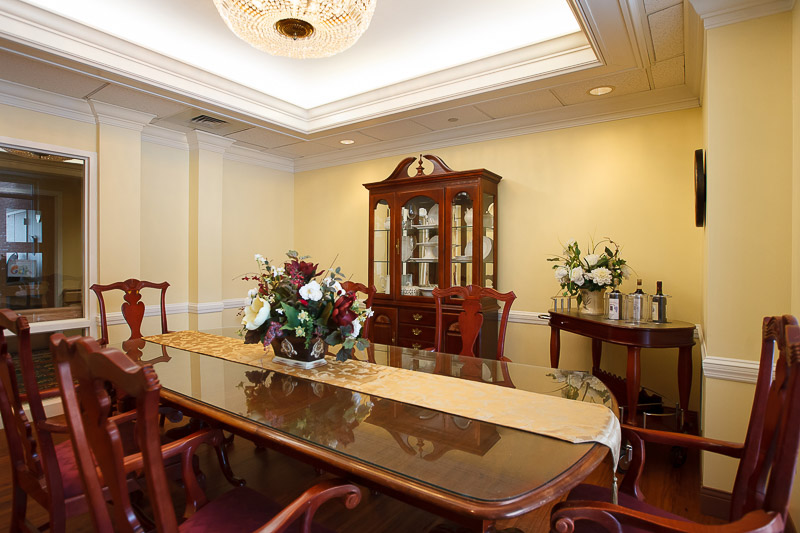
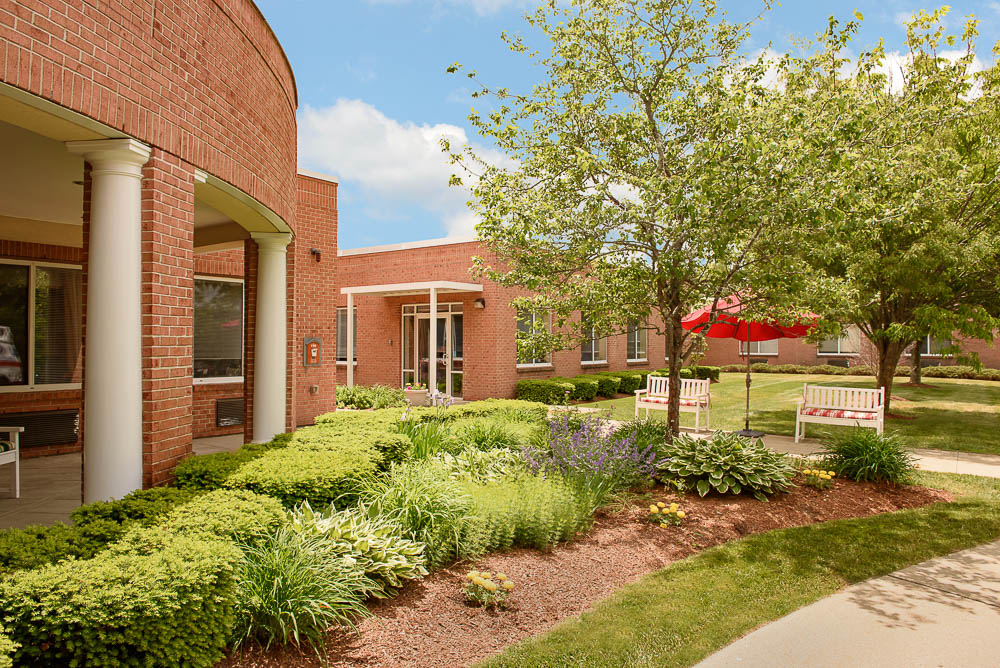
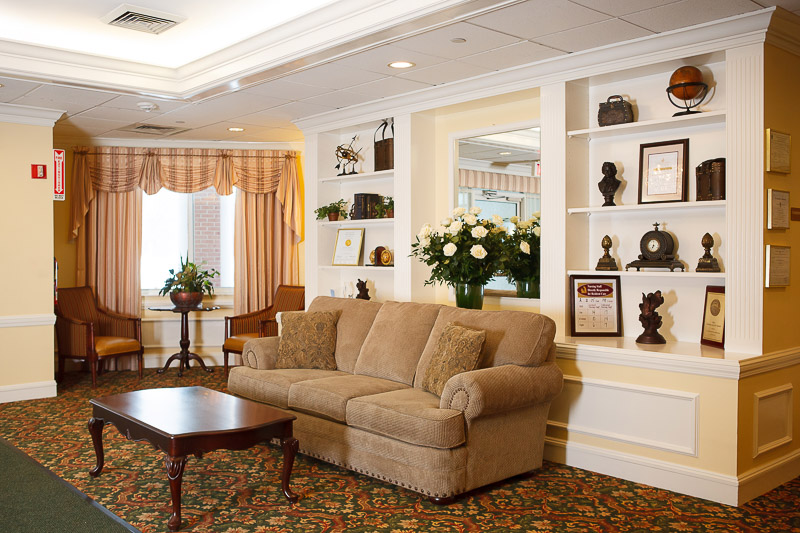
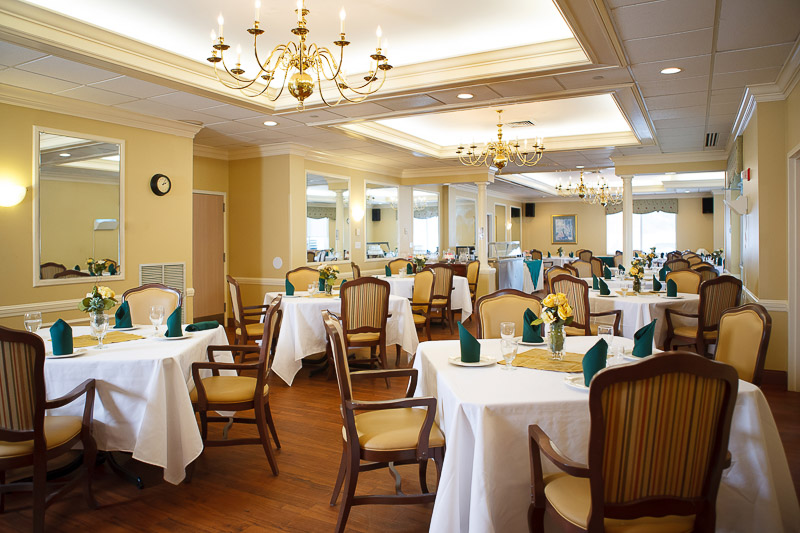
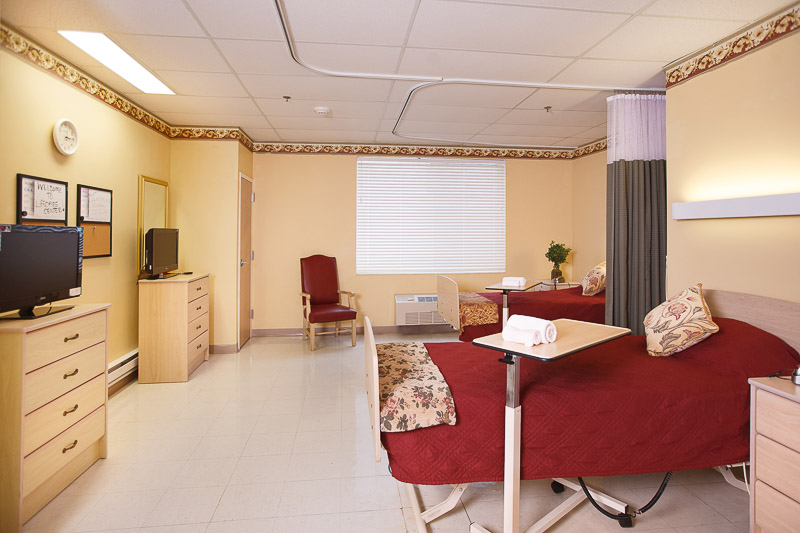
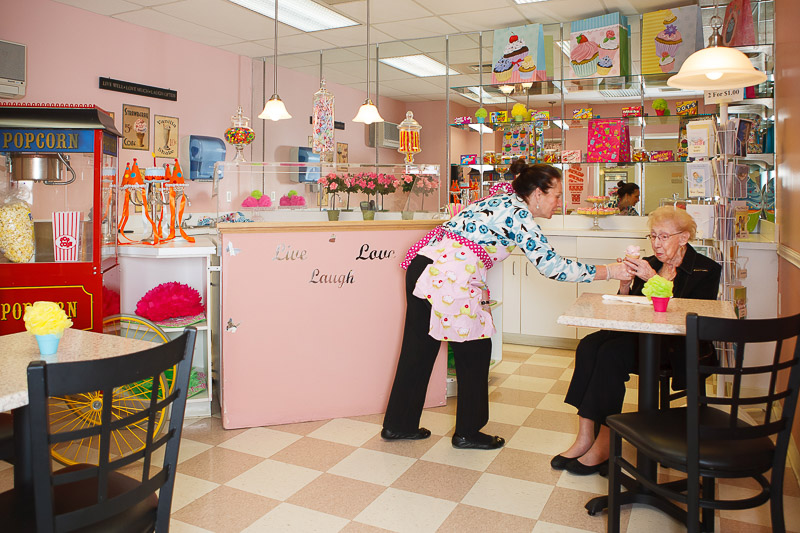
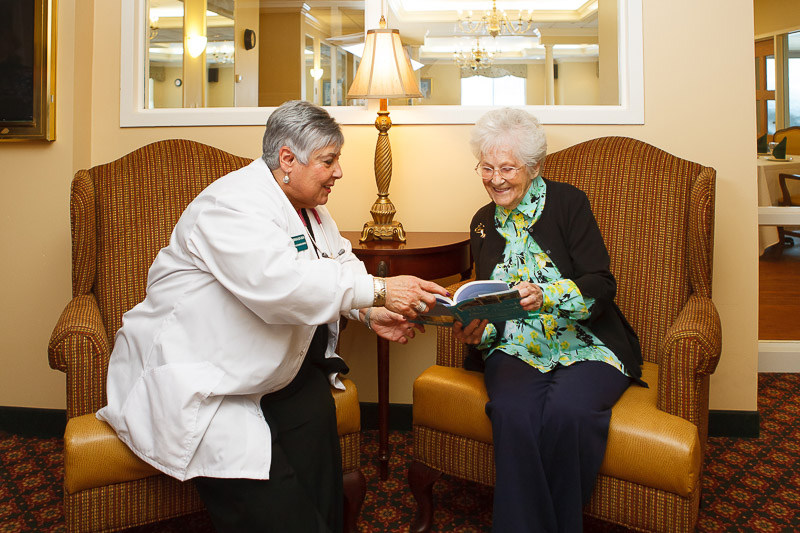
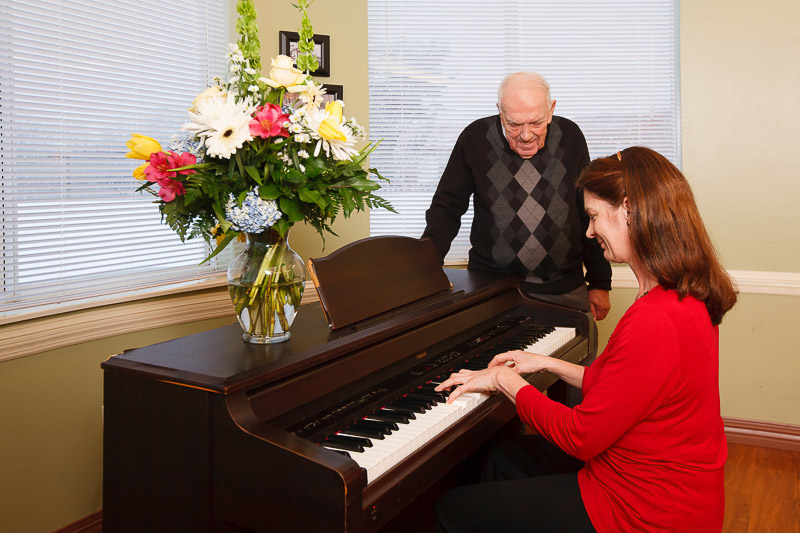
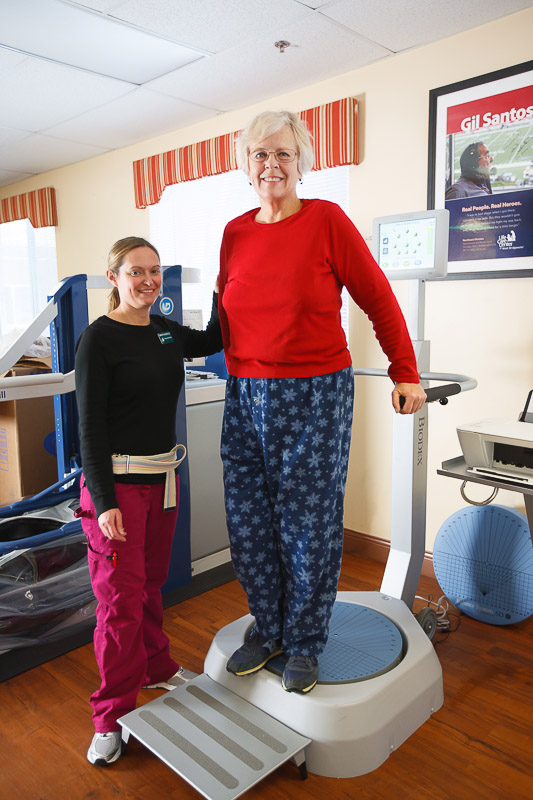
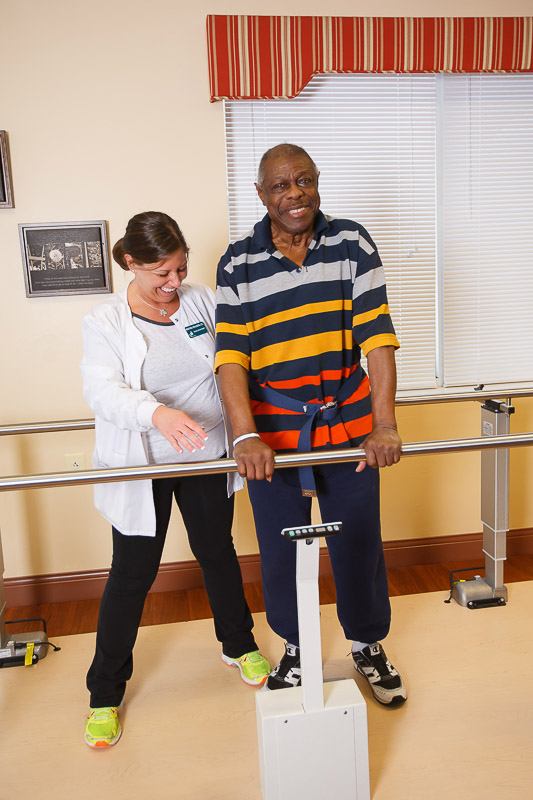
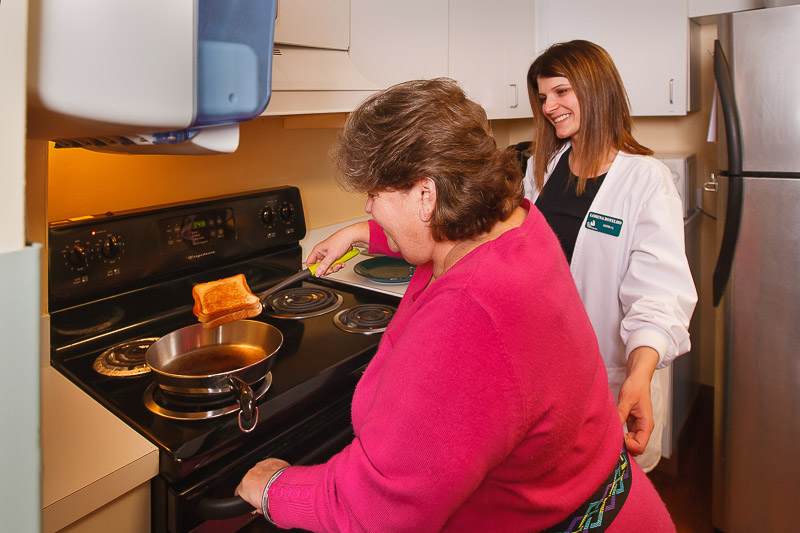
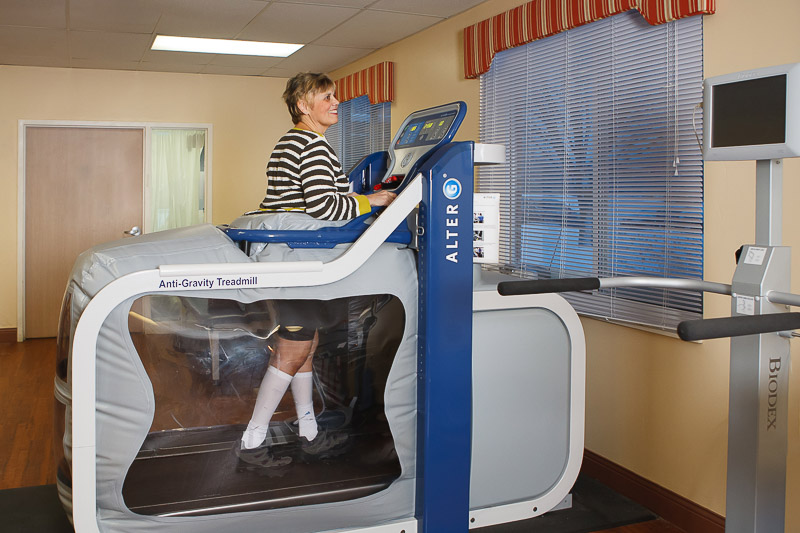
Life Care Center of West Bridgewater is a highly recognized nursing home in West Bridgewater, MA, offering long-term care and rehabilitation. The community’s warm and home-like setting ensures older adults have a comfortable stay. Excellent services, including restaurant-style dining, housekeeping, laundry, and 24-hour care, are also provided to enrich residents’ living experiences. Residents can also focus on recovery and wellness with personalized care plans tailored to their unique needs and habits.

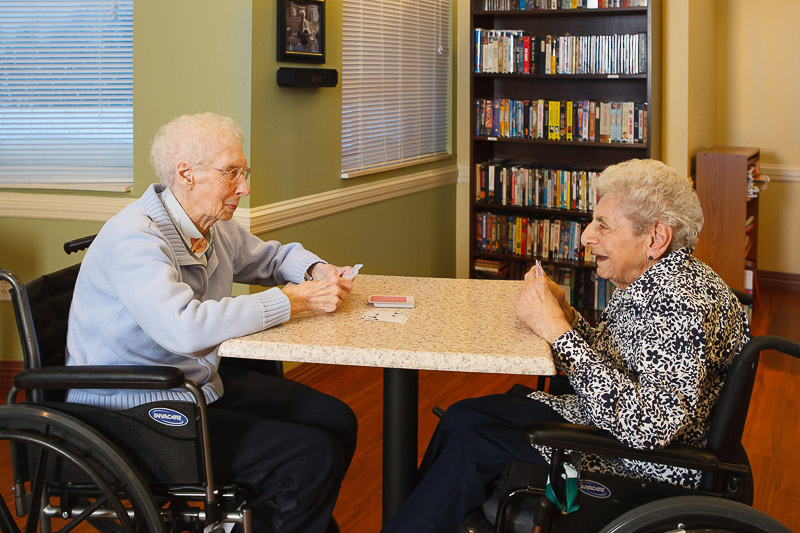
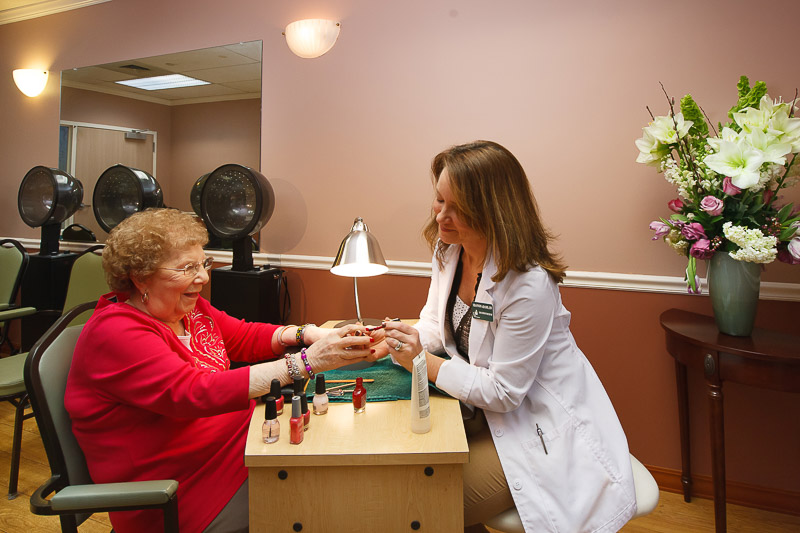
Fun gatherings, light exercises, and various games provide residents with more opportunities to explore interests and have fun. A beauty salon and a barber shop and accessible amenities also ensure residents’ relaxation and safety. Residents also experience a laid-back lifestyle, as it is beautifully set in the peaceful neighborhood of West Bridgewater, near restaurants and shops. This nursing home ensures older adults can live to their potential in retirement, making it a great choice for senior living in Massachusetts.

(508) 580-4400

Quality ratings

Measured by Centers for Medicare & Medicaid Services (CMS)

Overall rating Info The Overall CMS Rating combines results from health inspections, staffing levels and quality measures. Health inspections carry the most weight. Staffing and quality scores can increase or decrease the final rating based on performance compared to state and national standards.
▲ 72.4% Above MA avg. ▲ 72.4% Above MA avg.Click the badge to see the full State ranking.Click here to see the full State ranking.
Health Inspection Info Based on the results of the facility's three most recent standard inspections and any complaint investigations. CMS reviews the number, scope, and severity of deficiencies, with more recent findings weighted more heavily.
▲ 40.5% Above MA avg. ▲ 40.5% Above MA avg.Click the badge to see the full State ranking.Click here to see the full State ranking.
Staffing Info Measures average nursing staff hours per resident per day, including Registered Nurses (RNs) and total nursing staff. Ratings are adjusted based on the level of care residents require and are compared to state and national benchmarks.
▲ 33.3% Above MA avg. ▲ 33.3% Above MA avg.Click the badge to see the full State ranking.Click here to see the full State ranking.
Quality Measures Info Based on clinical and physical health indicators reported to CMS, such as hospital readmissions, falls, pressure ulcers, and improvements in mobility. These measures reflect how well residents' health needs are being managed.
▲ 57.3% Above MA avg. ▲ 57.3% Above MA avg.Click the badge to see the full State ranking.Click here to see the full State ranking.

Staffing hours breakdown

Info Daily nursing hours per resident by staff type, reported to CMS. Higher is generally better — compare this facility to state and national averages to see where staffing stands.

Hours per resident per day — compared to Massachusetts state averages

Total nursing care / resident Info This home is ranked 48th out of 89 homes in Massachusetts. Total adjusted nursing hours per resident per day, combining RN, LPN, and aide time. CMS adjusts this for case-mix so facilities can be fairly compared.
3h 49m per day
Rank #48 / 89Nurse hours — State benchmarkedThis home is ranked 48th out of 89 homes in Massachusetts. Shows adjusted nurse hours per resident per day benchmarked to the Massachusetts average, with a ranking across 89 Massachusetts SNFs. More hours mean more direct care. The national average is about 3.5 hrs; below 3.0 is a red flag.Click the rank badge to see the full State ranking.Click here to see the full State ranking.
This facility Massachusetts avg (3h 56m per day)
vs Massachusetts avg
-3%

1 of 1 metrics below state avg

Staff typeHours / Day / Residentvs state avg
Weekend Total Nursing Info Combined nursing hours (RN + LPN + Nurse Aide) per resident per day on weekends. Staffing often drops on weekends — this figure reveals whether the facility maintains adequate coverage outside of weekday hours. 3h 22m per day ▼ 3% State avg: 3h 29m per day · National avg: 3h 25m per day

Types of Care at Life Care Center of West Bridgewater

Nursing Home

Capacity and availability

This home usually has limited availability

Higher occupancy than the Massachusetts average: 82%
Occupancy rate
85% Rank #48 / 92Occupancy rate — State benchmarkedThis home is ranked 48th out of 92 homes in Massachusetts. Shows this facility's occupancy rate versus the Massachusetts average, with its Statewide rank out of 92. Higher occupancy signals strong local demand and financial stability.Click the rank badge to see the full State ranking.Click here to see the full State ranking.
Avg. Length of Stay
55 days
Walk Score
Walk Score: 24 / 100 Rank #386 / 499Walk Score — State benchmarkedThis home is ranked 386th out of 499 homes in Massachusetts. Shows how walkable this facility's neighborhood is compared to the average Walk Score across Massachusetts SNFs. Higher scores benefit residents, families, and staff.Click the rank badge to see the full State ranking.Click here to see the full State ranking.
Car-dependent. Most errands require a car, with limited nearby walkable options.

About this community

Awards

AwardsBest Nursing Home, U.S. News & World Report 2026

License Details

Safety & Compliance

Secured Perimeter

Therapy & Rehabilitation

2 services
Rehabilitation Services
Short-Term Rehab

Staffing & Medical

2 services
Doctor on Staff
24-Hour Staffing

Amenities & Lifestyle

Branded ProgramsAlterG® Anti-Gravity Treadmill®, VitalStim® therapy
Specific ProgramsLCCA.com Home, Make a Payment, Life Care Center of West Bridgewater, Care & Services, We are hiring. Join our team!
Religious ServicesYes

Contact Life Care Center of West Bridgewater

Staffing Data

Reporting period: October 1 – December 31, 2025 (Q4 2025). Source: CMS Payroll-Based Journal report.

Total staff 228
Employees 223
Contractors 5
Staff to resident ratio 1.73:1
0% compared with Massachusetts average
Massachusetts average ratio: 1.66:1 Massachusetts average ratio: 1.66:1See full Massachusetts ranking
Avg staff/day 88
Average shift 7.6 hours
0% compared with Massachusetts average
Massachusetts average: 7.9 hours Massachusetts average shift: 7.9 hoursSee full Massachusetts ranking
Total staff hours (quarter) 61,158

Nursing staff breakdown

Q4 2025 · Oct 1 – Dec 31 More info This data comes from the CMS Payroll-Based Journal report covering October 1 – December 31, 2025.
Registered Nurse

Manages medical care and health needs.

RN Staff 24
Average shift length Info Average shift length. Calculated as total hours divided by days worked and average staff per day. 7.8 hours

No contractors work on this role.

Licensed Practical Nurse

Assists with medical care and medications.

LPN Staff 39
Average shift length Info Average shift length. Calculated as total hours divided by days worked and average staff per day. 8.1 hours

No contractors work on this role.

Certified Nursing Assistant

Helps with daily care and mobility.

CNA Staff 86
Average shift length Info Average shift length. Calculated as total hours divided by days worked and average staff per day. 7.6 hours

No contractors work on this role.

Contractor staffing

Q4 2025 · Oct 1 – Dec 31 More info This data comes from the CMS Payroll-Based Journal report covering October 1 – December 31, 2025.

Total hours from contractors

1.3%

801 contractor hours this quarter

Physical Therapy Assistant: 1 Speech Language Pathologist: 1 Respiratory Therapy Technician: 1 Medical Director: 1 Occupational Therapy Assistant: 1

Staff by category

Q4 2025 · Oct 1 – Dec 31 More info This data comes from the CMS Payroll-Based Journal report covering October 1 – December 31, 2025.
Certified Nursing Assistant8608625,09492100%7.6
Licensed Practical Nurse3903914,78992100%8.1
Registered Nurse240244,53992100%7.8
Clinical Nurse Specialist100103,6187480%7.3
Physical Therapy Assistant101112,2789098%7
Other Dietary Services Staff8082,24692100%6.2
Speech Language Pathologist8192,18592100%7.1
Physical Therapy Aide120121,3098693%6.2
Respiratory Therapy Technician121139828592%6.3
Dental Services Staff2027076368%8.2
Qualified Social Worker4047066874%6.9
Administrator1015286672%8
Nurse Practitioner1015006267%8.1
Mental Health Service Worker1014966267%8
Other Social Services Staff1014565762%8
Occupational Therapy Aide2024495762%7.9
Respiratory Therapist1011201516%8
Occupational Therapy Assistant0111011112%9.1
Medical Director0113533%11.5
RN Director of Nursing1012433%8
86 Certified Nursing Assistant
% of Days 100%
39 Licensed Practical Nurse
% of Days 100%
24 Registered Nurse
% of Days 100%
10 Clinical Nurse Specialist
% of Days 80%
11 Physical Therapy Assistant
% of Days 98%
8 Other Dietary Services Staff
% of Days 100%
9 Speech Language Pathologist
% of Days 100%
12 Physical Therapy Aide
% of Days 93%
13 Respiratory Therapy Technician
% of Days 92%
2 Dental Services Staff
% of Days 68%
4 Qualified Social Worker
% of Days 74%
1 Administrator
% of Days 72%
1 Nurse Practitioner
% of Days 67%
1 Mental Health Service Worker
% of Days 67%
1 Other Social Services Staff
% of Days 62%
2 Occupational Therapy Aide
% of Days 62%
1 Respiratory Therapist
% of Days 16%
1 Occupational Therapy Assistant
% of Days 12%
1 Medical Director
% of Days 3%
1 RN Director of Nursing
% of Days 3%

Penalties and fines

Federal penalties imposed by CMS for regulatory violations, including civil money penalties (fines) and denials of payment for new Medicare/Medicaid admissions.

Source: CMS Penalties Database

No penalties in the past 3 years

No civil money penalties or payment denials were reported in the last 3 years.

Quality of care over time

These measures show how residents usually do over time at this home, based on health outcomes and preventive care.

High-risk clinical events score Info A composite score based on pressure ulcers, falls with injury, weight loss, walking ability decline, and activities of daily living decline. 10.5
In line with Massachusetts average

Massachusetts average: 10.2

Functional decline score Info A composite score based on activities of daily living decline, walking ability decline, and incontinence. 24.4
22% worse than Massachusetts average

Massachusetts average: 20.0

Long-stay resident measures
Need for Help with Daily Activities Increased Info Percent of long-stay residents whose need for help with daily activities has increased 17.6%
6% better than Massachusetts average

Massachusetts average: 18.7%

Walking Ability Worsened Info Percent of long-stay residents whose ability to move independently worsened 19.4%
In line with Massachusetts average

Massachusetts average: 19.3%

Low Risk Residents with Bowel/Bladder Incontinence Info Percent of low risk long-stay residents who lose control of their bowels or bladder 36.3%
64% worse than Massachusetts average

Massachusetts average: 22.1%

Falls with Major Injury Info Percent of long-stay residents experiencing one or more falls with major injury 2.1%
41% better than Massachusetts average

Massachusetts average: 3.6%

High Risk Residents with Pressure Ulcers Info Percent of long-stay high risk residents with pressure ulcers 6.6%
43% worse than Massachusetts average

Massachusetts average: 4.7%

Urinary Tract Infection Info Percent of long-stay residents with a urinary tract infection 2.2%
6% worse than Massachusetts average

Massachusetts average: 2.1%

Lost Too Much Weight Info Percent of long-stay residents who lose too much weight 7.0%
35% worse than Massachusetts average

Massachusetts average: 5.2%

Depressive Symptoms Info Percent of long-stay residents who have depressive symptoms 1.3%
88% better than Massachusetts average

Massachusetts average: 10.7%

Antipsychotic Use Info Percent of long-stay residents who received an antipsychotic medication 5.4%
73% better than Massachusetts average

Massachusetts average: 20.3%

Pneumococcal Vaccine Info Percent of long-stay residents assessed and appropriately given the pneumococcal vaccine 93.7%
In line with Massachusetts average

Massachusetts average: 91.9%

Influenza Vaccine Info Percent of long-stay residents assessed and appropriately given the seasonal influenza vaccine 100.0%
5% better than Massachusetts average

Massachusetts average: 94.8%

Short-stay resident measures
Pneumococcal Vaccine Info Percent of short-stay residents assessed and appropriately given the pneumococcal vaccine 97.4%
27% better than Massachusetts average

Massachusetts average: 76.7%

Antipsychotic medication increase Info Percent of short-stay residents who newly received an antipsychotic medication 0.8%
42% better than Massachusetts average

Massachusetts average: 1.3%

Influenza Vaccine Info Percent of short-stay residents assessed and appropriately given the seasonal influenza vaccine 99.4%
28% better than Massachusetts average

Massachusetts average: 77.7%

Breakdown by payment type

Medicare

65% of new residents, usually for short-term rehab.

Typical stay 30 days

Private pay

26% of new residents, often for short stays.

Typical stay 1 - 2 months

Medicaid

9% of new residents, often for long-term daily care.

Typical stay 8 - 9 months

Facility Characteristics

Source: CMS Long-Term Care Facility Characteristics (Data as of Jan 2026)

Total residents 132
Medicare
43
32.6% of residents
Medicaid
52
39.4% of residents
Private pay or other
37
28% of residents
Programs & Services
Residents Group

Residents meet regularly to discuss policies, care quality, and activities

Active Resident Council

Organized group of residents that meets regularly to discuss facility policies, quality of life, and activities.

Finances and operations

Privately-owned community
Home revenue
$31.1M
Profit
$2.2M
Privately-owned community
Home revenue
$31.1M Rank #11 / 92Revenue — State benchmarkedThis home is ranked 11th out of 92 homes in Massachusetts. Shows this facility's annual revenue compared to the Massachusetts SNF average. Higher revenue generally means more resources for staffing and capital — read alongside Payroll %.Click the rank badge to see the full State ranking.Click here to see the full State ranking.
Profit
$2.2M
Payroll costs Info The portion of the home's budget spent on staff, including nurses, caregivers, and other employees who support care and operations. Rank #18 / 92Payroll — State benchmarkedThis home is ranked 18th out of 92 homes in Massachusetts. Shows total annual staff payroll benchmarked to the Massachusetts average. Higher payroll investment relative to peers often signals better staffing and less reliance on cheaper contract labor.Click the rank badge to see the full State ranking.Click here to see the full State ranking.
$14.2M
45.7% of revenue Rank #64 / 92Payroll % — State benchmarkedThis home is ranked 64th out of 92 homes in Massachusetts. Shows payroll as a percentage of revenue versus the Massachusetts average. Well-run Massachusetts SNFs typically land around 54–65% — the top third Statewide. Below 25% may signal understaffing or heavy agency use — read with Staffing ratings.Click the rank badge to see the full State ranking.Click here to see the full State ranking.
Other operating costs Info All remaining costs needed to run the home, such as food, utilities, building maintenance, supplies and administrative expenses.
$14.7M
Total costs $28.9M

What does this home offer?

Housing options icon

Housing Options: Private/Semi-Private Rooms

Building type icon
Building type icon

Building Type: 2-story

On-site medical care and health services icon

On-site Medical Care and Health Services

Rehabilitative support icon

Rehabilitative Support

Beauty services icon

Beauty Services

Dining services icon

Dining Services

Housekeeping icon
Housekeeping icon

Housekeeping Services

Social and recreational activities icon

Social and Recreational Activities

Transportation services icon

Transportation Services

Who this home usually serves

TYPE OF STAY

Mostly short-term rehab stays

Most residents typically stay for a few weeks or months before returning home or moving on.

Places of interest near Life Care Center of West Bridgewater

Address 2.6 miles from city center Info Estimated distance in miles from West Bridgewater's city center to Life Care Center of West Bridgewater's address, calculated via Google Maps.

Calculate Travel Distance to Life Care Center of West Bridgewater

Add your location

Address

Financial Assistance for
Nursing Home in Massachusetts

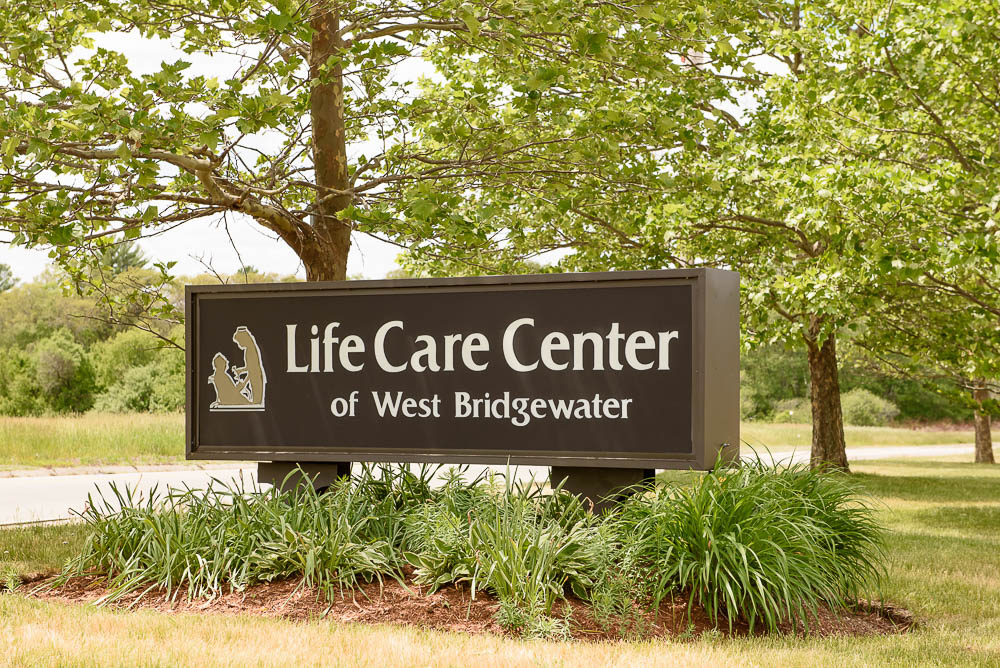
Life Care Center of West Bridgewater is located in West Bridgewater, Massachusetts.
Here are the financial assistance programs available to residents in Massachusetts.

Get Financial aid guidance

Home Care Program

MassHealth Home Care

Age 60+
General Massachusetts resident, at risk of nursing home placement.
Income Limits (2025) ~$1,500/month individual, varies by region
Asset Limits $2,000 individual, excludes home, car
MA

Coordinated through Aging Services Access Points (ASAPs); high demand in urban areas.

Benefits
In-home care (3-5 hours/day) Homemaker services Respite care (up to 14 days/year) Adult day care (~$75/day)

Frail Elder Waiver

Massachusetts Medicaid FE Waiver

Age 65+
General Massachusetts resident, Medicaid-eligible, nursing home-level care need.
Income Limits (2025) ~$2,829/month 300% FBR, individual
Asset Limits $2,000 (individual), $3,000 (couple).
MA

Requires clinical eligibility determination.

Benefits
Personal care (5-7 hours/day) Respite care (240 hours/year) Adult day care (~$75/day) Home health services

Senior Care Options (SCO)

Massachusetts Senior Care Options

Age 65+
General Massachusetts resident, eligible for MassHealth (Medicare optional), nursing home-level care need.
Income Limits (2025) ~$2,829/month (300% FBR, individual); QIT allowed.
Asset Limits $2,000 (individual), $3,000 (couple) (excludes home up to $713,000, car).
MA

Not available in Dukes/Nantucket Counties; multiple SCO providers (e.g., CCA, Tufts).

Benefits
Personal care (5-7 hours/day) Medical care Respite (240 hours/year) Adult

Medicare Savings Program (MSP)

Massachusetts Medicare Savings Program (MassHealth Buy-In)

Age 65+ or disabled
General Massachusetts resident, Medicare Part A/B.
Income Limits (2025) ~$2,510/month (QMB), ~$3,380/month (SLMB), ~$3,598/month (QI)—individual.
Asset Limits $9,430 (individual), $14,130 (couple).
MA

Three tiers; no waitlist; includes Extra Help for Part D.

Benefits
Covers Part B premiums ($174.70/month) Deductibles ($240/year) Copays (~20%)

National Family Caregiver Support Program (NFCSP) Respite

Massachusetts NFCSP Respite Care

Age
General Caregivers of 60+ needing care or 55+ caregivers of others; Massachusetts resident; functional needs (2+ ADLs).
Income Limits (2025) Prioritizes ~$24,980/year (individual); no strict cap.
Asset Limits Not assessed; need-based.
MA

27 ASAPs; prioritizes low-income, rural caregivers.

Benefits
Respite (4-6 hours/week or 5 days/year) Adult day care ($60/day) Caregiver training Supplies (~$500/year)

Prescription Advantage

Massachusetts Prescription Advantage

Age 65+ or disabled
General Massachusetts resident, enrolled in Medicare Part D (or ineligible for Medicare).
Income Limits (2025) No strict limit; copays vary by income ~$24,980-$75,000/year individual
Asset Limits Not assessed.
MA

Supplements Medicare Part D; no enrollment fee for low-income.

Benefits
Covers prescription copays ($5-$40/drug) Fills coverage gaps Catastrophic cost protection ($4,000+ covered)

VA Aid and Attendance (A&A) and Housebound Benefits

Massachusetts VA Aid and Attendance/Housebound

Age 65+ or disabled veteran/spouse
General Massachusetts resident, wartime service, need for ADL help (A&A) or homebound.
Income Limits (2025) Net income < ~$1,984/month (veteran with dependent, A&A); pension offsets income.
Asset Limits ~$155,356 net worth limit
MA

High veteran demand statewide.

Benefits
Cash (~$1,433-$2,642/month veteran, ~$951-$1,318 spouse) for care costs (e.g., in-home, assisted living)

Compare Nursing Home around Easton

The information below is reported by the Massachusetts Executive Office of Elder Affairs and Department of Public Health.

2 facilities compared · CMS & MA Dept. of Health data

Filter by care type
Life Care Center of West Bridgewater
NH

Nursing Home Licensed facility providing 24/7 skilled nursing care for residents with complex, ongoing medical needs. Staffed by RNs, LPNs, and CNAs. Inspected and star-rated annually by CMS. Accepts Medicare (short-term rehab) and Medicaid (long-term care).

West Bridgewater150 85.0% +4%3.82 -18%-3%$0153.8-136 24 Alan Richman$31.1M$14.2M45.7%225704
Southeast Rehabilitation & Skilled Care Center
NH

Nursing Home Licensed facility providing 24/7 skilled nursing care for residents with complex, ongoing medical needs. Staffed by RNs, LPNs, and CNAs. Inspected and star-rated annually by CMS. Accepts Medicare (short-term rehab) and Medicaid (long-term care).

HC

Home Care Professional care delivered in the person's own home — from companionship and errands to skilled nursing and therapy. Allows seniors to age in place. Medicare covers skilled home health when medically necessary.

RC

Respite Care Short-term temporary care — days to weeks — to give family caregivers a break. Full care provided during the stay. Often used after hospitalization or to trial a facility before a permanent placement decision.

North Easton171 87.9% +7%3.38 -58%-14%$51.4k708.84153 10 -$34.1M$13.8M40.5%225225

Frequently Asked Questions about Life Care Center of West Bridgewater

Is Life Care Center of West Bridgewater in a walkable area?

Life Care Center of West Bridgewater has a walk score of 24. Car-dependent. Most errands require a car, with limited nearby walkable options.

What is the occupancy rate at Life Care Center of West Bridgewater?

Life Care Center of West Bridgewater's occupancy is 85.0%.

Are there photos of Life Care Center of West Bridgewater?

Yes — there are 24 photos of Life Care Center of West Bridgewater in the photo gallery on this page.

What is the address of Life Care Center of West Bridgewater?

Life Care Center of West Bridgewater is located at 765 W Center St, West Bridgewater, MA 02379.

What is the phone number of Life Care Center of West Bridgewater?

(508) 580-4400 will put you in contact with the team at Life Care Center of West Bridgewater.

Is Life Care Center of West Bridgewater Medicare or Medicaid certified?

Yes — Life Care Center of West Bridgewater is a CMS-certified provider of Medicare and Medicaid.

Guides for Better Senior Living

Care Cost Calculator: See Prices in Your Area

Nursing Home Data Explorer

Don’t Wait Too Long: 7 Red Flag Signs Your Parent Needs Assisted Living Now

The True Cost of Assisted Living in 2025 – And How Families Are Paying For It

Understanding Senior Living Costs: Pricing Models, Discounts & Financial Assistance

Explore Open Rooms
1 Contact details
2 What type of senior care service are you looking for?
3 What budget do you have in mind for senior care?
4 How soon do you need to find care?
5 Additional details

Thank you for your interest!

Our team will be in touch shortly to help with next steps.