Southeast Rehabilitation & Skilled Care Center
Nursing Home, Hospice Care, Nursing Care & Respite Care · Easton, MA
CMS overall rating Info CMS (the Centers for Medicare & Medicaid Services) is the federal agency that rates nursing home quality. Its Overall Rating runs from 1 to 5 stars, combining health inspections, staffing, and quality measures, with inspections weighted most heavily.

Southeast Rehabilitation & Skilled Care Center

Nursing Home, Hospice Care, Nursing Care & Respite Care · Easton, MA
CMS overall rating Info CMS (the Centers for Medicare & Medicaid Services) is the federal agency that rates nursing home quality. Its Overall Rating runs from 1 to 5 stars, combining health inspections, staffing, and quality measures, with inspections weighted most heavily.
Calculator: See prices in your area
Southeast Rehabilitation & Skilled Care Center accepts Medicare, Medicaid, and private pay.

Overview of Southeast Rehabilitation & Skilled Care Center

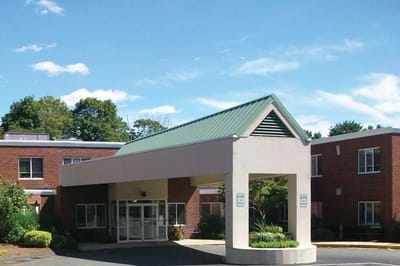
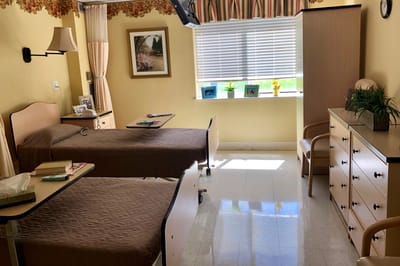
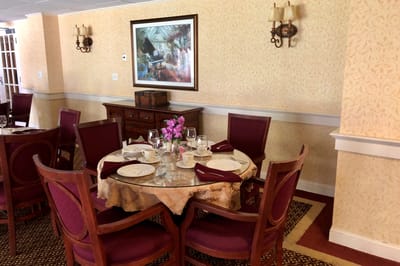
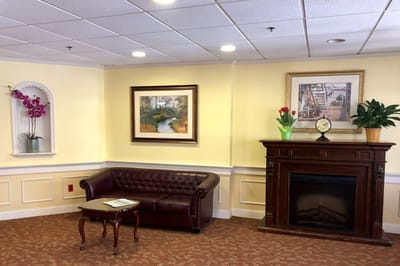
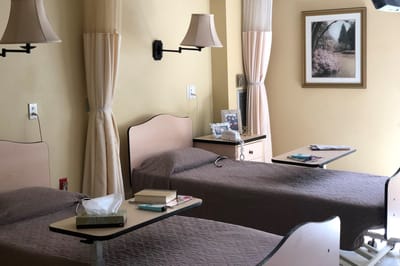
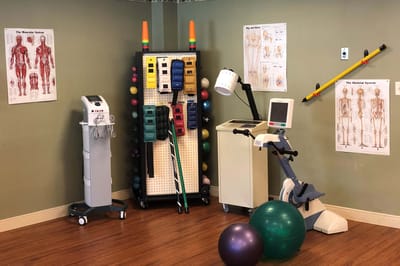
Southeast Rehabilitation & Skilled Care Center is a nursing home in North Easton, MA, offering long-term care, hospice care, rehabilitation, and respite care. The community also promotes a nurturing and welcoming environment, ensuring older adults are well-cared for throughout their stay. Residents also experience a maintenance-free lifestyle with dietitian-approved meals, 24/7 nursing care, and social services. Along with a highly trained care team, personalized care plans are also provided to help residents recover and live to their potential.

Local outings, gardening, and guest speakers ensure residents can continue learning and encourage them to live actively. Residents can also rest and move around comfortably in a clean setting and well-maintained amenities. Surrounded by trees and recreation areas in North Easton, the community ensures a laid-back lifestyle. This nursing home provides high standards of care for older adults’ welfare, making it one of the best choices for senior living in Massachusetts.

Quality ratings

Measured by Centers for Medicare & Medicaid Services (CMS)

Overall rating Info The Overall CMS Rating combines results from health inspections, staffing levels and quality measures. Health inspections carry the most weight. Staffing and quality scores can increase or decrease the final rating based on performance compared to state and national standards.
▼ 65.5% Below MA avg. ▼ 65.5% Below MA avg.MA average: 2.9Click the badge to see the full State ranking.Click here to see the full State ranking.
Health Inspection Info Based on the results of the facility's three most recent standard inspections and any complaint investigations. CMS reviews the number, scope, and severity of deficiencies, with more recent findings weighted more heavily.
▼ 64.9% Below MA avg. ▼ 64.9% Below MA avg.MA average: 2.8Click the badge to see the full State ranking.Click here to see the full State ranking.
Staffing Info Measures average nursing staff hours per resident per day, including Registered Nurses (RNs) and total nursing staff. Ratings are adjusted based on the level of care residents require and are compared to state and national benchmarks.
▼ 33.3% Below MA avg. ▼ 33.3% Below MA avg.MA average: 3.0Click the badge to see the full State ranking.Click here to see the full State ranking.
Quality Measures Info Based on clinical and physical health indicators reported to CMS, such as hospital readmissions, falls, pressure ulcers, and improvements in mobility. These measures reflect how well residents' health needs are being managed.
▼ 68.5% Below MA avg. ▼ 68.5% Below MA avg.MA average: 3.2Click the badge to see the full State ranking.Click here to see the full State ranking.

Staffing hours breakdown

Info Daily nursing hours per resident by staff type, reported to CMS. Higher is generally better — compare this facility to state and national averages to see where staffing stands.

Hours per resident per day — compared to Massachusetts state averages

Total nursing care / resident Info This home is ranked 80th out of 93 homes in Massachusetts for nurse hours. Total adjusted nursing hours per resident per day, combining RN, LPN, and aide time. CMS adjusts this for case-mix so facilities can be fairly compared.
3h 23m per day
Rank #80 / 93Nurse hours — State benchmarkedThis home is ranked 80th out of 93 homes in Massachusetts. Shows adjusted nurse hours per resident per day benchmarked to the Massachusetts average, with a ranking across 93 Massachusetts facilities. More hours mean more direct care. The national average is about 3.5 hrs; below 3.0 is a red flag.Rankings are based only on facilities in Massachusetts that report data for that category. Facilities without available data are excluded from the ranking.Click the rank badge to see the full State ranking.Click here to see the full State ranking.
This facility Massachusetts avg (3h 56m per day)
vs Massachusetts avg
-14%

6 of 6 metrics below state avg

Staff typeHours / Day / Residentvs state avg
Registered Nurse (RN) Info RNs hold the highest nursing license and can assess residents, interpret test results, and direct care plans. More RN hours per day often signals stronger clinical oversight and faster response to health changes. 27m per day ▼ 31% State avg: 39m per day · National avg: 41m per day
LPN / LVN Info Licensed Practical Nurses (LPNs) or Licensed Vocational Nurses (LVNs) deliver routine hands-on care — medication administration, wound dressing, and monitoring vital signs. They work under RN supervision and make up a large share of daily bedside care. 53m per day ▼ 7% State avg: 57m per day · National avg: 52m per day
Nurse Aide Info Certified Nurse Aides (CNAs) provide the most direct day-to-day assistance: bathing, dressing, feeding, and mobility. Nurse aide hours are typically the largest staffing category and directly affect residents' quality of life. 1h 51m per day ▼ 18% State avg: 2h 16m per day · National avg: 2h 20m per day
Weekend Total Nursing Info Combined nursing hours (RN + LPN + Nurse Aide) per resident per day on weekends. Staffing often drops on weekends — this figure reveals whether the facility maintains adequate coverage outside of weekday hours. 2h 48m per day ▼ 20% State avg: 3h 29m per day · National avg: 3h 27m per day
Physical Therapist Info Hours per resident per day provided by licensed Physical Therapists (PTs) or PT Assistants. PT services help residents recover mobility after injury or illness and are especially important for post-acute (short-stay) rehabilitation. 4m per day ▼ 21% State avg: 5m per day · National avg: 4m per day
Weekend RN Info Registered nurse hours specifically on weekends. Facilities sometimes reduce RN presence on Saturdays and Sundays — a low weekend RN figure compared to weekday hours can indicate reduced clinical oversight when most administrative staff are absent. 11m per day ▼ 59% State avg: 27m per day · National avg: 29m per day

Capacity and availability

This home usually has limited availability

Higher occupancy than the Massachusetts average: 82%
Occupancy rate
87.9% Rank #39 / 96Occupancy rate — State benchmarkedThis home is ranked 39th out of 96 homes in Massachusetts. Shows this facility's occupancy rate versus the Massachusetts average, with its Statewide rank out of 96. Higher occupancy signals strong local demand and financial stability.Rankings are based only on facilities in Massachusetts that report data for that category. Facilities without available data are excluded from the ranking.Click the rank badge to see the full State ranking.Click here to see the full State ranking.
Avg. Length of Stay
211 days
Bed community size
171-bed community Rank #13 / 280Bed count — State benchmarkedThis home is ranked 13th out of 280 homes in Massachusetts. Shows this facility's certified or reported bed count compared to other Massachusetts facilities. Larger communities may offer more amenities, programs, and on-site services for residents and families.Rankings are based only on facilities in Massachusetts that report data for that category. Facilities without available data are excluded from the ranking.Click the rank badge to see the full State ranking.Click here to see the full State ranking.
A large-scale community that may provide a wide range of amenities, services, and structured programs.
Walk Score
Walk Score: 10 / 100 Rank #476 / 499Walk Score — State benchmarkedThis home is ranked 476th out of 499 homes in Massachusetts. Shows how walkable this facility's neighborhood is compared to the average Walk Score across Massachusetts facilities. Higher scores benefit residents, families, and staff.Rankings are based only on facilities in Massachusetts that report data for that category. Facilities without available data are excluded from the ranking.Click the rank badge to see the full State ranking.Click here to see the full State ranking.
Car-dependent. Most errands require a car, with limited nearby walkable options.

Contact Southeast Rehabilitation & Skilled Care Center

Staffing Data

Reporting period: October 1 – December 31, 2025 (Q4 2025). Source: CMS Payroll-Based Journal report.

Total staff 150
Employees 146
Contractors 4
Staff to resident ratio 0.97 : 1
42% fewer staff per resident than Massachusetts average
Massachusetts average ratio: 1.66 : 1 Massachusetts average ratio: 1.66 : 1See full Massachusetts ranking
Avg staff/day 74
Average shift 8 hours
0% compared with Massachusetts average
Massachusetts average: 7.9 hours Massachusetts average shift: 7.9 hoursSee full Massachusetts ranking
Total staff hours (quarter) 54,184

Nursing staff breakdown

Q4 2025 · Oct 1 – Dec 31 More info This data comes from the CMS Payroll-Based Journal report covering October 1 – December 31, 2025.
Registered Nurse

Manages medical care and health needs.

RN Staff Info All 8 RN Staff are full-time employees. No contractors work on this role. 8
Average shift length Info Average shift length. Calculated as total hours divided by days worked and average staff per day. 7.9 hours
Licensed Practical Nurse

Assists with medical care and medications.

LPN Staff Info All 34 LPN Staff are full-time employees. No contractors work on this role. 34
Average shift length Info Average shift length. Calculated as total hours divided by days worked and average staff per day. 8.7 hours
Certified Nursing Assistant

Helps with daily care and mobility.

CNA Staff Info All 66 CNA Staff are full-time employees. No contractors work on this role. 66
Average shift length Info Average shift length. Calculated as total hours divided by days worked and average staff per day. 7.8 hours

Contractor staffing

Q4 2025 · Oct 1 – Dec 31 More info This data comes from the CMS Payroll-Based Journal report covering October 1 – December 31, 2025.

Total hours from contractors

0.8%

447 contractor hours this quarter

Feeding Assistant: 2 Occupational Therapy Assistant: 1 Medical Director: 1

Staff by category

Q4 2025 · Oct 1 – Dec 31 More info This data comes from the CMS Payroll-Based Journal report covering October 1 – December 31, 2025.
Certified Nursing Assistant6606625,87292100%7.8
Licensed Practical Nurse3403411,82492100%8.7
Clinical Nurse Specialist8083,7588188%8.9
Other Dietary Services Staff6062,66692100%7.5
Registered Nurse8082,0229199%7.9
Mental Health Service Worker3031,4256470%7.7
Therapeutic Recreation Specialist3031,0038491%7.9
Respiratory Therapy Technician4048486975%6.9
Speech Language Pathologist2027148390%7.4
RN Director of Nursing1015987582%8
Nurse Practitioner1015445964%9.2
Physical Therapy Assistant4045326368%5.7
Administrator1014786368%7.6
Dietitian1014566368%7.2
Qualified Social Worker1014326065%7.2
Occupational Therapy Aide2023354650%7.3
Physical Therapy Aide1012333235%7.3
Feeding Assistant0222304650%5
Medical Director0111854650%4
Occupational Therapy Assistant0113244%8
66 Certified Nursing Assistant
% of Days 100%
34 Licensed Practical Nurse
% of Days 100%
8 Clinical Nurse Specialist
% of Days 88%
6 Other Dietary Services Staff
% of Days 100%
8 Registered Nurse
% of Days 99%
3 Mental Health Service Worker
% of Days 70%
3 Therapeutic Recreation Specialist
% of Days 91%
4 Respiratory Therapy Technician
% of Days 75%
2 Speech Language Pathologist
% of Days 90%
1 RN Director of Nursing
% of Days 82%
1 Nurse Practitioner
% of Days 64%
4 Physical Therapy Assistant
% of Days 68%
1 Administrator
% of Days 68%
1 Dietitian
% of Days 68%
1 Qualified Social Worker
% of Days 65%
2 Occupational Therapy Aide
% of Days 50%
1 Physical Therapy Aide
% of Days 35%
2 Feeding Assistant
% of Days 50%
1 Medical Director
% of Days 50%
1 Occupational Therapy Assistant
% of Days 4%

Penalties and fines

Includes penalties issued in 2023

Federal penalties imposed by CMS for regulatory violations, including civil money penalties (fines) and denials of payment for new Medicare/Medicaid admissions.

Source: CMS Penalties Database (Data as of Jan 2026)

Total fines amount $51K Rank #64 / 94Federal fines — State benchmarkedThis home is ranked 64th out of 94 homes in Massachusetts. Shows this facility's cumulative CMS federal fine dollars versus the Massachusetts average among facilities with fines, and where it ranks among 94 facilities in the pool. Lower total dollars mean a better rank.Rankings are based only on facilities in Massachusetts that report data for that category. Facilities without available data are excluded from the ranking.Click the rank badge to see the full State ranking.Click here to see the full State ranking.
29% lower than Massachusetts average

Massachusetts average: $72K

Number of fines 2
17% more fines than Massachusetts average

Massachusetts average: 1.7

Payment Denials Info Serious action where Medicare and/or Medicaid temporarily stops payments for new residents until issues are fixed. 0
100% fewer payment denials than Massachusetts average

Massachusetts average: 0.1

Fines amount comparison
This facility $51K
Massachusetts average $72K
Penalty History

Penalties are imposed by CMS for violations of federal nursing home regulations.

1 penalty in the past 3 years

Nov 30, 2023 · $12K

Civil Money Penalty Info Fines imposed for noncompliance, which can be assessed per day or per instance of violation. Nov 30, 2023
$12K

Last updated: Jan 2026

Quality of care over time

These measures show how residents usually do over time at this home, based on health outcomes and preventive care.

High-risk clinical events score Info A composite score based on pressure ulcers, falls with injury, weight loss, walking ability decline, and activities of daily living decline. 15.5
52% worse than Massachusetts average

Massachusetts average: 10.2

Functional decline score Info A composite score based on activities of daily living decline, walking ability decline, and incontinence. 29.0
45% worse than Massachusetts average

Massachusetts average: 20.0

Long-stay resident measures
Need for Help with Daily Activities Increased Info Percent of long-stay residents whose need for help with daily activities has increased 29.0%
55% worse than Massachusetts average

Massachusetts average: 18.7%

Walking Ability Worsened Info Percent of long-stay residents whose ability to move independently worsened 33.0%
71% worse than Massachusetts average

Massachusetts average: 19.3%

Low Risk Residents with Bowel/Bladder Incontinence Info Percent of low risk long-stay residents who lose control of their bowels or bladder 24.9%
13% worse than Massachusetts average

Massachusetts average: 22.1%

Falls with Major Injury Info Percent of long-stay residents experiencing one or more falls with major injury 3.2%
11% better than Massachusetts average

Massachusetts average: 3.6%

High Risk Residents with Pressure Ulcers Info Percent of long-stay high risk residents with pressure ulcers 4.7%
In line with Massachusetts average

Massachusetts average: 4.7%

Urinary Tract Infection Info Percent of long-stay residents with a urinary tract infection 3.1%
49% worse than Massachusetts average

Massachusetts average: 2.1%

Lost Too Much Weight Info Percent of long-stay residents who lose too much weight 7.4%
44% worse than Massachusetts average

Massachusetts average: 5.2%

Depressive Symptoms Info Percent of long-stay residents who have depressive symptoms 3.0%
72% better than Massachusetts average

Massachusetts average: 10.7%

Antipsychotic Use Info Percent of long-stay residents who received an antipsychotic medication 33.4%
65% worse than Massachusetts average

Massachusetts average: 20.3%

Pneumococcal Vaccine Info Percent of long-stay residents assessed and appropriately given the pneumococcal vaccine 89.9%
In line with Massachusetts average

Massachusetts average: 91.9%

Influenza Vaccine Info Percent of long-stay residents assessed and appropriately given the seasonal influenza vaccine 75.7%
20% worse than Massachusetts average

Massachusetts average: 94.8%

Short-stay resident measures
Pneumococcal Vaccine Info Percent of short-stay residents assessed and appropriately given the pneumococcal vaccine 71.9%
6% worse than Massachusetts average

Massachusetts average: 76.7%

Antipsychotic medication increase Info Percent of short-stay residents who newly received an antipsychotic medication 1.7%
32% worse than Massachusetts average

Massachusetts average: 1.3%

Influenza Vaccine Info Percent of short-stay residents assessed and appropriately given the seasonal influenza vaccine 41.1%
47% worse than Massachusetts average

Massachusetts average: 77.7%

Breakdown by payment type

Medicare

32% of new residents, usually for short-term rehab.

Typical stay 1 months

Private pay

48% of new residents, often for short stays.

Typical stay 1 - 2 months

Medicaid

21% of new residents, often for long-term daily care.

Typical stay 2 - 3 years

Facility Characteristics

Source: CMS Long-Term Care Facility Characteristics (Data as of Jan 2026)

Total residents 155
Medicare
2
1.3% of residents
Medicaid
149
96.1% of residents
Private pay or other
4
2.6% of residents
Programs & Services
Residents Group

Residents meet regularly to discuss policies, care quality, and activities

Active Resident Council

Organized group of residents that meets regularly to discuss facility policies, quality of life, and activities.

Finances and operations

Based on CMS SNF Cost Report for fiscal year ending in 12/2023.

Voluntary non-profit community
Operated by a church.
Net patient revenue Info Net patient revenue — what the home actually collects for resident care, after contractual allowances, bad debt and discounts are subtracted from its gross charges (CMS cost report, Worksheet G-3). It covers resident care only; money the home earns from other sources is shown separately as "Other income."
$18.8M
Net patient income Info Net patient income: net patient revenue minus the home's total operating expenses. A positive figure means it earns more from resident care than it spends to deliver it; a negative figure means the opposite. It excludes non-operating "other income."
-$1.3M
Voluntary non-profit community Operated by a church.
Net patient revenue Info Net patient revenue — what the home actually collects for resident care, after contractual allowances, bad debt and discounts are subtracted from its gross charges (CMS cost report, Worksheet G-3). It covers resident care only; money the home earns from other sources is shown separately as "Other income."
$18.8M Rank #8 / 96Revenue — State benchmarkedThis home is ranked 8th out of 96 homes in Massachusetts. Shows this facility's annual revenue compared to the Massachusetts average. Higher revenue generally means more resources for staffing and capital — read alongside Payroll %.Rankings are based only on facilities in Massachusetts that report data for that category. Facilities without available data are excluded from the ranking.Click the rank badge to see the full State ranking.Click here to see the full State ranking.
Net patient income Info Net patient income: net patient revenue minus the home's total operating expenses. A positive figure means it earns more from resident care than it spends to deliver it; a negative figure means the opposite. It excludes non-operating "other income."
-$1.3M
Other income Info Money the home earns outside of resident care — such as investments, grants, rentals and other non-operating sources (CMS cost report, Worksheet G-3). It is tracked separately from net patient revenue: it is not part of that figure, and it is not included in net patient income.
$725.8K
Payroll costs Info Staff salaries plus wage-related costs — benefits such as payroll taxes, health insurance and retirement — from the home's own accounting records (CMS cost report, Worksheet A). Contract or agency labor is counted separately, under other operating costs. Rank #21 / 96Payroll — State benchmarkedThis home is ranked 21st out of 96 homes in Massachusetts. Shows total annual staff payroll benchmarked to the Massachusetts average. Higher payroll investment relative to peers often signals better staffing and less reliance on cheaper contract labor.Rankings are based only on facilities in Massachusetts that report data for that category. Facilities without available data are excluded from the ranking.Click the rank badge to see the full State ranking.Click here to see the full State ranking.
$13.6M 72.7% of net patient revenue Info Payroll as a share of revenue: staff salaries and wage-related benefits divided by net patient revenue. A higher figure means more of each revenue dollar goes to staff pay. Rank #84 / 96Payroll % — State benchmarkedThis home is ranked 84th out of 96 homes in Massachusetts. Shows payroll as a percentage of revenue versus the Massachusetts average. Well-run Massachusetts facilities typically land around 54–65% — the top third Statewide. Below 25% may signal understaffing or heavy agency use — read with Staffing ratings.Rankings are based only on facilities in Massachusetts that report data for that category. Facilities without available data are excluded from the ranking.Click the rank badge to see the full State ranking.Click here to see the full State ranking.
Other operating costs Info Everything it costs to run the home apart from payroll — food, utilities, supplies, maintenance, contract labor and administration. Calculated as total operating expense minus payroll (staff salaries and wage-related benefits).
$6.4M
Total costs Info The home's total operating expense for the year — all the costs of running it, salaries included (CMS cost report, Worksheet G-3).
$20.0M

What does this home offer?

Building type icon
Building type icon

Building Type: 2-story

On-site medical care and health services icon

On-site Medical Care and Health Services

Rehabilitative support icon

Rehabilitative Support

Who this home usually serves

TYPE OF STAY

Mix of rehab and long-term care

This home supports both short-term rehab and long-term care, with residents staying for a wide range of durations.

New residents most often arrive under private pay (48% of admissions), and a typical private pay stay runs around 1 - 2 months.

Admissions
243 total

Coverage residents most often arrive under.

Medicare 32%
Private pay 48%
Medicaid 21%
Discharges
260 total

Coverage residents most often leave under.

Medicare 24%
Private pay 43%
Medicaid 33%

Places of interest near Southeast Rehabilitation & Skilled Care Center

Address 1.0 miles from city center Info Estimated distance in miles from North Easton's city center to Southeast Rehabilitation & Skilled Care Center's address, calculated via Google Maps.

Calculate Travel Distance to Southeast Rehabilitation & Skilled Care Center

Add your location

Address

Compare Nursing Homes around Easton

The information below is reported by the Massachusetts Executive Office of Elder Affairs and Department of Public Health.

2 facilities compared · CMS & MA Dept. of Health data

Life Care Center of West Bridgewater
NH
West Bridgewater
150
Facility 150
MA AVG 94
Rank #29 / 280
85.0%
Facility 85.0%
MA AVG 82%
Rank #50 / 96
+4%
3.82
Facility 3.82
MA AVG 3.93
Rank #50 / 93
-18%-3%
$0
Facility $0
MA AVG $76.6k
Rank #1 / 94
15
Facility 15
MA AVG 32.7
Rank #21 / 93
3.8
Facility 3.8
MA AVG 7.2
Rank #17 / 93
-138-
24
Facility 24
MA AVG 53
Rank #386 / 499
Alan Richman
$22.5M
Facility $22.5M
MA AVG $17.4M
Rank #11 / 96
$14.0M
Facility $14.0M
MA AVG $6.5M
Rank #18 / 96
62.4%
Facility 62.4%
MA AVG 43.6%
Rank #67 / 96
225704
Southeast Rehabilitation & Skilled Care Center
NH
HC
NC
RC
North Easton
171
Facility 171
MA AVG 94
Rank #13 / 280
87.9%
Facility 87.9%
MA AVG 82%
Rank #39 / 96
+7%
3.38
Facility 3.38
MA AVG 3.93
Rank #80 / 93
-58%-14%
$11.9k
Facility $11.9k
MA AVG $76.6k
Rank #64 / 94
70
Facility 70
MA AVG 32.7
Rank #90 / 93
8.8
Facility 8.8
MA AVG 7.2
Rank #71 / 93
4152-
10
Facility 10
MA AVG 53
Rank #476 / 499
-
$18.8M
Facility $18.8M
MA AVG $17.4M
Rank #8 / 96
$13.6M
Facility $13.6M
MA AVG $6.5M
Rank #21 / 96
72.7%
Facility 72.7%
MA AVG 43.6%
Rank #84 / 96
225225

Financial Assistance for
Nursing Home in Massachusetts

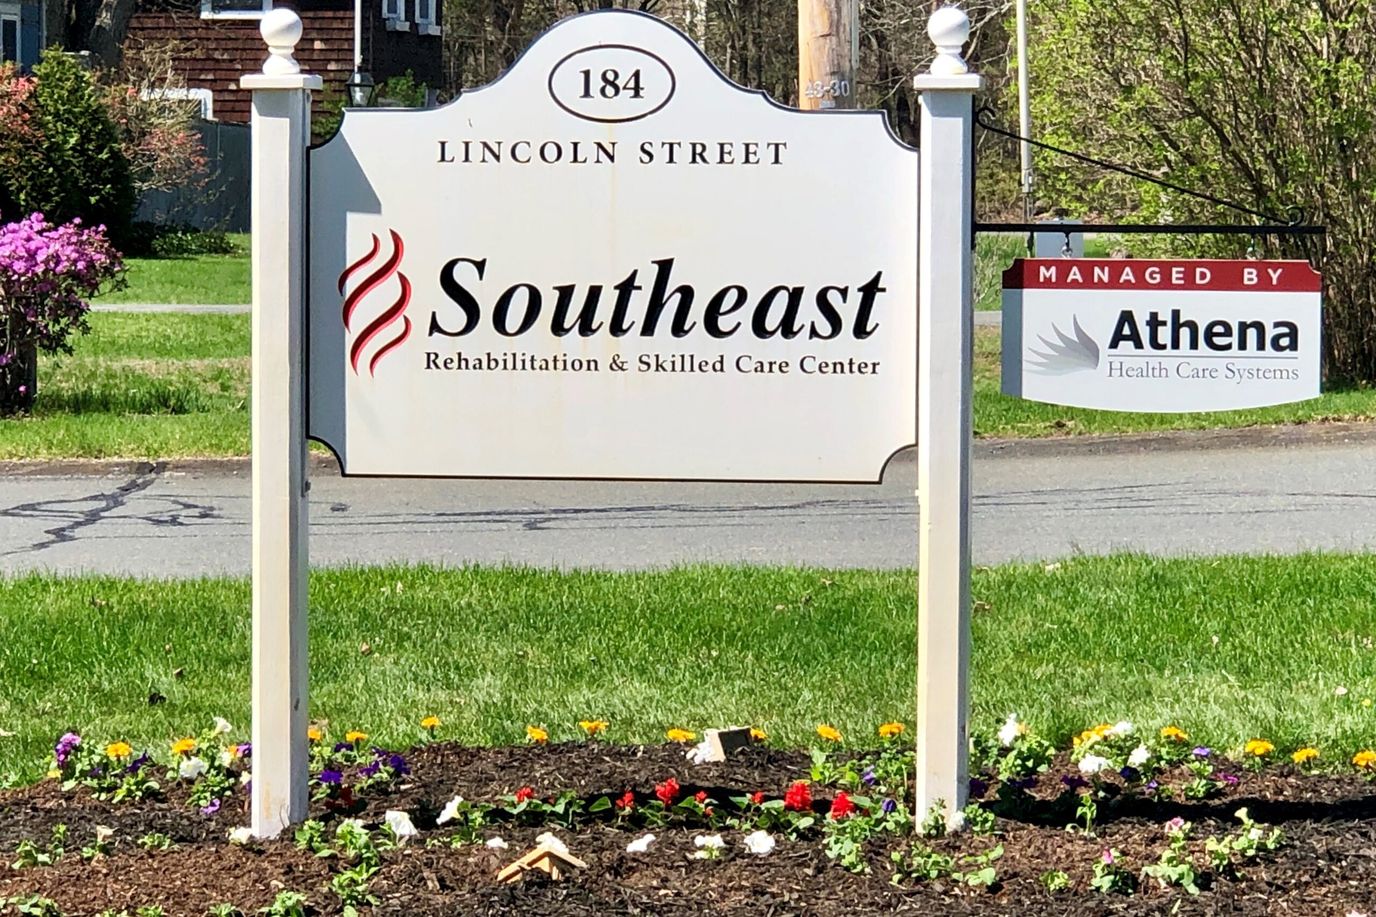
Southeast Rehabilitation & Skilled Care Center is located in North Easton, Massachusetts.
Here are the financial assistance programs available to residents in Massachusetts.

Get Financial aid guidance

Home Care Program

MassHealth Home Care

Age 60+
General Massachusetts resident, at risk of nursing home placement.
Income Limits (2025) ~$1,500/month individual, varies by region
Asset Limits $2,000 individual, excludes home, car
MA

Coordinated through Aging Services Access Points (ASAPs); high demand in urban areas.

Benefits
In-home care (3-5 hours/day) Homemaker services Respite care (up to 14 days/year) Adult day care (~$75/day)

Frail Elder Waiver

Massachusetts Medicaid FE Waiver

Age 65+
General Massachusetts resident, Medicaid-eligible, nursing home-level care need.
Income Limits (2025) ~$2,829/month 300% FBR, individual
Asset Limits $2,000 (individual), $3,000 (couple).
MA

Requires clinical eligibility determination.

Benefits
Personal care (5-7 hours/day) Respite care (240 hours/year) Adult day care (~$75/day) Home health services

Senior Care Options (SCO)

Massachusetts Senior Care Options

Age 65+
General Massachusetts resident, eligible for MassHealth (Medicare optional), nursing home-level care need.
Income Limits (2025) ~$2,829/month (300% FBR, individual); QIT allowed.
Asset Limits $2,000 (individual), $3,000 (couple) (excludes home up to $713,000, car).
MA

Not available in Dukes/Nantucket Counties; multiple SCO providers (e.g., CCA, Tufts).

Benefits
Personal care (5-7 hours/day) Medical care Respite (240 hours/year) Adult

Medicare Savings Program (MSP)

Massachusetts Medicare Savings Program (MassHealth Buy-In)

Age 65+ or disabled
General Massachusetts resident, Medicare Part A/B.
Income Limits (2025) ~$2,510/month (QMB), ~$3,380/month (SLMB), ~$3,598/month (QI)—individual.
Asset Limits $9,430 (individual), $14,130 (couple).
MA

Three tiers; no waitlist; includes Extra Help for Part D.

Benefits
Covers Part B premiums ($174.70/month) Deductibles ($240/year) Copays (~20%)

National Family Caregiver Support Program (NFCSP) Respite

Massachusetts NFCSP Respite Care

Age
General Caregivers of 60+ needing care or 55+ caregivers of others; Massachusetts resident; functional needs (2+ ADLs).
Income Limits (2025) Prioritizes ~$24,980/year (individual); no strict cap.
Asset Limits Not assessed; need-based.
MA

27 ASAPs; prioritizes low-income, rural caregivers.

Benefits
Respite (4-6 hours/week or 5 days/year) Adult day care ($60/day) Caregiver training Supplies (~$500/year)

Prescription Advantage

Massachusetts Prescription Advantage

Age 65+ or disabled
General Massachusetts resident, enrolled in Medicare Part D (or ineligible for Medicare).
Income Limits (2025) No strict limit; copays vary by income ~$24,980-$75,000/year individual
Asset Limits Not assessed.
MA

Supplements Medicare Part D; no enrollment fee for low-income.

Benefits
Covers prescription copays ($5-$40/drug) Fills coverage gaps Catastrophic cost protection ($4,000+ covered)

VA Aid and Attendance (A&A) and Housebound Benefits

Massachusetts VA Aid and Attendance/Housebound

Age 65+ or disabled veteran/spouse
General Massachusetts resident, wartime service, need for ADL help (A&A) or homebound.
Income Limits (2025) Net income < ~$1,984/month (veteran with dependent, A&A); pension offsets income.
Asset Limits ~$155,356 net worth limit
MA

High veteran demand statewide.

Benefits
Cash (~$1,433-$2,642/month veteran, ~$951-$1,318 spouse) for care costs (e.g., in-home, assisted living)

Frequently Asked Questions about Southeast Rehabilitation & Skilled Care Center

Is Southeast Rehabilitation & Skilled Care Center in a walkable area?

Southeast Rehabilitation & Skilled Care Center has a walk score of 10. Car-dependent. Most errands require a car, with limited nearby walkable options.

What is the occupancy rate at Southeast Rehabilitation & Skilled Care Center?

Southeast Rehabilitation & Skilled Care Center's occupancy is 87.9%.

What is the best email address for Southeast Rehabilitation & Skilled Care Center?

The team at Southeast Rehabilitation & Skilled Care Center can be reached at [email protected].

Are there photos of Southeast Rehabilitation & Skilled Care Center?

Yes — there are 7 photos of Southeast Rehabilitation & Skilled Care Center in the photo gallery on this page.

What is the address of Southeast Rehabilitation & Skilled Care Center?

Southeast Rehabilitation & Skilled Care Center is located at 184 Lincoln St, North Easton, MA 02356.

What is the phone number of Southeast Rehabilitation & Skilled Care Center?

(508) 238-7053 will put you in contact with the team at Southeast Rehabilitation & Skilled Care Center.

Is Southeast Rehabilitation & Skilled Care Center Medicare or Medicaid certified?

Yes — Southeast Rehabilitation & Skilled Care Center is a CMS-certified provider of Medicare and Medicaid.

Guides for Better Senior Living

Care Cost Calculator: See Prices in Your Area

Nursing Home Data Explorer

Don’t Wait Too Long: 7 Red Flag Signs Your Parent Needs Assisted Living Now

The True Cost of Assisted Living in 2025 – And How Families Are Paying For It

Understanding Senior Living Costs: Pricing Models, Discounts & Financial Assistance