Explore Open Rooms

1 Contact details
2 What type of senior care service are you looking for?
3 What budget do you have in mind for senior care?
4 How soon do you need to find care?
5 Additional details

Thank you for your interest!

Our team will be in touch shortly to help with next steps.

Independent Living Home

Nason Center of Breckenridge Village

Independent Living Home

Nason Center of Breckenridge Village

36851 Ridge Rd, Willoughby, OH 44094 View map
Overview of Nason Center of Breckenridge Village

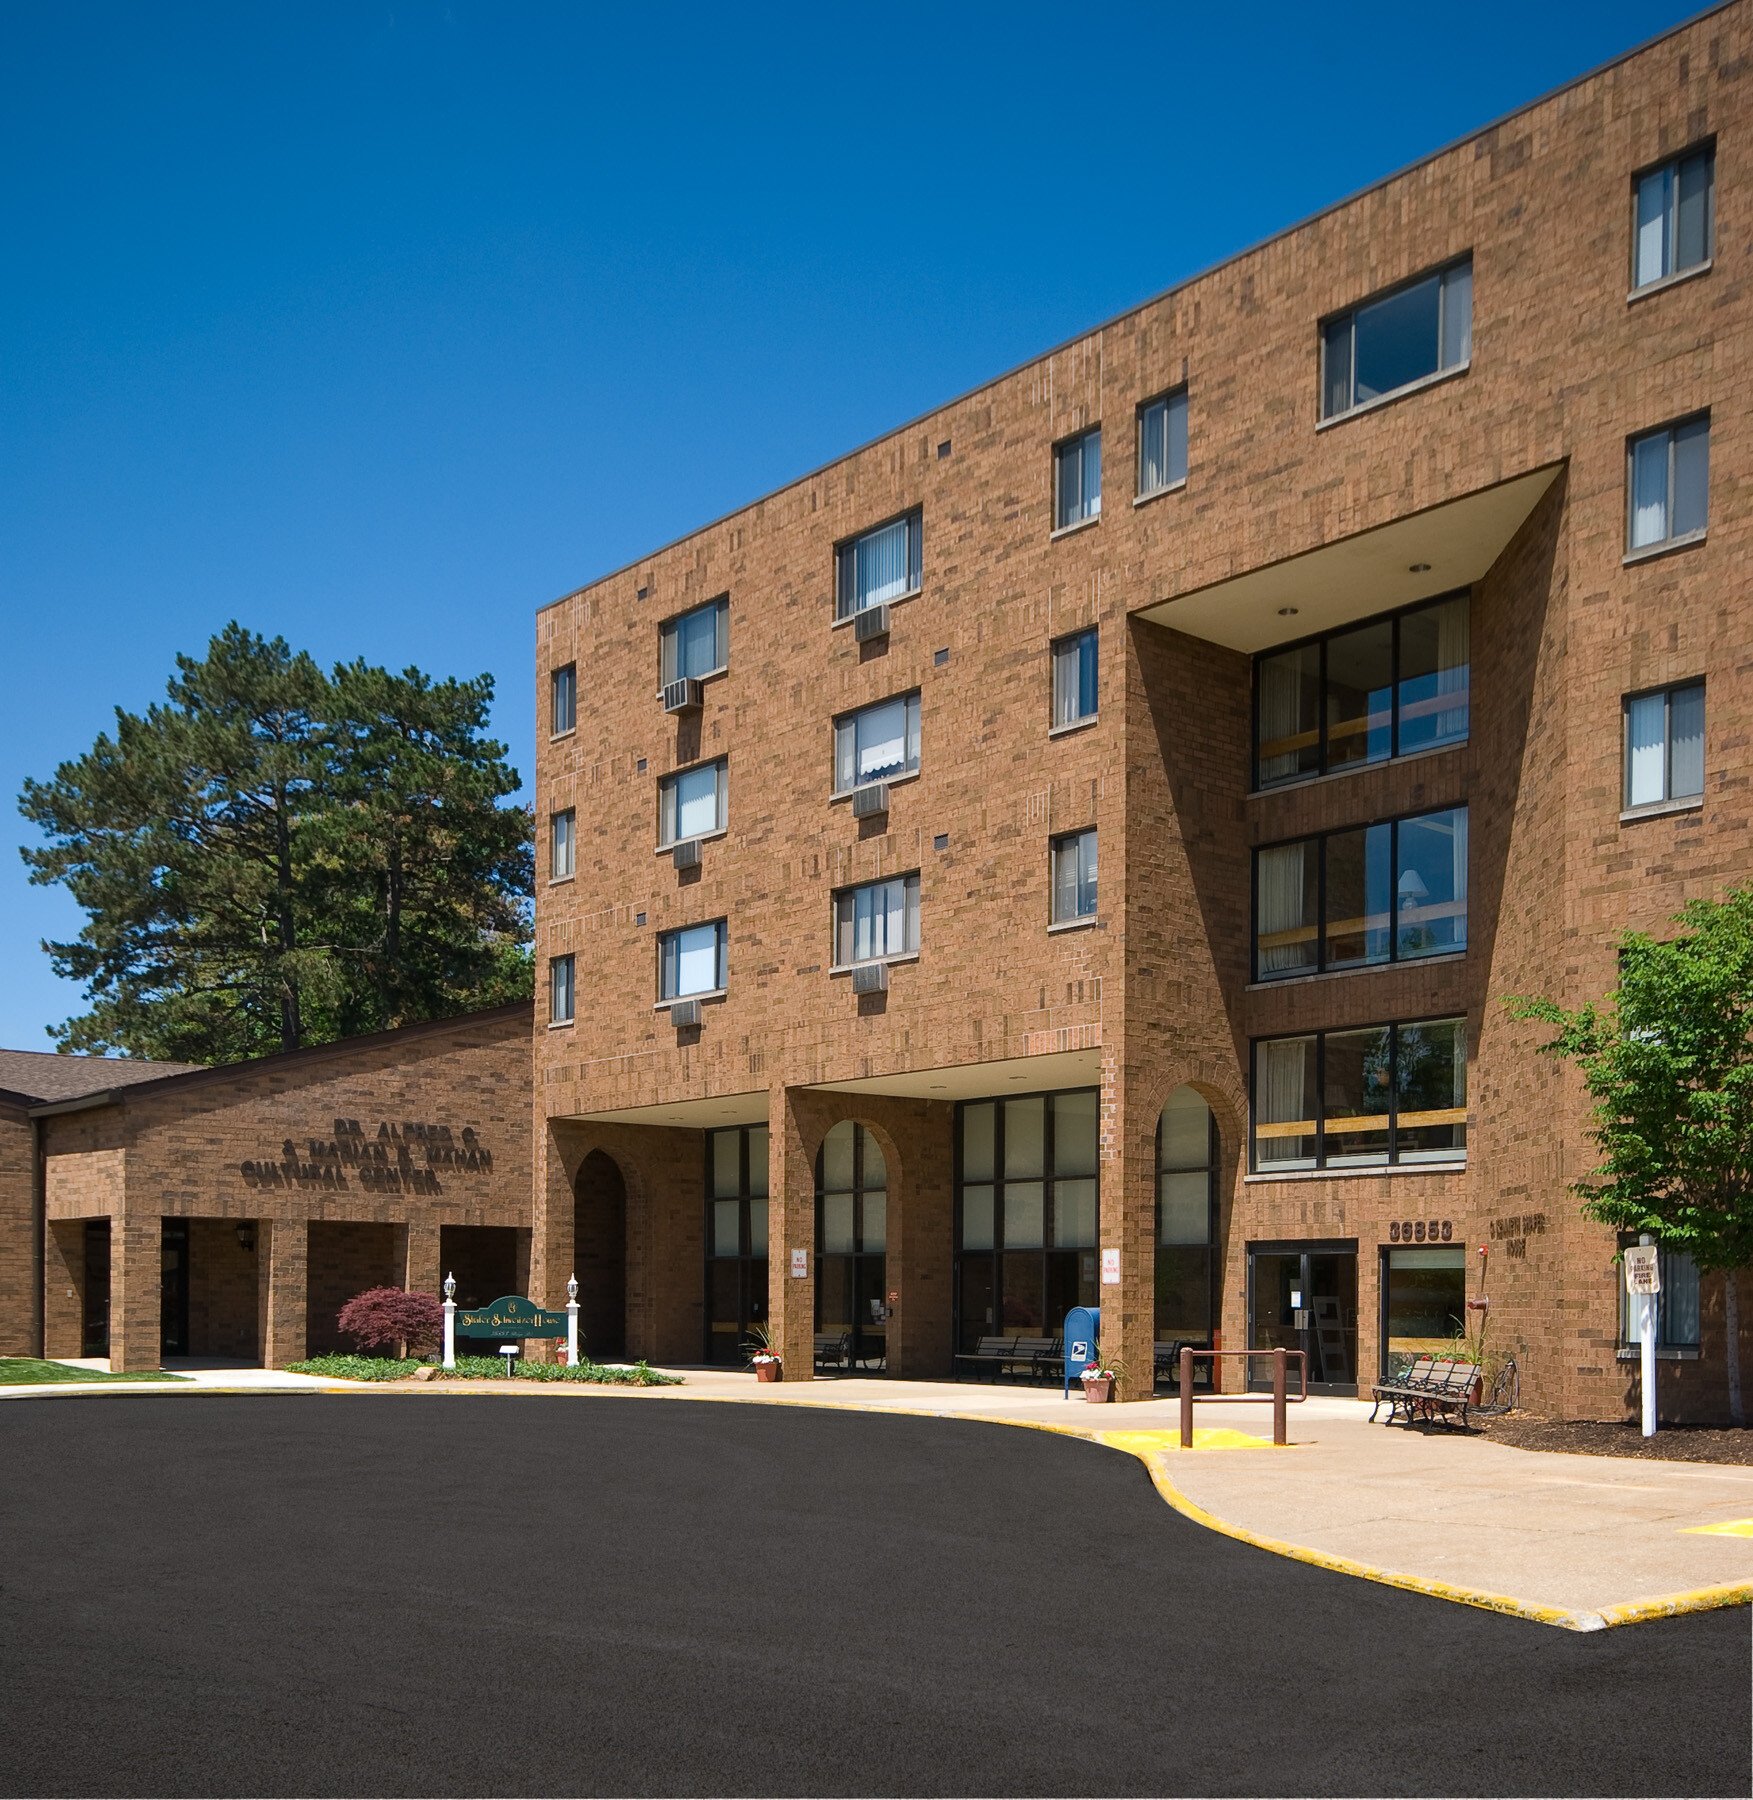
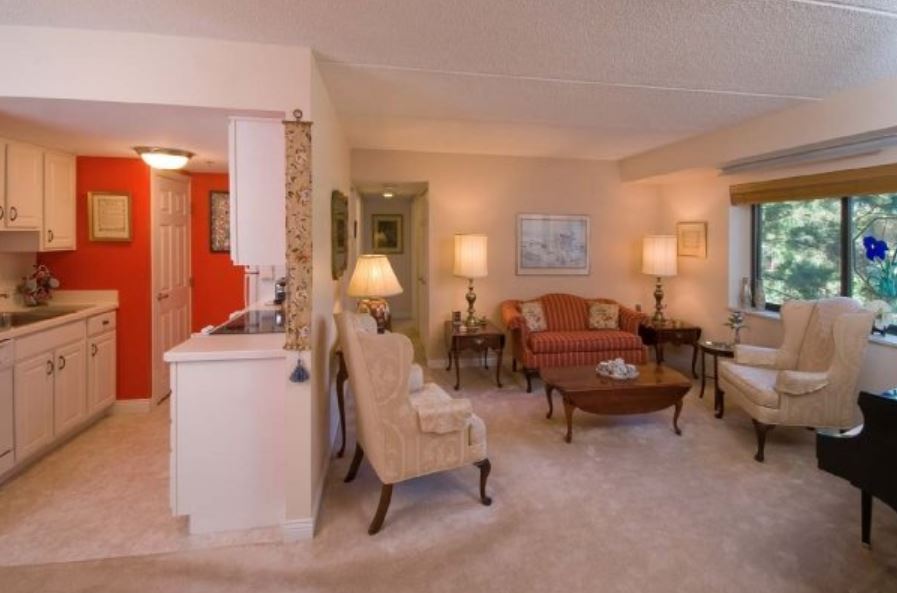
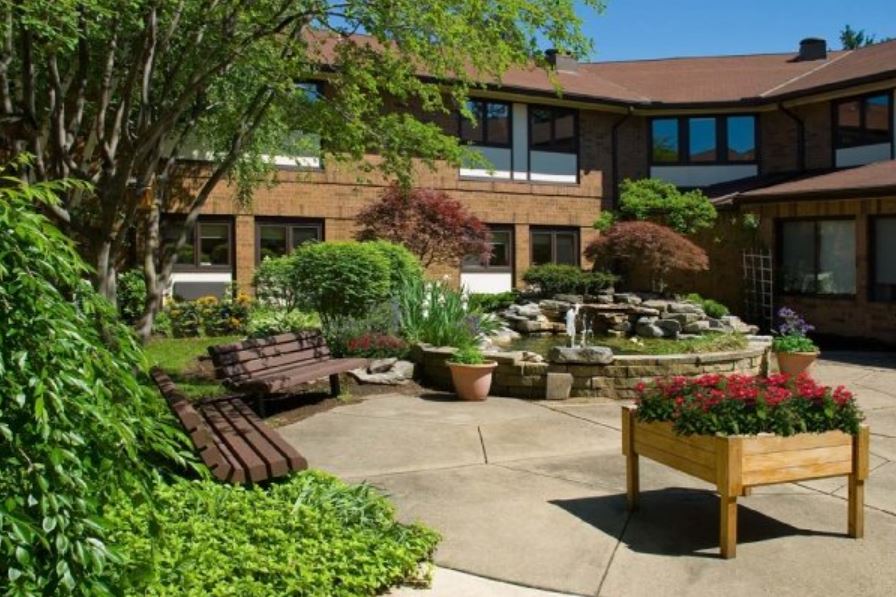
Offering superior senior living options, Nason Center of Breckenridge Village is an excellent assisted living community located within Willoughby, OH. The community provides memory care services and 2 separate living options, including Skyview Studios, suited for residents needing assistance with everyday activities like bathing, dressing, and medicine reminders, and Garden Level Special Care Studios, built for individuals with early memory loss, assuring a secure and pleasant atmosphere.

The community is approved by the Ohio Department of Aging for the Assisted Living Waiver Program and provides a range of amenities in addition to comprehensive care. Residents have access to amenities and activities, including 24-hour personal care assistance, daily nutritious meals, social, recreational and spiritual programming, round-the-clock nursing services, ensuring residents’ independence while addressing their developing requirements.

(440) 942-4342

Quality ratings

Measured by Centers for Medicare & Medicaid Services (CMS)

Overall rating Info The Overall CMS Rating combines results from health inspections, staffing levels and quality measures. Health inspections carry the most weight. Staffing and quality scores can increase or decrease the final rating based on performance compared to state and national standards.
5/5
Ohio average: 3.2/5
Health Inspection Info Based on the results of the facility's three most recent standard inspections and any complaint investigations. CMS reviews the number, scope, and severity of deficiencies, with more recent findings weighted more heavily.
5/5
Ohio average: 2.8/5
Staffing Info Measures average nursing staff hours per resident per day, including Registered Nurses (RNs) and total nursing staff. Ratings are adjusted based on the level of care residents require and are compared to state and national benchmarks.
4/5
Ohio average: 2.4/5
Quality Measures Info Based on clinical and physical health indicators reported to CMS, such as hospital readmissions, falls, pressure ulcers, and improvements in mobility. These measures reflect how well residents' health needs are being managed.
4/5
Ohio average: 4.4/5

Nursing care per resident

Info This shows how many total hours of nursing staff time are available per resident each day. Higher numbers usually mean more staff support.
4h 24m per day

This home provides 24% more nursing time per resident than the Ohio average.

Ohio average: 3h 32m per day

Capacity and availability

Smaller home

May offer a more intimate, personalized care environment.

Total beds 72

This home usually has limited availability

Occupancy is moderate, suggesting balanced demand.

Similar demand to the Ohio average
Occupancy rate 92.5%
Residents per day (avg) 63
Occupancy rate
92.5%
Residents per day (avg)
63

Who this home usually serves

TYPE OF STAY

Mix of rehab and long-term care

This home supports both short-term rehab and long-term care, with residents staying for a wide range of durations.

Breakdown by payment type

Medicare

41% of new residents, usually for short-term rehab.

Typical stay 26 days

Private pay

58% of new residents, often for short stays.

Typical stay 3 - 4 months

Medicaid

1% of new residents, often for long-term daily care.

Typical stay 10 - 11 years

Finances and operations

Voluntary non-profit community
Home revenue
$13.3M
Operating deficit
-$1.7M
Voluntary non-profit community
Home revenue
$13,277,408.00
Operating deficit
$-1,743,426.00
Payroll costs Info The portion of the home's budget spent on staff, including nurses, caregivers, and other employees who support care and operations.
$5.4M
40.8% of revenue
Other operating costs Info All remaining costs needed to run the home, such as food, utilities, building maintenance, supplies and administrative expenses.
$9.3M
Total costs $14.7M
Walk Score
Walk Score: 36 / 100
Somewhat walkable. A few nearby services may be reachable on foot, but most trips require transportation.

About this community

Safety & Compliance

Grab Bars
Emergency Systems: 24-hour emergency, safety and security systems.

Care Services

Nursing Services
Rehabilitation Services
Respite Care
Memory Care
Independent Living
Skilled Nursing
Licensed Nurses/CNAs
24-Hour Staffing
Short-Term Rehab

All Levels of Care

Independent Living
Assisted Living
Memory Care
Rehabilitation & Skilled Care.

Additional Policies & Features

Housekeeping: Yes
Linen Service: Yes
Utilities Included: Yes

Amenities & Lifestyle

Fitness center
library
outdoor spaces
salon/spa services
scheduled transportation
emergency systems
pet-friendly environment
concierge services.

Programs & Activities

Activities
Your calendar can be as full as you like with events, live entertainment, movie nights, and more.
Specific Programs
Independent Living, Assisted Living, Health Services, Home Health & Hospice, Palliative Medicine, Rehabilitation & Skilled Care, Social, recreational and spiritual programming.

Dining & Nutrition

Food Description
Daily nutritious meals and snacks are provided.
Meals Included
Yes

What does this home offer?

Pets allowed icon
Pets allowed icon

Pets Allowed: Yes, Pets Allowed

Housing options icon

Housing Options: Private Rooms

Building type icon
Building type icon

Building Type: 3-story

Transportation services icon

Transportation Services

Fitness and recreation icon

Fitness and Recreation

Types of Care at Nason Center of Breckenridge Village

Assisted Living Memory Care Nursing Home
Contact Nason Center of Breckenridge Village

Health Inspection History

Inspections
Total health inspections 3

Ohio average 6.7


Last Health inspection on May 2025

Total health citations 4

Ohio average 30.9

Citations per inspection
1.33

Ohio average 4.59


Health citations are formal notices following inspections when they fail to comply with safety and care standards.

All 4 citations resulted from standard inspections.

Breakdown of citation severity (last 3 years)
Critical Health citations More info 0
100% better than Ohio average

Ohio average: 0.3


Serious Health citations More info 0
100% better than Ohio average

Ohio average: 0.9

0 critical citations More info Ohio average: 0.3

0 serious citations More info Ohio average: 0.9

3 moderate citations More info Ohio average: 29

1 minor citation More info Ohio average: 0.7
Citations history (last 3 years)
Infection Control moderate citation Info Issues related to preventing and controlling infections, including hygiene practices and safety protocols. May 15, 2025
Corrected

Pharmacy moderate citation Info Issues related to medication management, including how drugs are stored, administered, and monitored. Jun 30, 2022
Corrected

Resident Rights minor citation Info Issues related to resident's rights, including dignity, privacy, and the ability to make decisions about their care. Jun 30, 2022
Corrected

Nutrition moderate citation Info Issues related to food quality, meal service, and resident's nutritional needs. Jun 27, 2019
Corrected

Compare Independent Living around Mentor The information below is reported by the Ohio Department of Health, Bureau of Survey and Certification.

Nason Center of Breckenridge Village
AL

Assisted Living A licensed, long-term care setting for seniors or individuals with disabilities who need help with daily activities — like bathing, dressing, and medication management — but not 24-hour skilled nursing. Offers housing, meals, and around-the-clock support while aiming to maximize resident independence.

MC

Memory Care Secured, specialized care for people living with Alzheimer's or dementia. Staff trained in cognitive impairment, with higher staff-to-resident ratios and an environment designed to reduce confusion and wandering risk.

NH

Nursing Home Licensed facility providing 24/7 skilled nursing care for residents with complex, ongoing medical needs. Staffed by RNs, LPNs, and CNAs. Inspected and star-rated annually by CMS. Accepts Medicare (short-term rehab) and Medicaid (long-term care).

Willoughby
72
-
36
Private Rooms
-
-
-
Governor‘s Port
AL

Assisted Living A licensed, long-term care setting for seniors or individuals with disabilities who need help with daily activities — like bathing, dressing, and medication management — but not 24-hour skilled nursing. Offers housing, meals, and around-the-clock support while aiming to maximize resident independence.

IL

Independent Living Lifestyle-focused communities for older adults offering dining, activities, and transportation with minimal personal care. Best for active, independent seniors who want community without medical support.

Mentor (Bridgeport Colony Condominiums)
-
-
26
Private Rooms
-
-
-
The V Living Experience – Mentor
AL

Assisted Living A licensed, long-term care setting for seniors or individuals with disabilities who need help with daily activities — like bathing, dressing, and medication management — but not 24-hour skilled nursing. Offers housing, meals, and around-the-clock support while aiming to maximize resident independence.

IL

Independent Living Lifestyle-focused communities for older adults offering dining, activities, and transportation with minimal personal care. Best for active, independent seniors who want community without medical support.

Mentor
-
-
0
Private Rooms
-
-
-
VITALIA® Mentor
AL

Assisted Living A licensed, long-term care setting for seniors or individuals with disabilities who need help with daily activities — like bathing, dressing, and medication management — but not 24-hour skilled nursing. Offers housing, meals, and around-the-clock support while aiming to maximize resident independence.

IL

Independent Living Lifestyle-focused communities for older adults offering dining, activities, and transportation with minimal personal care. Best for active, independent seniors who want community without medical support.

MC

Memory Care Secured, specialized care for people living with Alzheimer's or dementia. Staff trained in cognitive impairment, with higher staff-to-resident ratios and an environment designed to reduce confusion and wandering risk.

Mentor
-
-
0
Private Rooms
-
-
-

Places of interest near Nason Center of Breckenridge Village

Address 6.1 miles from city center — 0.59 miles to nearest hospital (UH Lake West Medical Center)

Address 36851 Ridge Rd, Willoughby, OH 44094

Calculate Travel Distance to Nason Center of Breckenridge Village

Add your location

Address

Staffing Data (Q2 2025)

This data corresponds to Q2 2025 and is based on CMS Payroll-Based Journal.

Total staff 157
Employees 82
Contractors 75
Staff to resident ratio 2.62:1
22% better than Ohio average

Ohio average ratio: 2.14:1

Avg staff/day 50
Average shift 7 hours
14% worse than Ohio average

Ohio average: 8.1 hours

Total staff hours (quarter) 32,002
Nursing staff breakdown
Registered Nurse

Manages medical care and health needs.

Total count 8
Average shift length Info Average shift length. Calculated as total hours divided by days worked and average staff per day. 7.5 hours

No contractors work on this role.

Licensed Practical Nurse

Assists with medical care and medications.

Total count 17
Average shift length Info Average shift length. Calculated as total hours divided by days worked and average staff per day. 7.6 hours

No contractors work on this role.

Certified Nursing Assistant

Helps with daily care and mobility.

Total count 98
Average shift length Info Average shift length. Calculated as total hours divided by days worked and average staff per day. 7.1 hours

This role is partially covered by contractors.

Contractor staffing

Total hours from contractors

14.4%

4,620 contractor hours this quarter

Certified Nursing Assistant: 55 Speech Language Pathologist: 4 Physical Therapy Assistant: 4 Respiratory Therapy Technician: 4 Occupational Therapy Assistant: 3 Physical Therapy Aide: 2 Qualified Social Worker: 2 Occupational Therapy Aide: 1
Staff by category
Certified Nursing Assistant43559814,61991100%7.1
Licensed Practical Nurse170176,79491100%7.6
Clinical Nurse Specialist6062,7916470%8
Registered Nurse8082,50591100%7.5
Administrator2029006470%7.9
Other Dietary Services Staff3036567380%7.9
Physical Therapy Aide0226376571%5.3
Respiratory Therapy Technician0446058189%4.3
Physical Therapy Assistant0445547582%6.2
Nurse Practitioner1014806066%8
Speech Language Pathologist0444767481%4.7
Mental Health Service Worker2023786167%6
Qualified Social Worker0222954752%5.9
Occupational Therapy Aide0112523741%6.8
Occupational Therapy Assistant033612325%2.6
98 Certified Nursing Assistant
% of Days 100%
17 Licensed Practical Nurse
% of Days 100%
6 Clinical Nurse Specialist
% of Days 70%
8 Registered Nurse
% of Days 100%
2 Administrator
% of Days 70%
3 Other Dietary Services Staff
% of Days 80%
2 Physical Therapy Aide
% of Days 71%
4 Respiratory Therapy Technician
% of Days 89%
4 Physical Therapy Assistant
% of Days 82%
1 Nurse Practitioner
% of Days 66%
4 Speech Language Pathologist
% of Days 81%
2 Mental Health Service Worker
% of Days 67%
2 Qualified Social Worker
% of Days 52%
1 Occupational Therapy Aide
% of Days 41%
3 Occupational Therapy Assistant
% of Days 25%

Facility Characteristics

Source: CMS Long-Term Care Facility Characteristics (Data as of Jan 2026)

Total census
60 residents
Residents by payment source
Medicare
19 residents (31.7%)
Medicaid
14 residents (23.3%)
Private pay or other
27 residents (45%)
Programs & Services
Residents' Group

Residents meet regularly to discuss policies, care quality, and activities

Nurse Aide Training

State-approved Nurse Aide Training and Competency Evaluation Program on-site

CCRC

Part of a Continuing Care Retirement Community offering multiple care levels

Active Resident Council

Organized group of residents that meets regularly to discuss facility policies, quality of life, and activities.

Quality of care over time

These measures show how residents usually do over time at this home, based on health outcomes and preventive care.

High-risk clinical events score Info A composite score based on pressure ulcers, falls with injury, weight loss, walking ability decline, and activities of daily living decline. 13.9
139% worse than Ohio average

Ohio average: 5.8

Functional decline score Info A composite score based on activities of daily living decline, walking ability decline, and incontinence. 28.6
125% worse than Ohio average

Ohio average: 12.7

Long-stay resident measures
Need for Help with Daily Activities Increased Info Percent of long-stay residents whose need for help with daily activities has increased 9.5%
39% worse than Ohio average

Ohio average: 6.8%

Walking Ability Worsened Info Percent of long-stay residents whose ability to move independently worsened 42.0%
372% worse than Ohio average

Ohio average: 8.9%

Low Risk Residents with Bowel/Bladder Incontinence Info Percent of low risk long-stay residents who lose control of their bowels or bladder 34.2%
56% worse than Ohio average

Ohio average: 22.0%

Falls with Major Injury Info Percent of long-stay residents experiencing one or more falls with major injury 2.6%
23% better than Ohio average

Ohio average: 3.4%

High Risk Residents with Pressure Ulcers Info Percent of long-stay high risk residents with pressure ulcers 4.2%
8% worse than Ohio average

Ohio average: 3.9%

Urinary Tract Infection Info Percent of long-stay residents with a urinary tract infection 0.5%
In line with Ohio average

Ohio average: 0.5%

Lost Too Much Weight Info Percent of long-stay residents who lose too much weight 11.2%
81% worse than Ohio average

Ohio average: 6.2%

Depressive Symptoms Info Percent of long-stay residents who have depressive symptoms 3.6%
85% better than Ohio average

Ohio average: 24.0%

Antipsychotic Use Info Percent of long-stay residents who received an antipsychotic medication 9.6%
14% worse than Ohio average

Ohio average: 8.4%

Pneumococcal Vaccine Info Percent of long-stay residents assessed and appropriately given the pneumococcal vaccine 96.3%
In line with Ohio average

Ohio average: 92.4%

Influenza Vaccine Info Percent of long-stay residents assessed and appropriately given the seasonal influenza vaccine 49.0%
48% worse than Ohio average

Ohio average: 94.5%

Short-stay resident measures
Pneumococcal Vaccine Info Percent of short-stay residents assessed and appropriately given the pneumococcal vaccine 68.0%
13% worse than Ohio average

Ohio average: 78.0%

Antipsychotic medication increase Info Percent of short-stay residents who newly received an antipsychotic medication 0.3%
78% better than Ohio average

Ohio average: 1.3%

Influenza Vaccine Info Percent of short-stay residents assessed and appropriately given the seasonal influenza vaccine 73.3%
In line with Ohio average

Ohio average: 75.6%

Guides for Better Senior Living

Care Cost Calculator: See Prices in Your Area

Nursing Home Data Explorer

Don’t Wait Too Long: 7 Red Flag Signs Your Parent Needs Assisted Living Now

The True Cost of Assisted Living in 2025 – And How Families Are Paying For It

Understanding Senior Living Costs: Pricing Models, Discounts & Financial Assistance

Financial Aid for Ohio Seniors

Get financial aid guidance

PASSPORT Waiver

Ohio Medicaid PASSPORT

Age 60+, Ohio resident, Medicaid-eligible, nursing home-level care need.

~$2,829/month (300% FBR, individual).

$2,000 (individual), $3,000 (couple).

Administered through regional agencies; waitlists possible.

Ohio Home Care Program (non-Medicaid)

OH HCP

Age 60+, Ohio resident, at risk of decline.

~$2,000/month (individual, varies).

$5,000 (individual).

Limited funding; regional variation.

Assisted Living Waiver (ALW)

Ohio Assisted Living Waiver

Age 21+ (65+ prioritized), OH resident, Medicaid-eligible, NFLOC.

~$2,829/month (individual); QIT required.

$2,000 (individual), $3,000 (couple).

Covers ~300 facilities; room/board not included (separate cost).

Program of All-Inclusive Care for the Elderly (PACE)

Ohio PACE (e.g., McGregor PACE)

Age 55+, OH resident (specific counties), NFLOC, safe with PACE support.

~$2,829/month (Medicaid-eligible); private pay option available.

$2,000 (individual), $3,000 (couple) for Medicaid enrollees.

Available in 9 counties (e.g., Cuyahoga, Franklin); expanding via Healthy Aging Grants.

Medicare Savings Program (MSP)

Ohio Medicare Savings Program

Age 65+ or disabled, OH resident, Medicare Part A/B.

~$2,510/month (QMB), ~$3,380/month (SLMB), ~$3,598/month (QI)—individual.

$9,430 (individual), $14,130 (couple).

Three tiers; includes Extra Help for Part D; no waitlist.

Home Energy Assistance Program (HEAP)

Ohio HEAP

Age 60+ prioritized, OH resident, low-income household.

~$3,970/month (individual, 185% FPL).

Not assessed; income-focused.

Covers gas, electric, oil; emergency aid via Winter/Summer Crisis Programs.

Family Caregiver Support Program (FCSP)

Ohio Family Caregiver Support Program

Caregivers of 60+ needing care or 55+ caregivers of others; OH resident; functional needs (2+ ADLs).

Prioritizes ~$24,980/year (individual); no strict cap.

Not assessed; need-based.

12 AAAs; rural/low-income priority; volunteer respite option.

Senior Community Service Employment Program (SCSEP)

Ohio SCSEP

Age 55+, unemployed, low-income, OH resident.

~$1,983/month (125% FPL).

Not specified; income-focused.

Priority for veterans, rural residents; AARP partnership.

VA Aid and Attendance (A&A) and Housebound Benefits

Ohio VA Aid and Attendance/Housebound

Age 65+ or disabled veteran/spouse, OH resident, wartime service, need for ADL help (A&A) or homebound.

Net income < ~$1,984/month (veteran with dependent, A&A); pension offsets income.

~$155,356 (net worth limit).

High veteran demand; supports care in multiple settings.

Homestead Exemption

Ohio Homestead Exemption

Age 65+ (or disabled), OH resident, homeowner, low-income.

~$38,500/year (individual, adjusted annually).

Not assessed; home ownership required.

Reduces taxable value by $25,000; applies to primary residence.

Save the Dream Ohio (Homeowner Assistance Fund)

Ohio Save the Dream

Age 60+ prioritized, OH resident, homeowner, hardship post-Jan 21, 2020.

~$147,600/year (family of 4, 150% AMI; varies by county).

Not assessed; hardship-focused.

Covers delinquent mortgages, utilities, taxes; max $25,000 mortgage aid.