


Total staff
183
Employees
78
Contractors
105
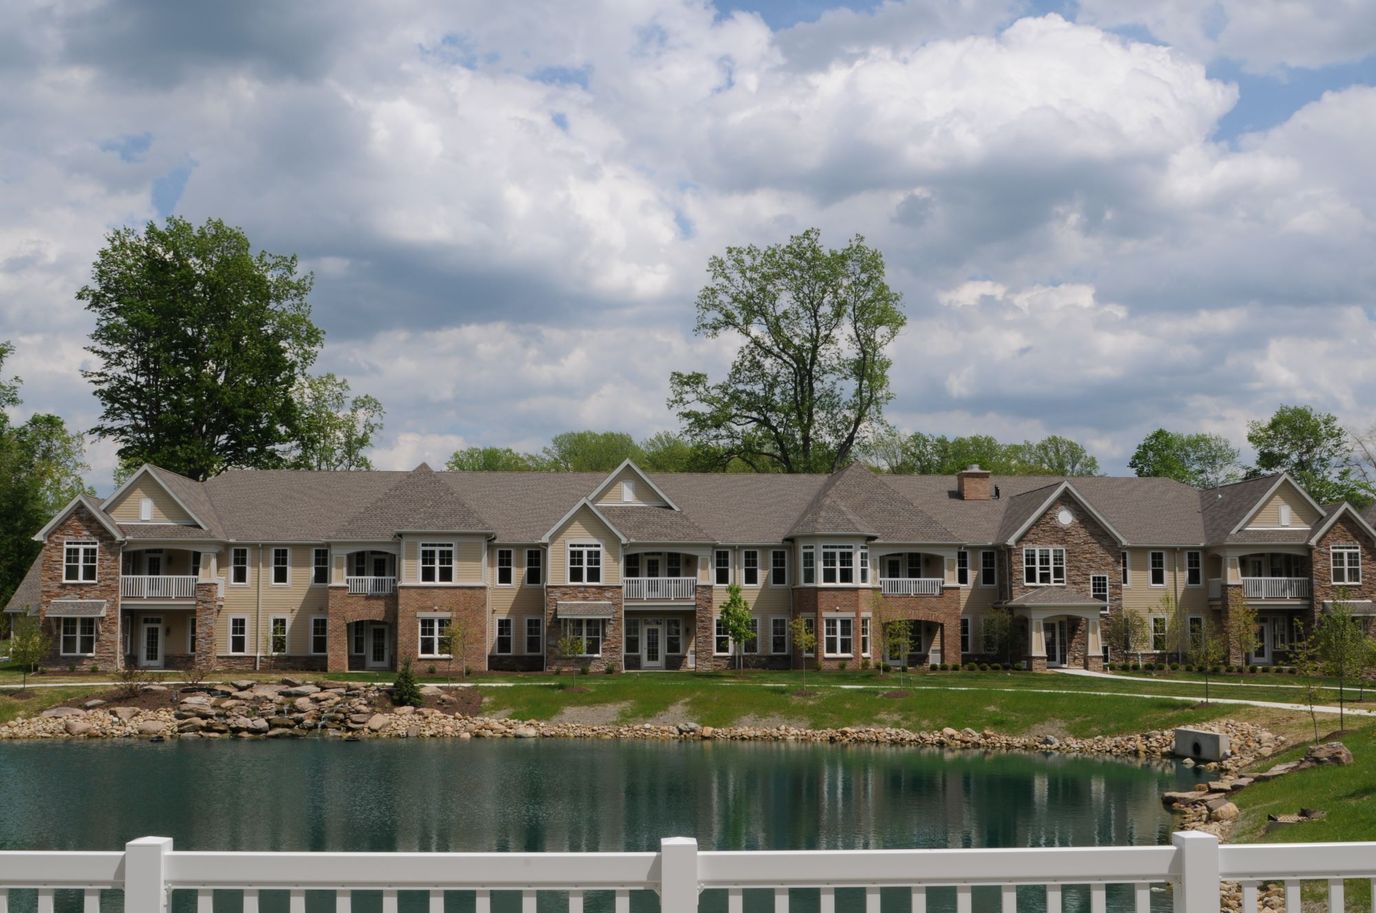
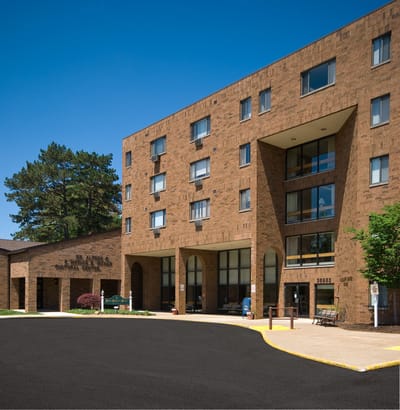
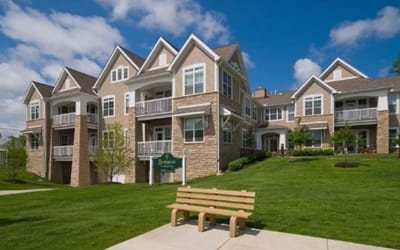
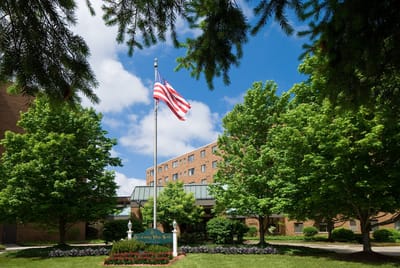
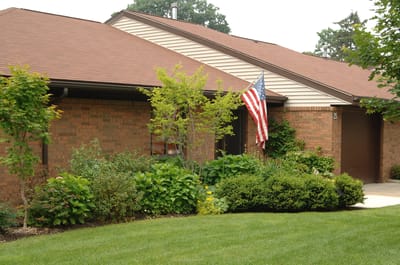


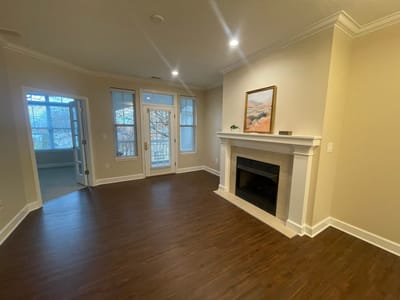

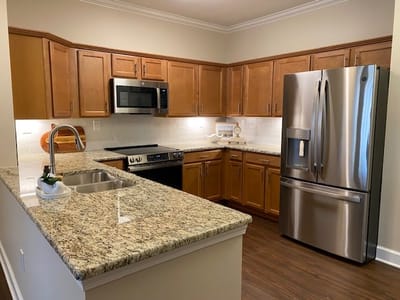
Seventy-two beds, three stories, and four distinct care types under one name: Nason Center of Breckenridge Village covers nursing home, skilled nursing, independent living, and assisted living with memory care, all in Willoughby, Ohio’s Deer Creek neighborhood. Private rooms make up the core housing, with dedicated memory care studios set aside for residents dealing with early memory loss. A Walk Score of 36 puts the surroundings in somewhat walkable range, though most errands still mean a car ride.
Clinical care here runs deeper than a typical nursing home. Short-term rehabilitation and respite care sit alongside home health, hospice, and palliative medicine, all backed by 24-hour staffing. Nursing hours break down by role: registered nurses, licensed nurses, and nurse aides each contribute, with nurse aides logging the most direct time, roughly two and a half hours per resident every day. That figure tends to matter most to families, since it reflects the staff residents actually interact with.
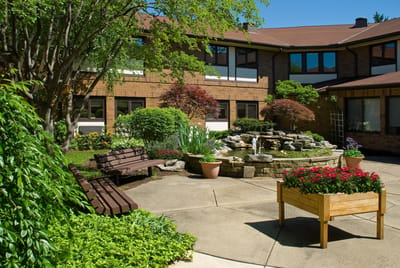
Outside of clinical care, residents have access to a fitness center, a library, and outdoor spaces, with emergency call systems built into daily life for added safety. Events, live entertainment, and movie nights fill out the activities calendar, and the community welcomes pets.
Occupancy sits at 92.5%, a number that points to steady demand. Medicare, Medicaid, and private pay are all accepted, covering a wide range of financial situations. Kara Hanzie owns the property.
Between the range of care types, the depth of clinical services extending into hospice and palliative care, and strong occupancy, Nason Center of Breckenridge Village reads as a full-spectrum campus built for residents and families planning for care needs that may change significantly over time.
| Staff type | Hours / Day / Resident | vs state avg |
|---|---|---|
|
Registered Nurse (RN)
| 51m per day | ▲ 33% State avg: 38m per day · National avg: 41m per day |
|
LPN / LVN
| 1h 15m per day | ▲ 30% State avg: 58m per day · National avg: 52m per day |
|
Nurse Aide
| 2h 33m per day | ▲ 20% State avg: 2h 7m per day · National avg: 2h 20m per day |
|
Weekend Total Nursing
| 4h 17m per day | ▲ 29% State avg: 3h 20m per day · National avg: 3h 27m per day |
|
Physical Therapist
| 6m per day | ▲ 77% State avg: 3m per day · National avg: 4m per day |
|
Weekend RN
| 31m per day | ▲ 22% State avg: 25m per day · National avg: 29m per day |
Reporting period: October 1 – December 31, 2025 (Q4 2025). Source: CMS Payroll-Based Journal report.
Manages medical care and health needs.
Assists with medical care and medications.
Helps with daily care and mobility.
Total hours from contractors
6,825 contractor hours this quarter
| Certified Nursing Assistant | 36 | 82 | 118 | 14,786 | 92 | 100% | 7.3 |
| Licensed Practical Nurse | 20 | 0 | 20 | 7,270 | 92 | 100% | 7.6 |
| Registered Nurse | 11 | 0 | 11 | 2,877 | 92 | 100% | 7.6 |
| Clinical Nurse Specialist | 4 | 0 | 4 | 1,541 | 70 | 76% | 7.9 |
| Physical Therapy Aide | 0 | 3 | 3 | 743 | 64 | 70% | 6.2 |
| Speech Language Pathologist | 0 | 4 | 4 | 582 | 76 | 83% | 5.9 |
| Respiratory Therapy Technician | 0 | 5 | 5 | 549 | 75 | 82% | 4.2 |
| Mental Health Service Worker | 2 | 0 | 2 | 540 | 61 | 66% | 6 |
| Physical Therapy Assistant | 0 | 3 | 3 | 504 | 70 | 76% | 6 |
| Nurse Practitioner | 1 | 0 | 1 | 480 | 60 | 65% | 8 |
| Administrator | 1 | 0 | 1 | 440 | 55 | 60% | 8 |
| Other Dietary Services Staff | 1 | 0 | 1 | 363 | 47 | 51% | 7.7 |
| Occupational Therapy Aide | 0 | 3 | 3 | 256 | 36 | 39% | 6.9 |
| Qualified Social Worker | 0 | 2 | 2 | 227 | 44 | 48% | 5.1 |
| Dietitian | 1 | 0 | 1 | 124 | 62 | 67% | 2 |
| Occupational Therapy Assistant | 0 | 2 | 2 | 60 | 22 | 24% | 2.6 |
| Medical Director | 0 | 1 | 1 | 41 | 13 | 14% | 3.2 |
| Nurse Aide in Training | 1 | 0 | 1 | 21 | 5 | 5% | 4.2 |
Federal penalties imposed by CMS for regulatory violations, including civil money penalties (fines) and denials of payment for new Medicare/Medicaid admissions.
Source: CMS Penalties Database
No penalties in the past 3 years
No civil money penalties or payment denials were reported in the last 3 years.
These measures show how residents usually do over time at this home, based on health outcomes and preventive care.
Ohio average: 5.8
Ohio average: 12.7
Ohio average: 6.8%
Ohio average: 8.9%
Ohio average: 22.0%
Ohio average: 3.4%
Ohio average: 3.9%
Ohio average: 0.5%
Ohio average: 6.2%
Ohio average: 24.0%
Ohio average: 8.4%
Ohio average: 92.4%
Ohio average: 94.5%
Ohio average: 78.0%
Ohio average: 1.3%
Ohio average: 75.6%
Quality measures are calculated from Minimum Data Set (MDS) assessments. For most measures, lower percentages indicate better care quality.
41% of new residents, usually for short-term rehab.
58% of new residents, often for short stays.
1% of new residents, often for long-term daily care.
Source: CMS Long-Term Care Facility Characteristics (Data as of Jan 2026)
Residents meet regularly to discuss policies, care quality, and activities
State-approved Nurse Aide Training and Competency Evaluation Program on-site
Part of a Continuing Care Retirement Community offering multiple care levels
Organized group of residents that meets regularly to discuss facility policies, quality of life, and activities.
Data sourced from CMS Long-Term Care Facility Characteristics quarterly report. Payer mix reflects the current resident census by primary payment source.
Historical financial and operational data for Nason Center of Breckenridge Village from 2012–2024, based on CMS SNF Cost Reports.
Key figures below are for fiscal year ending in 06/2024.
Based on CMS SNF Cost Report for fiscal year ending in 06/2024.
Pets Allowed
Housing Options: Private Rooms
Building Type: 3-story
Transportation Services
Fitness and Recreation
This home supports both short-term rehab and long-term care, with residents staying for a wide range of durations.
Most new residents arrive under private pay (58% of admissions), and a typical private pay stay runs around 3 - 4 months.
Coverage residents most often arrive under.
Coverage residents most often leave under.
![]() 1.6 miles from city center
1.6 miles from city center
![]() Estimated distance in miles from Willoughby's city center to Nason Center of Breckenridge Village's address, calculated via Google Maps.
— 0.59 miles to nearest hospital (UH Lake West Medical Center)
Estimated distance in miles from Willoughby's city center to Nason Center of Breckenridge Village's address, calculated via Google Maps.
— 0.59 miles to nearest hospital (UH Lake West Medical Center)
Add your location
Nason Center of Breckenridge Village is located in Willoughby, Ohio.
Here are the financial assistance programs available to residents in Ohio.
Nason Center of Breckenridge Village is in the Deer Creek neighborhood.
Nason Center of Breckenridge Village has a walk score of 36. Somewhat walkable. A few nearby services may be reachable on foot, but most trips require transportation.
Nason Center of Breckenridge Village's occupancy is 92.5%.
Nason Center of Breckenridge Village is registered as a non-profit.
Yes — there are 11 photos of Nason Center of Breckenridge Village in the photo gallery on this page.
Nason Center of Breckenridge Village is located at 36851 Ridge Rd, Willoughby, OH 44094.
(440) 942-4342 will put you in contact with the team at Nason Center of Breckenridge Village.
Care Cost Calculator: See Prices in Your Area
Nursing Home Data Explorer
Don’t Wait Too Long: 7 Red Flag Signs Your Parent Needs Assisted Living Now
The True Cost of Assisted Living in 2025 – And How Families Are Paying For It
Understanding Senior Living Costs: Pricing Models, Discounts & Financial Assistance


