Colonial Residence at Stillwaters
Nursing Home & Independent Living · Centralia, WA
CMS overall rating Info CMS (the Centers for Medicare & Medicaid Services) is the federal agency that rates nursing home quality. Its Overall Rating runs from 1 to 5 stars, combining health inspections, staffing, and quality measures, with inspections weighted most heavily.

Colonial Residence at Stillwaters

Nursing Home & Independent Living · Centralia, WA
CMS overall rating Info CMS (the Centers for Medicare & Medicaid Services) is the federal agency that rates nursing home quality. Its Overall Rating runs from 1 to 5 stars, combining health inspections, staffing, and quality measures, with inspections weighted most heavily.
Calculator: See prices in your area
Colonial Residence at Stillwaters accepts Medicare, Medicaid, and private pay.

Overview of Colonial Residence at Stillwaters

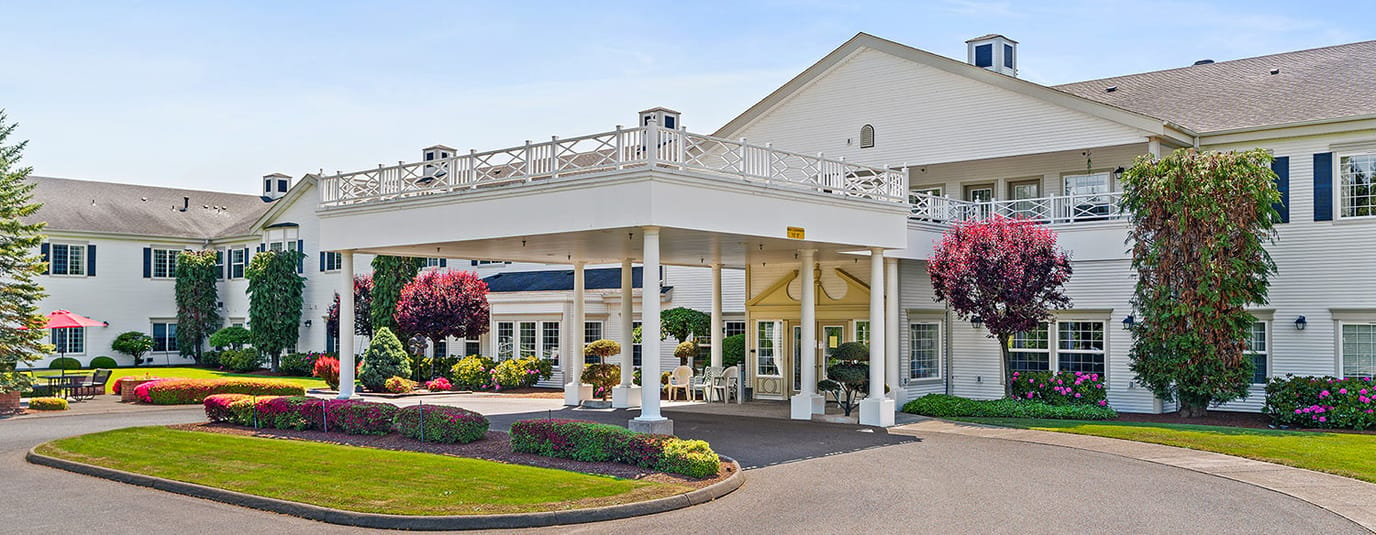
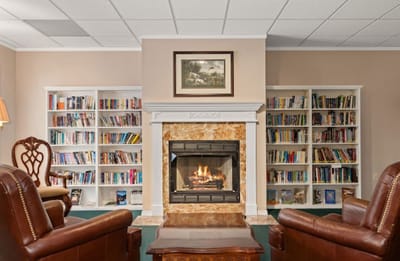
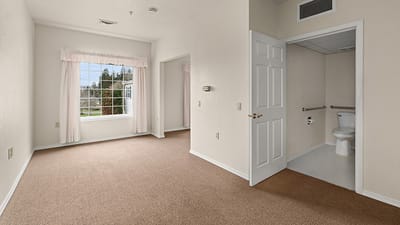
Considerably one of the most affordable independent living homes in Centralia, Colonial Residence at Stillwater strives to positively impact each resident’s life. It boasts a professional care staff ready to attend to an individual’s needs in a cozy, apartment-style setting.

Colonial Residence encourages its residents to take part in enriching and engaging activities that cultivate their personal growth during their golden years. Residents can immerse in various services, such as activities, programs, and delicious home-cooked meals.

Quality ratings

Measured by Centers for Medicare & Medicaid Services (CMS)

Overall rating Info The Overall CMS Rating combines results from health inspections, staffing levels and quality measures. Health inspections carry the most weight. Staffing and quality scores can increase or decrease the final rating based on performance compared to state and national standards.
Health Inspection Info Based on the results of the facility's three most recent standard inspections and any complaint investigations. CMS reviews the number, scope, and severity of deficiencies, with more recent findings weighted more heavily.
Staffing Info Measures average nursing staff hours per resident per day, including Registered Nurses (RNs) and total nursing staff. Ratings are adjusted based on the level of care residents require and are compared to state and national benchmarks.
Quality Measures Info Based on clinical and physical health indicators reported to CMS, such as hospital readmissions, falls, pressure ulcers, and improvements in mobility. These measures reflect how well residents' health needs are being managed.

Staffing hours breakdown

Info Daily nursing hours per resident by staff type, reported to CMS. Higher is generally better — compare this facility to state and national averages to see where staffing stands.

Hours per resident per day — compared to state averages

Total nursing care / resident Info Total adjusted nursing hours per resident per day, combining RN, LPN, and aide time. CMS adjusts this for case-mix so facilities can be fairly compared.
3h 38m per day
Rank #70 / 90Nurse hours — State benchmarkedThis home is ranked 70th out of 90 homes in Washington. Shows adjusted nurse hours per resident per day benchmarked to the Washington average, with a ranking across 90 Washington facilities. More hours mean more direct care. The national average is about 3.5 hrs; below 3.0 is a red flag.Rankings are based only on facilities in Washington that report data for that category. Facilities without available data are excluded from the ranking.Click the rank badge to see the full State ranking.Click here to see the full State ranking.
vs avg
Staff typeHours / Day / Residentvs state avg
Registered Nurse (RN) Info RNs hold the highest nursing license and can assess residents, interpret test results, and direct care plans. More RN hours per day often signals stronger clinical oversight and faster response to health changes. 30m per day
LPN / LVN Info Licensed Practical Nurses (LPNs) or Licensed Vocational Nurses (LVNs) deliver routine hands-on care — medication administration, wound dressing, and monitoring vital signs. They work under RN supervision and make up a large share of daily bedside care. 51m per day
Nurse Aide Info Certified Nurse Aides (CNAs) provide the most direct day-to-day assistance: bathing, dressing, feeding, and mobility. Nurse aide hours are typically the largest staffing category and directly affect residents' quality of life. 2h 23m per day
Weekend Total Nursing Info Combined nursing hours (RN + LPN + Nurse Aide) per resident per day on weekends. Staffing often drops on weekends — this figure reveals whether the facility maintains adequate coverage outside of weekday hours. 3h 35m per day
Physical Therapist Info Hours per resident per day provided by licensed Physical Therapists (PTs) or PT Assistants. PT services help residents recover mobility after injury or illness and are especially important for post-acute (short-stay) rehabilitation. 2m per day
Weekend RN Info Registered nurse hours specifically on weekends. Facilities sometimes reduce RN presence on Saturdays and Sundays — a low weekend RN figure compared to weekday hours can indicate reduced clinical oversight when most administrative staff are absent. 24m per day

Capacity and availability

This home usually has availability

Lower occupancy than the state average
Occupancy rate
66.3% Rank #224 / 310Occupancy rate — State benchmarkedThis home is ranked 224th out of 310 homes in Washington. Shows this facility's occupancy rate versus the Washington average, with its Statewide rank out of 310. Higher occupancy signals strong local demand and financial stability.Rankings are based only on facilities in Washington that report data for that category. Facilities without available data are excluded from the ranking.Click the rank badge to see the full State ranking.Click here to see the full State ranking.
Avg. Length of Stay
82 days
Bed community size
111-bed community Rank #68 / 366Bed count — State benchmarkedThis home is ranked 68th out of 366 homes in Washington. Shows this facility's certified or reported bed count compared to other Washington facilities. Larger communities may offer more amenities, programs, and on-site services for residents and families.Rankings are based only on facilities in Washington that report data for that category. Facilities without available data are excluded from the ranking.Click the rank badge to see the full State ranking.Click here to see the full State ranking.
A larger shared setting that may offer more common spaces and organized community services.
Walk Score
Walk Score: 2 / 100 Rank #616 / 628Walk Score — State benchmarkedThis home is ranked 616th out of 628 homes in Washington. Shows how walkable this facility's neighborhood is compared to the average Walk Score across Washington facilities. Higher scores benefit residents, families, and staff.Rankings are based only on facilities in Washington that report data for that category. Facilities without available data are excluded from the ranking.Click the rank badge to see the full State ranking.Click here to see the full State ranking.
Car-dependent. Most errands require a car, with limited nearby walkable options.

Contact Colonial Residence at Stillwaters

Staffing Data

Reporting period: October 1 – December 31, 2025 (Q4 2025). Source: CMS Payroll-Based Journal report.

Total staff 101
Employees 97
Contractors 4
Staff to resident ratio 1.40 : 1
0% compared with State average

State average ratio: 0 : 0

Avg staff/day 36
Average shift 7.5 hours
0% compared with State average

State average: 0 hours

Total staff hours (quarter) 24,842

Nursing staff breakdown

Q4 2025 · Oct 1 – Dec 31 More info This data comes from the CMS Payroll-Based Journal report covering October 1 – December 31, 2025.
Registered Nurse

Manages medical care and health needs.

RN Staff Info All 11 RN Staff are full-time employees. No contractors work on this role. 11
Average shift length Info Average shift length. Calculated as total hours divided by days worked and average staff per day. 7.8 hours
Licensed Practical Nurse

Assists with medical care and medications.

LPN Staff Info All 11 LPN Staff are full-time employees. No contractors work on this role. 11
Average shift length Info Average shift length. Calculated as total hours divided by days worked and average staff per day. 8.6 hours
Certified Nursing Assistant

Helps with daily care and mobility.

CNA Staff Info All 48 CNA Staff are full-time employees. No contractors work on this role. 48
Average shift length Info Average shift length. Calculated as total hours divided by days worked and average staff per day. 7.8 hours

Contractor staffing

Q4 2025 · Oct 1 – Dec 31 More info This data comes from the CMS Payroll-Based Journal report covering October 1 – December 31, 2025.

Total hours from contractors

0.5%

119 contractor hours this quarter

Occupational Therapy Assistant: 2 Medical Director: 1 RN Director of Nursing: 1

Staff by category

Q4 2025 · Oct 1 – Dec 31 More info This data comes from the CMS Payroll-Based Journal report covering October 1 – December 31, 2025.
Certified Nursing Assistant4804813,51092100%7.8
Licensed Practical Nurse110114,80892100%8.6
Registered Nurse110112,01792100%7.8
Speech Language Pathologist3036107278%7.2
Physical Therapy Assistant2025656368%5.9
Administrator2025515762%7.3
Nurse Practitioner1015416874%8
Other Social Services Staff2025107076%7.1
Qualified Social Worker3035066773%6
Clinical Nurse Specialist1013133942%8
Other Dietary Services Staff1012766065%4.6
Mental Health Service Worker3031943134%6.3
Respiratory Therapy Technician4041666571%2.3
Physical Therapy Aide4041513942%3.9
Occupational Therapy Assistant022703437%2
Medical Director011451213%3.8
Medication Aide/Technician101811%7.6
RN Director of Nursing011411%4
48 Certified Nursing Assistant
% of Days 100%
11 Licensed Practical Nurse
% of Days 100%
11 Registered Nurse
% of Days 100%
3 Speech Language Pathologist
% of Days 78%
2 Physical Therapy Assistant
% of Days 68%
2 Administrator
% of Days 62%
1 Nurse Practitioner
% of Days 74%
2 Other Social Services Staff
% of Days 76%
3 Qualified Social Worker
% of Days 73%
1 Clinical Nurse Specialist
% of Days 42%
1 Other Dietary Services Staff
% of Days 65%
3 Mental Health Service Worker
% of Days 34%
4 Respiratory Therapy Technician
% of Days 71%
4 Physical Therapy Aide
% of Days 42%
2 Occupational Therapy Assistant
% of Days 37%
1 Medical Director
% of Days 13%
1 Medication Aide/Technician
% of Days 1%
1 RN Director of Nursing
% of Days 1%

Penalties and fines

Includes penalties issued in 2023-2024

Federal penalties imposed by CMS for regulatory violations, including civil money penalties (fines) and denials of payment for new Medicare/Medicaid admissions.

Source: CMS Penalties Database (Data as of Jan 2026)

Total fines amount $163K Rank #80 / 92Federal fines — State benchmarkedThis home is ranked 80th out of 92 homes in Washington. Shows this facility's cumulative CMS federal fine dollars versus the Washington average among facilities with fines, and where it ranks among 92 facilities in the pool. Lower total dollars mean a better rank.Rankings are based only on facilities in Washington that report data for that category. Facilities without available data are excluded from the ranking.Click the rank badge to see the full State ranking.Click here to see the full State ranking.
100% higher than State average

State average: $82K

Number of fines 3
62% more fines than State average

State average: 1.8

Payment Denials Info Serious action where Medicare and/or Medicaid temporarily stops payments for new residents until issues are fixed. 1
261% more payment denials than State average

State average: 0.3

Fines amount comparison
This facility $163K
State average $82K
Penalty History

Penalties are imposed by CMS for violations of federal nursing home regulations.

4 penalties in the past 3 years

Multiple penalties were reported in the last 3 years.

Civil Money Penalty Info Fines imposed for noncompliance, which can be assessed per day or per instance of violation. Oct 30, 2024
$38K
Payment Denial Info Serious action where Medicare and/or Medicaid temporarily stops payments for new residents until issues are fixed. Oct 30, 2024
34 days
Civil Money Penalty Info Fines imposed for noncompliance, which can be assessed per day or per instance of violation. Mar 18, 2024
$45K
Civil Money Penalty Info Fines imposed for noncompliance, which can be assessed per day or per instance of violation. Oct 18, 2023
$81K

Last updated: Jan 2026

Quality of care over time

These measures show how residents usually do over time at this home, based on health outcomes and preventive care.

High-risk clinical events score Info A composite score based on pressure ulcers, falls with injury, weight loss, walking ability decline, and activities of daily living decline. 9.0
11% better than State average

State average: 10.0

Functional decline score Info A composite score based on activities of daily living decline, walking ability decline, and incontinence. 21.7
In line with State average

State average: 20.9

Long-stay resident measures
Need for Help with Daily Activities Increased Info Percent of long-stay residents whose need for help with daily activities has increased 12.7%
22% better than State average

State average: 16.4%

Walking Ability Worsened Info Percent of long-stay residents whose ability to move independently worsened 21.4%
In line with State average

State average: 21.8%

Low Risk Residents with Bowel/Bladder Incontinence Info Percent of low risk long-stay residents who lose control of their bowels or bladder 31.0%
28% worse than State average

State average: 24.3%

Falls with Major Injury Info Percent of long-stay residents experiencing one or more falls with major injury 1.8%
33% better than State average

State average: 2.6%

High Risk Residents with Pressure Ulcers Info Percent of long-stay high risk residents with pressure ulcers 5.0%
In line with State average

State average: 4.9%

Urinary Tract Infection Info Percent of long-stay residents with a urinary tract infection 1.8%
In line with State average

State average: 1.7%

Lost Too Much Weight Info Percent of long-stay residents who lose too much weight 3.8%
34% better than State average

State average: 5.8%

Depressive Symptoms Info Percent of long-stay residents who have depressive symptoms 9.4%
42% better than State average

State average: 16.2%

Antipsychotic Use Info Percent of long-stay residents who received an antipsychotic medication 11.9%
18% better than State average

State average: 14.5%

Pneumococcal Vaccine Info Percent of long-stay residents assessed and appropriately given the pneumococcal vaccine 100.0%
In line with State average

State average: 96.2%

Influenza Vaccine Info Percent of long-stay residents assessed and appropriately given the seasonal influenza vaccine 98.2%
5% better than State average

State average: 93.8%

Short-stay resident measures
Pneumococcal Vaccine Info Percent of short-stay residents assessed and appropriately given the pneumococcal vaccine 97.6%
11% better than State average

State average: 88.1%

Antipsychotic medication increase Info Percent of short-stay residents who newly received an antipsychotic medication 0.0%
100% better than State average

State average: 1.4%

Influenza Vaccine Info Percent of short-stay residents assessed and appropriately given the seasonal influenza vaccine 94.1%
15% better than State average

State average: 82.0%

Breakdown by payment type

Medicare

50% of new residents, usually for short-term rehab.

Typical stay 1 months

Private pay

32% of new residents, often for short stays.

Typical stay 1 - 2 months

Medicaid

18% of new residents, often for long-term daily care.

Typical stay 10 - 11 months

Facility Characteristics

Source: CMS Long-Term Care Facility Characteristics (Data as of Jan 2026)

Total residents 72
Medicare
16
22.2% of residents
Medicaid
46
63.9% of residents
Private pay or other
10
13.9% of residents
Programs & Services
Residents Group

Residents meet regularly to discuss policies, care quality, and activities

Nurse Aide Training

State-approved Nurse Aide Training and Competency Evaluation Program on-site

Active Resident Council

Organized group of residents that meets regularly to discuss facility policies, quality of life, and activities.

Finances and operations

Based on CMS SNF Cost Report for fiscal year ending in 12/2023.

For-profit
LLC
Net patient revenue Info Net patient revenue — what the home actually collects for resident care, after contractual allowances, bad debt and discounts are subtracted from its gross charges (CMS cost report, Worksheet G-3). It covers resident care only; money the home earns from other sources is shown separately as "Other income."
$8.1M
Net patient income Info Net patient income: net patient revenue minus the home's total operating expenses. A positive figure means it earns more from resident care than it spends to deliver it; a negative figure means the opposite. It excludes non-operating "other income."
$195.4K
For-profit LLC
Net patient revenue Info Net patient revenue — what the home actually collects for resident care, after contractual allowances, bad debt and discounts are subtracted from its gross charges (CMS cost report, Worksheet G-3). It covers resident care only; money the home earns from other sources is shown separately as "Other income."
$8.1M Rank #80 / 94Revenue — State benchmarkedThis home is ranked 80th out of 94 homes in Washington. Shows this facility's annual revenue compared to the Washington average. Higher revenue generally means more resources for staffing and capital — read alongside Payroll %.Rankings are based only on facilities in Washington that report data for that category. Facilities without available data are excluded from the ranking.Click the rank badge to see the full State ranking.Click here to see the full State ranking.
Net patient income Info Net patient income: net patient revenue minus the home's total operating expenses. A positive figure means it earns more from resident care than it spends to deliver it; a negative figure means the opposite. It excludes non-operating "other income."
$195.4K
Other income Info Money the home earns outside of resident care — such as investments, grants, rentals and other non-operating sources (CMS cost report, Worksheet G-3). It is tracked separately from net patient revenue: it is not part of that figure, and it is not included in net patient income.
$13.0K
Payroll costs Info Staff salaries plus wage-related costs — benefits such as payroll taxes, health insurance and retirement — from the home's own accounting records (CMS cost report, Worksheet A). Contract or agency labor is counted separately, under other operating costs. Rank #84 / 94Payroll — State benchmarkedThis home is ranked 84th out of 94 homes in Washington. Shows total annual staff payroll benchmarked to the Washington average. Higher payroll investment relative to peers often signals better staffing and less reliance on cheaper contract labor.Rankings are based only on facilities in Washington that report data for that category. Facilities without available data are excluded from the ranking.Click the rank badge to see the full State ranking.Click here to see the full State ranking.
$3.9M 47.8% of net patient revenue Info Payroll as a share of revenue: staff salaries and wage-related benefits divided by net patient revenue. A higher figure means more of each revenue dollar goes to staff pay. Rank #57 / 94Payroll % — State benchmarkedThis home is ranked 57th out of 94 homes in Washington. Shows payroll as a percentage of revenue versus the Washington average. Well-run Washington facilities typically land around 53–61% — the top third Statewide. Below 25% may signal understaffing or heavy agency use — read with Staffing ratings.Rankings are based only on facilities in Washington that report data for that category. Facilities without available data are excluded from the ranking.Click the rank badge to see the full State ranking.Click here to see the full State ranking.
Other operating costs Info Everything it costs to run the home apart from payroll — food, utilities, supplies, maintenance, contract labor and administration. Calculated as total operating expense minus payroll (staff salaries and wage-related benefits).
$4.0M
Total costs Info The home's total operating expense for the year — all the costs of running it, salaries included (CMS cost report, Worksheet G-3).
$7.9M

What does this home offer?

Pets allowed icon
Pets allowed icon

Pets Allowed

Building type icon
Building type icon

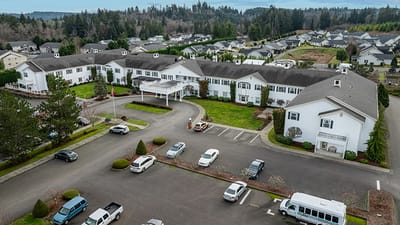
Building Type: Two-story

Transportation services icon

Transportation Services

Fitness and recreation icon

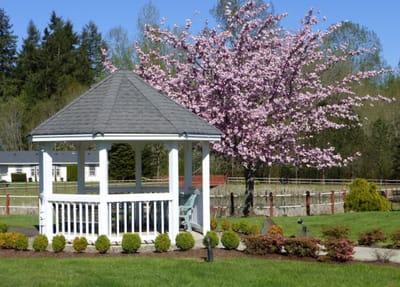
Fitness and Recreation

Who this home usually serves

TYPE OF STAY

Mostly short-term rehab stays

Most residents typically stay for a few weeks or months before returning home or moving on.

Most new residents arrive under Medicare (50% of admissions), and a typical Medicare stay runs around 1 months.

Admissions
225 total

Coverage residents most often arrive under.

Medicare 50%
Private pay 32%
Medicaid 18%
Discharges
235 total

Coverage residents most often leave under.

Medicare 44%
Private pay 26%
Medicaid 30%

Places of interest near Colonial Residence at Stillwaters

Address 2.7 miles from city center Info Estimated distance in miles from Centralia's city center to Colonial Residence at Stillwaters's address, calculated via Google Maps.

Calculate Travel Distance to Colonial Residence at Stillwaters

Add your location

Address

Frequently Asked Questions about Colonial Residence at Stillwaters

Is Colonial Residence at Stillwaters in a walkable area?

Colonial Residence at Stillwaters has a walk score of 2. Car-dependent. Most errands require a car, with limited nearby walkable options.

What is the occupancy rate at Colonial Residence at Stillwaters?

Colonial Residence at Stillwaters's occupancy is 66.3%.

Does Colonial Residence at Stillwaters operate as a for-profit or non-profit?

Colonial Residence at Stillwaters is registered as a for-profit.

Are there photos of Colonial Residence at Stillwaters?

Yes — there are 7 photos of Colonial Residence at Stillwaters in the photo gallery on this page.

What is the address of Colonial Residence at Stillwaters?

Colonial Residence at Stillwaters is located at 2700 Colonial Dr, Centralia, WA 98531.

What is the phone number of Colonial Residence at Stillwaters?

(360) 736-1551 will put you in contact with the team at Colonial Residence at Stillwaters.

Is Colonial Residence at Stillwaters Medicare or Medicaid certified?

Yes — Colonial Residence at Stillwaters is a CMS-certified provider of Medicare and Medicaid.

Guides for Better Senior Living

Care Cost Calculator: See Prices in Your Area

Nursing Home Data Explorer

Don’t Wait Too Long: 7 Red Flag Signs Your Parent Needs Assisted Living Now

The True Cost of Assisted Living in 2025 – And How Families Are Paying For It

Understanding Senior Living Costs: Pricing Models, Discounts & Financial Assistance