King David Nursing and Rehabilitation Center
Nursing Home, Hospice Care, Palliative Care & Respite Care · Pikesville, MD
CMS overall rating Info CMS (the Centers for Medicare & Medicaid Services) is the federal agency that rates nursing home quality. Its Overall Rating runs from 1 to 5 stars, combining health inspections, staffing, and quality measures, with inspections weighted most heavily.

King David Nursing and Rehabilitation Center

Nursing Home, Hospice Care, Palliative Care & Respite Care · Pikesville, MD
CMS overall rating Info CMS (the Centers for Medicare & Medicaid Services) is the federal agency that rates nursing home quality. Its Overall Rating runs from 1 to 5 stars, combining health inspections, staffing, and quality measures, with inspections weighted most heavily.
Calculator: See prices in your area
King David Nursing and Rehabilitation Center accepts Medicare, Medicaid, and private pay.

Overview of King David Nursing and Rehabilitation Center

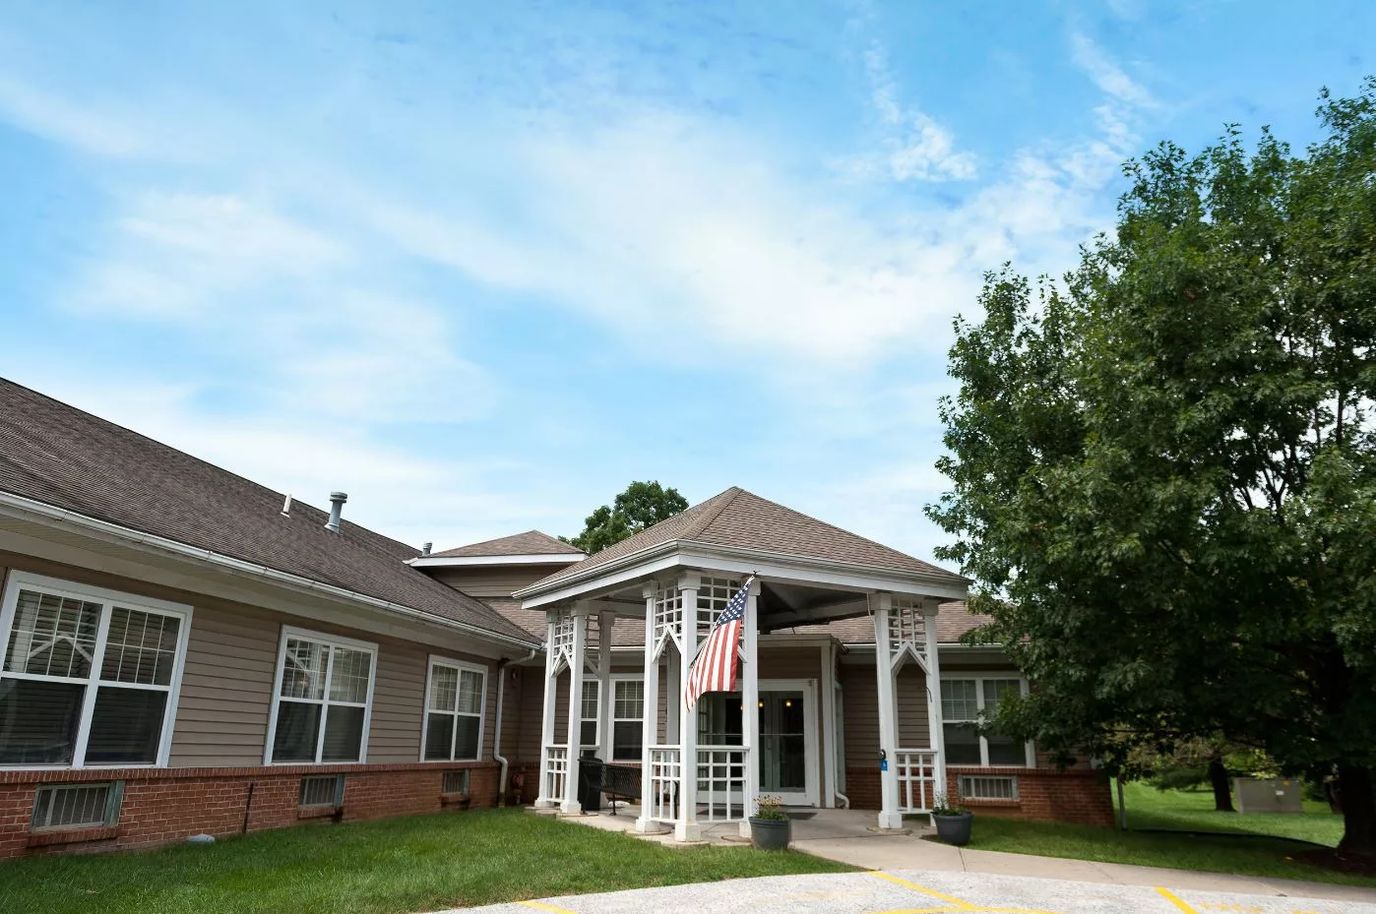
King David Nursing & Rehabilitation Center, an independently owned healthcare facility in Pikesville, Maryland, excels in providing top-notch nursing home care services. They accept various insurances, including Medicare, Medicaid, and private pay options, helping seniors navigate nursing home costs with ease.
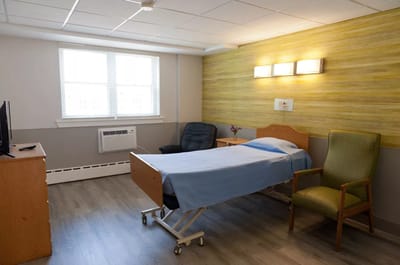
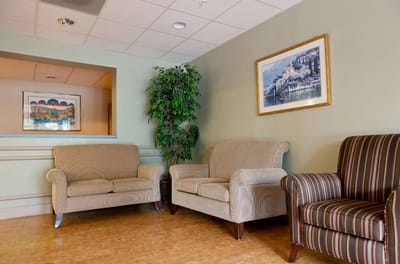
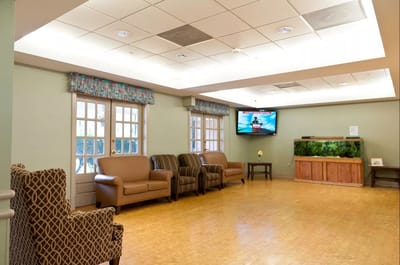
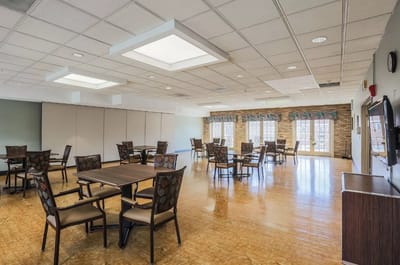
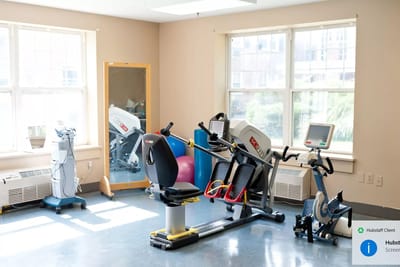
This facility also distinguishes itself with its impeccable cleanliness and elegant ambiance, offering seniors a secure and comfortable environment. With spacious lounges, it fosters socialization among residents, and their dining options cater to different tastes and dietary restrictions. This trusted abode provides a choice between private and semi-private rooms as well, all equipped with amenities like cable and Wi-Fi access. Moreover, it includes an on-site beauty salon and covers daily housekeeping and laundry services, ensuring a hassle-free experience within their nursing home facilities.

King David Nursing & Rehabilitation Center is an independently owned and operated healthcare center that is licensed to use the Autumn Lake Healthcare name and receive non-healthcare related services. All healthcare-related services are provided solely by King David Nursing & Rehabilitation Center.

(410) 486-1500

Quality ratings

Measured by Centers for Medicare & Medicaid Services (CMS)

Overall rating Info The Overall CMS Rating combines results from health inspections, staffing levels and quality measures. Health inspections carry the most weight. Staffing and quality scores can increase or decrease the final rating based on performance compared to state and national standards.
▼ 34.2% Below MD avg. ▼ 34.2% Below MD avg.MD average: 3.0Click the badge to see the full State ranking.Click here to see the full State ranking.
Health Inspection Info Based on the results of the facility's three most recent standard inspections and any complaint investigations. CMS reviews the number, scope, and severity of deficiencies, with more recent findings weighted more heavily.
▼ 29.0% Below MD avg. ▼ 29.0% Below MD avg.MD average: 2.8Click the badge to see the full State ranking.Click here to see the full State ranking.
Staffing Info Measures average nursing staff hours per resident per day, including Registered Nurses (RNs) and total nursing staff. Ratings are adjusted based on the level of care residents require and are compared to state and national benchmarks.
▼ 34.3% Below MD avg. ▼ 34.3% Below MD avg.MD average: 3.0Click the badge to see the full State ranking.Click here to see the full State ranking.
Quality Measures Info Based on clinical and physical health indicators reported to CMS, such as hospital readmissions, falls, pressure ulcers, and improvements in mobility. These measures reflect how well residents' health needs are being managed.
▲ 8.2% Above MD avg. ▲ 8.2% Above MD avg.MD average: 3.7Click the badge to see the full State ranking.Click here to see the full State ranking.

Staffing hours breakdown

Info Daily nursing hours per resident by staff type, reported to CMS. Higher is generally better — compare this facility to state and national averages to see where staffing stands.

Hours per resident per day — compared to Maryland state averages

Total nursing care / resident Info Total adjusted nursing hours per resident per day, combining RN, LPN, and aide time. CMS adjusts this for case-mix so facilities can be fairly compared.
3h 23m per day
This facility Maryland avg (3h 46m per day)
vs Maryland avg
-10%

2 of 6 metrics below state avg

Standout metric Physical Therapist is +60% above state avg
Staff typeHours / Day / Residentvs state avg
Registered Nurse (RN) Info RNs hold the highest nursing license and can assess residents, interpret test results, and direct care plans. More RN hours per day often signals stronger clinical oversight and faster response to health changes. 17m per day ▼ 66% State avg: 50m per day · National avg: 41m per day
LPN / LVN Info Licensed Practical Nurses (LPNs) or Licensed Vocational Nurses (LVNs) deliver routine hands-on care — medication administration, wound dressing, and monitoring vital signs. They work under RN supervision and make up a large share of daily bedside care. 1h 2m per day ▲ 15% State avg: 54m per day · National avg: 52m per day
Nurse Aide Info Certified Nurse Aides (CNAs) provide the most direct day-to-day assistance: bathing, dressing, feeding, and mobility. Nurse aide hours are typically the largest staffing category and directly affect residents' quality of life. 2h 27m per day ▲ 13% State avg: 2h 10m per day · National avg: 2h 21m per day
Weekend Total Nursing Info Combined nursing hours (RN + LPN + Nurse Aide) per resident per day on weekends. Staffing often drops on weekends — this figure reveals whether the facility maintains adequate coverage outside of weekday hours. 3h 29m per day ■ Avg State avg: 3h 29m per day · National avg: 3h 26m per day
Physical Therapist Info Hours per resident per day provided by licensed Physical Therapists (PTs) or PT Assistants. PT services help residents recover mobility after injury or illness and are especially important for post-acute (short-stay) rehabilitation. 8m per day ▲ 60% State avg: 5m per day · National avg: 4m per day
Weekend RN Info Registered nurse hours specifically on weekends. Facilities sometimes reduce RN presence on Saturdays and Sundays — a low weekend RN figure compared to weekday hours can indicate reduced clinical oversight when most administrative staff are absent. 9m per day ▼ 74% State avg: 37m per day · National avg: 29m per day

Capacity and availability

This home usually has limited availability

Higher occupancy than the Maryland average: 82.4%
Occupancy rate
88.8%
Avg. Length of Stay
87 days
Bed community size
100-bed community Rank #117 / 697Bed count — State benchmarkedThis home is ranked 117th out of 697 homes in Maryland. Shows this facility's certified or reported bed count compared to other Maryland facilities. Larger communities may offer more amenities, programs, and on-site services for residents and families.Rankings are based only on facilities in Maryland that report data for that category. Facilities without available data are excluded from the ranking.Click the rank badge to see the full State ranking.Click here to see the full State ranking.
A larger shared setting that may offer more common spaces and organized community services.
Walk Score
Walk Score: 72 / 100 Rank #160 / 985Walk Score — State benchmarkedThis home is ranked 160th out of 985 homes in Maryland. Shows how walkable this facility's neighborhood is compared to the average Walk Score across Maryland facilities. Higher scores benefit residents, families, and staff.Rankings are based only on facilities in Maryland that report data for that category. Facilities without available data are excluded from the ranking.Click the rank badge to see the full State ranking.Click here to see the full State ranking.
Very walkable. Most errands can be accomplished on foot, and many essentials are within a short walk.

Payment & Insurance

2 services
Accept Medicaid
Accept Medicare

Therapy & Rehabilitation

2 services
Rehabilitation Services
Short-Term Rehab

Additional Services

1 service
Short-Term Rehabilitation

Amenities & Lifestyle

State-Of-The-Art Gym
Outdoor And Indoor Spaces For Socializing
Activities Schedule
Specific ProgramsLong-term Living, Renowned Specialty Care
Religious ServicesYes

Contact King David Nursing and Rehabilitation Center

Staffing Data

Reporting period: October 1 – December 31, 2025 (Q4 2025). Source: CMS Payroll-Based Journal report.

Total staff 154
Employees 132
Contractors 22
Staff to resident ratio 1.60 : 1
12% fewer staff per resident than Maryland average
Maryland average ratio: 1.81 : 1 Maryland average ratio: 1.81 : 1See full Maryland ranking
Avg staff/day 66
Average shift 8.1 hours
0% compared with Maryland average
Maryland average: 8 hours Maryland average shift: 8 hoursSee full Maryland ranking
Total staff hours (quarter) 48,908

Nursing staff breakdown

Q4 2025 · Oct 1 – Dec 31 More info This data comes from the CMS Payroll-Based Journal report covering October 1 – December 31, 2025.
Registered Nurse

Manages medical care and health needs.

RN Staff Info All 5 RN Staff are full-time employees. No contractors work on this role. 5
Average shift length Info Average shift length. Calculated as total hours divided by days worked and average staff per day. 8.6 hours
Licensed Practical Nurse

Assists with medical care and medications.

LPN Staff Info All 24 LPN Staff are full-time employees. No contractors work on this role. 24
Average shift length Info Average shift length. Calculated as total hours divided by days worked and average staff per day. 8.5 hours
Certified Nursing Assistant

Helps with daily care and mobility.

CNA Staff Info All 63 CNA Staff are full-time employees. No contractors work on this role. 63
Average shift length Info Average shift length. Calculated as total hours divided by days worked and average staff per day. 8.1 hours

Contractor staffing

Q4 2025 · Oct 1 – Dec 31 More info This data comes from the CMS Payroll-Based Journal report covering October 1 – December 31, 2025.

Total hours from contractors

10.6%

5,205 contractor hours this quarter

Qualified Social Worker: 8 Respiratory Therapy Technician: 6 Physical Therapy Aide: 3 Physical Therapy Assistant: 3 Speech Language Pathologist: 2

Staff by category

Q4 2025 · Oct 1 – Dec 31 More info This data comes from the CMS Payroll-Based Journal report covering October 1 – December 31, 2025.
Certified Nursing Assistant6306320,60292100%8.1
Licensed Practical Nurse240248,36092100%8.5
Physical Therapist160165,94992100%7.6
Medication Aide/Technician4041,87592100%8.7
Registered Nurse5051,4809199%8.6
Other Dietary Services Staff4041,2718896%8
Qualified Social Worker0881,2636874%7.4
Respiratory Therapy Technician0661,2209098%8
RN Director of Nursing4041,1038390%8.4
Physical Therapy Aide0331,0077076%7.7
Physical Therapy Assistant0339126975%7.6
Speech Language Pathologist0228046571%7
Clinical Nurse Specialist3036026773%8
Dental Services Staff2026005863%7.5
Nurse Practitioner1015046874%7.4
Administrator2024886571%7.5
Dietitian2024586166%7.5
Mental Health Service Worker2024135560%7.5
63 Certified Nursing Assistant
% of Days 100%
24 Licensed Practical Nurse
% of Days 100%
16 Physical Therapist
% of Days 100%
4 Medication Aide/Technician
% of Days 100%
5 Registered Nurse
% of Days 99%
4 Other Dietary Services Staff
% of Days 96%
8 Qualified Social Worker
% of Days 74%
6 Respiratory Therapy Technician
% of Days 98%
4 RN Director of Nursing
% of Days 90%
3 Physical Therapy Aide
% of Days 76%
3 Physical Therapy Assistant
% of Days 75%
2 Speech Language Pathologist
% of Days 71%
3 Clinical Nurse Specialist
% of Days 73%
2 Dental Services Staff
% of Days 63%
1 Nurse Practitioner
% of Days 74%
2 Administrator
% of Days 71%
2 Dietitian
% of Days 66%
2 Mental Health Service Worker
% of Days 60%

Penalties and fines

Federal penalties imposed by CMS for regulatory violations, including civil money penalties (fines) and denials of payment for new Medicare/Medicaid admissions.

Source: CMS Penalties Database

No penalties in the past 3 years

No civil money penalties or payment denials were reported in the last 3 years.

Quality of care over time

These measures show how residents usually do over time at this home, based on health outcomes and preventive care.

High-risk clinical events score Info A composite score based on pressure ulcers, falls with injury, weight loss, walking ability decline, and activities of daily living decline. 15.7
21% worse than Maryland average

Maryland average: 12.9

Functional decline score Info A composite score based on activities of daily living decline, walking ability decline, and incontinence. 30.4
18% worse than Maryland average

Maryland average: 25.7

Long-stay resident measures
Average Maryland avg: 3.7 Info CMS star rating based on long-stay quality measure performance. 5 stars = significantly above average, 1 star = significantly below average.
Need for Help with Daily Activities Increased Info Percent of long-stay residents whose need for help with daily activities has increased 37.1%
57% worse than Maryland average

Maryland average: 23.7%

Walking Ability Worsened Info Percent of long-stay residents whose ability to move independently worsened 23.9%
14% better than Maryland average

Maryland average: 27.7%

Low Risk Residents with Bowel/Bladder Incontinence Info Percent of low risk long-stay residents who lose control of their bowels or bladder 30.1%
16% worse than Maryland average

Maryland average: 25.9%

Falls with Major Injury Info Percent of long-stay residents experiencing one or more falls with major injury 0.4%
85% better than Maryland average

Maryland average: 2.3%

High Risk Residents with Pressure Ulcers Info Percent of long-stay high risk residents with pressure ulcers 7.2%
10% worse than Maryland average

Maryland average: 6.5%

Urinary Tract Infection Info Percent of long-stay residents with a urinary tract infection 0.7%
56% better than Maryland average

Maryland average: 1.6%

Lost Too Much Weight Info Percent of long-stay residents who lose too much weight 9.9%
71% worse than Maryland average

Maryland average: 5.8%

Depressive Symptoms Info Percent of long-stay residents who have depressive symptoms 35.4%
75% worse than Maryland average

Maryland average: 20.2%

Antipsychotic Use Info Percent of long-stay residents who received an antipsychotic medication 11.0%
15% better than Maryland average

Maryland average: 12.9%

Pneumococcal Vaccine Info Percent of long-stay residents assessed and appropriately given the pneumococcal vaccine 100.0%
9% better than Maryland average

Maryland average: 92.0%

Influenza Vaccine Info Percent of long-stay residents assessed and appropriately given the seasonal influenza vaccine 100.0%
In line with Maryland average

Maryland average: 96.6%

Hospitalizations per 1,000 days Info Number of hospitalizations per 1,000 long-stay resident days. 2.05
55% worse than Maryland average

Maryland average: 1.32

ED visits per 1,000 days Info Number of outpatient emergency department visits per 1,000 long-stay resident days. 1.91
58% worse than Maryland average

Maryland average: 1.21

Short-stay resident measures
Significantly above average Maryland avg: 3.7 Info CMS star rating based on short-stay quality measure performance. 5 stars = much above average, 1 star = much below average.
Pneumococcal Vaccine Info Percent of short-stay residents assessed and appropriately given the pneumococcal vaccine 99.2%
26% better than Maryland average

Maryland average: 78.4%

Antipsychotic medication increase Info Percent of short-stay residents who newly received an antipsychotic medication 1.1%
22% better than Maryland average

Maryland average: 1.4%

Influenza Vaccine Info Percent of short-stay residents assessed and appropriately given the seasonal influenza vaccine 99.4%
23% better than Maryland average

Maryland average: 80.6%

Re-hospitalized after SNF stay Info Percentage of short-stay residents who were re-hospitalized after their nursing home admission. 26.0%
23% worse than Maryland average

Maryland average: 21.2%

Emergency department visits Info Percentage of short-stay residents who had an outpatient emergency department visit. 6.3%
36% better than Maryland average

Maryland average: 9.9%

Falls with major injury Info Percentage of SNF residents who experience falls with major injury during their stay. 1.3%
71% worse than Maryland average

Maryland average: 0.8%

Ability to care for self at discharge Info Percentage of residents at or above expected ability to care for themselves at discharge. 57.1%
6% better than Maryland average

Maryland average: 53.7%

Successful return to home or community Info Rate of successful return to home or community from a skilled nursing facility. 58.3%
15% better than Maryland average

Maryland average: 50.6%

Breakdown by payment type

Medicare

56% of new residents, usually for short-term rehab.

Typical stay 1 - 2 months

Private pay

34% of new residents, often for short stays.

Typical stay 25 days

Medicaid

11% of new residents, often for long-term daily care.

Typical stay 1 years

Facility Characteristics

Source: CMS Long-Term Care Facility Characteristics (Data as of Jan 2026)

Total residents 96
Medicare
38
39.6% of residents
Medicaid
58
60.4% of residents
Programs & Services
Residents Group

Residents meet regularly to discuss policies, care quality, and activities

Active Resident Council

Organized group of residents that meets regularly to discuss facility policies, quality of life, and activities.

Finances and operations

Based on CMS SNF Cost Report for fiscal year ending in 12/2023.

Privately-owned community
Operated by a single business entity.
Net patient revenue Info Net patient revenue — what the home actually collects for resident care, after contractual allowances, bad debt and discounts are subtracted from its gross charges (CMS cost report, Worksheet G-3). It covers resident care only; money the home earns from other sources is shown separately as "Other income."
$16.3M
Net patient income Info Net patient income: net patient revenue minus the home's total operating expenses. A positive figure means it earns more from resident care than it spends to deliver it; a negative figure means the opposite. It excludes non-operating "other income."
$1.6M
Privately-owned community Operated by a single business entity.
Net patient revenue Info Net patient revenue — what the home actually collects for resident care, after contractual allowances, bad debt and discounts are subtracted from its gross charges (CMS cost report, Worksheet G-3). It covers resident care only; money the home earns from other sources is shown separately as "Other income."
$16.3M
Net patient income Info Net patient income: net patient revenue minus the home's total operating expenses. A positive figure means it earns more from resident care than it spends to deliver it; a negative figure means the opposite. It excludes non-operating "other income."
$1.6M
Other income Info Money the home earns outside of resident care — such as investments, grants, rentals and other non-operating sources (CMS cost report, Worksheet G-3). It is tracked separately from net patient revenue: it is not part of that figure, and it is not included in net patient income.
$113.5K
Payroll costs Info Staff salaries plus wage-related costs — benefits such as payroll taxes, health insurance and retirement — from the home's own accounting records (CMS cost report, Worksheet A). Contract or agency labor is counted separately, under other operating costs.
$2.3M 14.3% of net patient revenue Info Payroll as a share of revenue: staff salaries and wage-related benefits divided by net patient revenue. A higher figure means more of each revenue dollar goes to staff pay.
Other operating costs Info Everything it costs to run the home apart from payroll — food, utilities, supplies, maintenance, contract labor and administration. Calculated as total operating expense minus payroll (staff salaries and wage-related benefits).
$12.4M
Total costs Info The home's total operating expense for the year — all the costs of running it, salaries included (CMS cost report, Worksheet G-3).
$14.7M

Who this home usually serves

TYPE OF STAY

Mostly short-term rehab stays

Most residents typically stay for a few weeks or months before returning home or moving on.

Most new residents arrive under Medicare (56% of admissions), and a typical Medicare stay runs around 1 - 2 months.

Admissions
399 total

Coverage residents most often arrive under.

Medicare 56%
Private pay 34%
Medicaid 11%
Discharges
398 total

Coverage residents most often leave under.

Medicare 49%
Private pay 31%
Medicaid 20%

Places of interest near King David Nursing and Rehabilitation Center

Address 1.1 miles from city center Info Estimated distance in miles from Pikesville's city center to King David Nursing and Rehabilitation Center's address, calculated via Google Maps.

Calculate Travel Distance to King David Nursing and Rehabilitation Center

Add your location

Address

Compare Nursing Homes around Pikesville

The information below is reported by the Maryland Department of Health, Office of Health Care Quality.

2 facilities compared · CMS & MD Dept. of Health data

King David Nursing and Rehabilitation Center
NH
HC
PC
RC
Pikesville (Colonial Village)
100
Facility 100
MD AVG 43
Rank #117 / 697
88.8% +8%3.39 -77%-10%$0
60
Facility 60
MD AVG 49.9
Rank #110 / 149
15.0-100-
72
Facility 72
MD AVG 43
Rank #160 / 985
4260 Group LLC$16.3M$2.3M14.3%215022
Autumn Lake Healthcare at Pikesville
NH
HC
PC
RC
Pikesville (Sudbrook Lane)
140
Facility 140
MD AVG 43
Rank #52 / 697
81.1% -2%3.56 -37%-6%$0
67
Facility 67
MD AVG 49.9
Rank #120 / 149
16.81114-
79
Facility 79
MD AVG 43
Rank #99 / 985
Pikesville Operator, LLC$15.9M$2.3M14.2%215082

Financial Assistance for
Nursing Home in Maryland

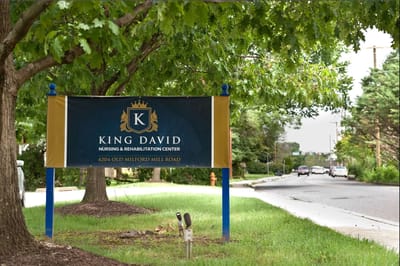
King David Nursing and Rehabilitation Center is located in Pikesville, Maryland.
Here are the financial assistance programs available to residents in Maryland.

Get Financial aid guidance

Community Options Waiver

Maryland Medicaid Community Options Waiver

Age 65+ or disabled
General Maryland resident, Medicaid- eligible, nursing home-level care need.
Income Limits (2025) ~$2,829/month 300% FBR, individual
Asset Limits $2,000 (individual), $3,000 (couple) (excludes home, car).
MD

High urban demand; rural outreach efforts.

Benefits
Personal care (5-7 hours/day, e.g., bathing, dressing) Respite care (up to 240 hours/year) Adult day care ($70/day) Home modifications ($1,500 avg.)

Senior Care Program

Maryland Senior Care

Age 65+
General Maryland resident, at risk of nursing home placement.
Income Limits ~$2,000/month individual, varies by county
Asset Limits $11,000 individual
MD

Limited funding; waitlists common in high-demand areas.

Benefits
In-home care (3-5 hours/week) Respite care (up to 10 days/year) Meals (~$6/meal) Transportation (~5 trips/month) Case management

Maryland Nursing Home Medicaid

Maryland Medical Assistance (Medicaid) Nursing Home Program

Age 65+
General Maryland resident, Medicaid-eligible, requires nursing home-level care.
Income Limits (2025) $943/month (individual); most income applied to care costs.
Asset Limits $2,500 (individual), $3,000 (couple); spousal protections up to $155,356.
MD

Home equity limit $636,000; estate recovery applies post-55.

Benefits
24/7 nursing care Meals Therapy Medications (unlimited per medical need)

Senior Assisted Living Subsidy Program

Maryland Senior Assisted Living Group Home Subsidy

Age 62+
General Maryland resident, in or moving to approved assisted living, low/moderate income.
Income Limits (2025) ~$34,000/year individual, varies by county
Asset Limits Not strict; prioritizes low-income.
MD

Not available statewide; facility must be licensed by MDH.

Benefits
Personal care Meals 24-hour supervision (up to $1,500/month subsidy typical)

Veterans Aid and Attendance (A&A) Benefit

Maryland VA Aid and Attendance

Age
General Wartime veteran/spouse, age 65+ or disabled, needs ADL help, Maryland resident.
Income Limits (2025) Net income minus medical expenses < $1,984/month individual with A&A
Asset Limits $155,356 net worth limit
MD

High veteran population in suburban/rural areas.

Benefits
Cash benefit ($1,478-$2,471/month, varies by status) for care costs

Senior Prescription Drug Assistance Program (SPDAP)

Maryland Senior Prescription Drug Assistance Program

Age 65+
General Maryland resident (6+ months), Medicare Part D enrolled.
Income Limits (2025) $48,560/year individual, 300% FPL
Asset Limits None specified.
MD

Supplements Medicare Part D; annual enrollment required.

Benefits
Up to $40/month premium subsidy Reducing drug costs

Medicare Savings Programs (MSP)

Maryland Medicare Savings Programs

Age 65+
General Maryland resident, Medicare Part A/B enrollee.
Income Limits (2025) $2,014/month (QMB), $2,706/month (SLMB/QI, individual).
Asset Limits $9,090 (individual), $13,630 (couple).
MD

Includes QMB, SLMB, QI categories.

Benefits
Covers premiums (up to $174.70/month Part B) Co-pays Deductibles

Community Personal Assistance Services (CPAS)

Maryland Medicaid Community Personal Assistance Services

Age 65+
General Maryland resident, Medicaid-eligible, needs ADL assistance.
Income Limits (2025) $943/month (individual); spend-down available.
Asset Limits $2,500 (individual), $3,000 (couple).
MD

Consumer-directed option allows hiring family caregivers.

Benefits
Personal care (hours vary, typically 20-30/week) Chores Nurse supervision

Frequently Asked Questions about King David Nursing and Rehabilitation Center

What neighborhood is King David Nursing and Rehabilitation Center in?

King David Nursing and Rehabilitation Center is in the Colonial Village neighborhood.

Is King David Nursing and Rehabilitation Center in a walkable area?

King David Nursing and Rehabilitation Center has a walk score of 72. Very walkable. Most errands can be accomplished on foot, and many essentials are within a short walk.

What is the occupancy rate at King David Nursing and Rehabilitation Center?

King David Nursing and Rehabilitation Center's occupancy is 88.8%.

Are there photos of King David Nursing and Rehabilitation Center?

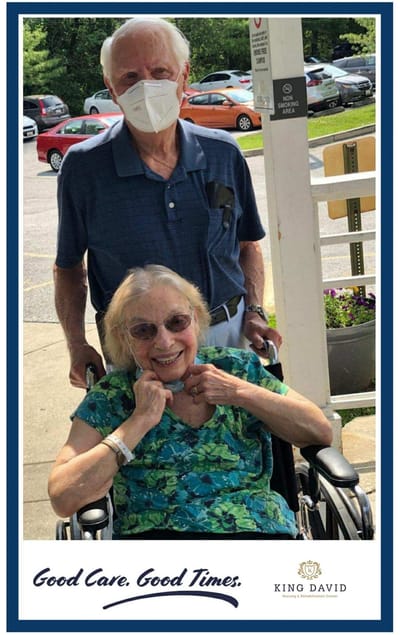
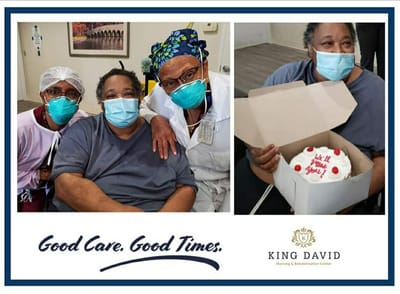
Yes — there are 14 photos of King David Nursing and Rehabilitation Center in the photo gallery on this page.

What is the address of King David Nursing and Rehabilitation Center?

King David Nursing and Rehabilitation Center is located at 4204 Old Milford Mill Rd, Pikesville, MD 21208.

What is the phone number of King David Nursing and Rehabilitation Center?

(410) 486-1500 will put you in contact with the team at King David Nursing and Rehabilitation Center.

Is King David Nursing and Rehabilitation Center Medicare or Medicaid certified?

Yes — King David Nursing and Rehabilitation Center is a CMS-certified provider of Medicare and Medicaid.

Guides for Better Senior Living

Care Cost Calculator: See Prices in Your Area

Nursing Home Data Explorer

Don’t Wait Too Long: 7 Red Flag Signs Your Parent Needs Assisted Living Now

The True Cost of Assisted Living in 2025 – And How Families Are Paying For It

Understanding Senior Living Costs: Pricing Models, Discounts & Financial Assistance