Explore Open Rooms

1 Contact details
2 What type of senior care service are you looking for?
3 What budget do you have in mind for senior care?
4 How soon do you need to find care?
5 Additional details

Thank you for your interest!

Our team will be in touch shortly to help with next steps.

Nursing Home

Burlington Health & Rehabilitation Center

Nursing Home

Burlington Health & Rehabilitation Center

300 Pearl St, Burlington, VT 05401 View map
Overview of Burlington Health & Rehabilitation Center

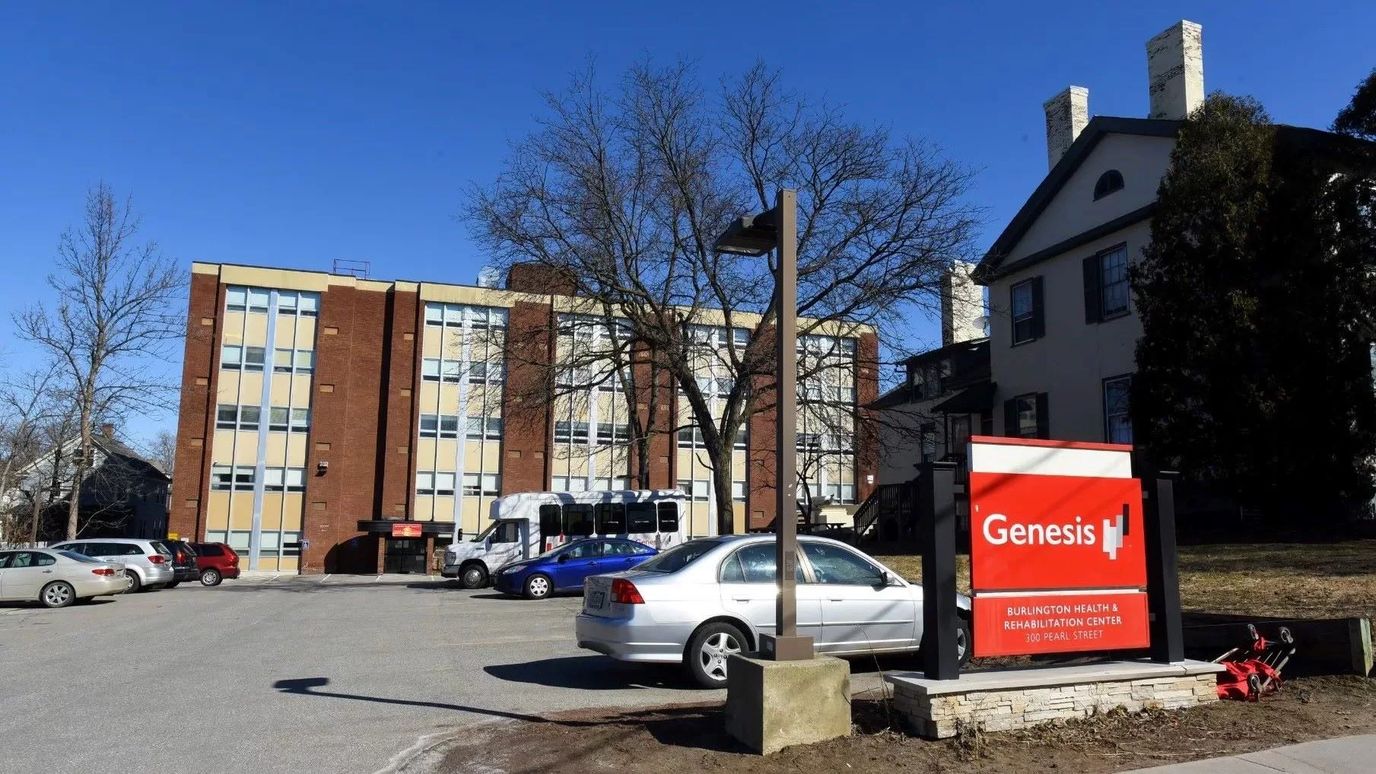
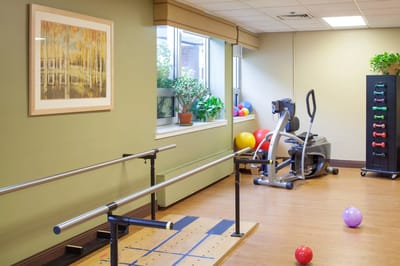
Burlington Health & Rehabilitation Center is a comprehensive care facility that offers skilled nursing and medical rehabilitation, catering to both short-term and extended stays. Notably, they are VA contracted, making their nursing home accessible to veterans. Their dedicated clinical care teams focus on assisting residents in their journey to recovery and overall well-being.
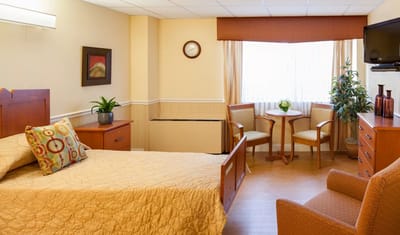
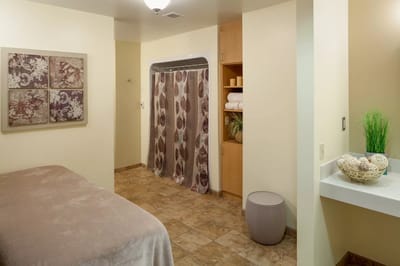
With a wide range of services available, including dietary and nutrition support, dental care, dementia care, personal care, pet therapy, wound care, x-ray services, and social activities, Burlington Health & Rehabilitation Center is equipped to meet various nursing home requirements. Their strategic location provides convenient access to nursing homes nearby, enhancing the accessibility of their services. Additionally, residents can benefit from amenities such as spa services, scenic views, pet-friendly policies, Internet access, a beauty salon, barber services, comfortable lounge areas, and spacious rooms, ensuring a well-rounded and supportive environment for all residents.

(802) 658-4200

Quality ratings

Measured by Centers for Medicare & Medicaid Services (CMS)

Overall rating Info The Overall CMS Rating combines results from health inspections, staffing levels and quality measures. Health inspections carry the most weight. Staffing and quality scores can increase or decrease the final rating based on performance compared to state and national standards.
2/5
Vermont average: 2.6/5
Health Inspection Info Based on the results of the facility's three most recent standard inspections and any complaint investigations. CMS reviews the number, scope, and severity of deficiencies, with more recent findings weighted more heavily.
2/5
Vermont average: 2.6/5
Staffing Info Measures average nursing staff hours per resident per day, including Registered Nurses (RNs) and total nursing staff. Ratings are adjusted based on the level of care residents require and are compared to state and national benchmarks.
2/5
Vermont average: 3.1/5
Quality Measures Info Based on clinical and physical health indicators reported to CMS, such as hospital readmissions, falls, pressure ulcers, and improvements in mobility. These measures reflect how well residents' health needs are being managed.
4/5
Vermont average: 3.1/5

Nursing care per resident

Info This shows how many total hours of nursing staff time are available per resident each day. Higher numbers usually mean more staff support.
3h 30m per day

This home provides 17% less nursing time per resident than the Vermont average.

Vermont average: 4h 13m per day

Staffing hours breakdown

Info Hours of care per resident per day, broken down by staff type. Data from CMS Medicare.
Staff type Facility State avg National avg
Registered Nurse (RN) Info Registered nurse hours per resident per day. 35m per day 49m per day 41m per day
Nurse Aide Info Nurse aide hours per resident per day. 2h 22m per day 2h 35m per day 2h 21m per day
Total Nursing (Weekend) Info Total number of nurse staff hours per resident per day on weekends. 3h 38m per day 3h 41m per day 3h 26m per day
Physical Therapist Info Physical therapist staff hours per resident per day. 10m per day 6m per day 4m per day
RN (Weekend) Info Registered nurse hours per resident per day on weekends. 20m per day 32m per day 29m per day

Capacity and availability

Medium-capacity home

Offers a balance of services and community atmosphere.

Total beds 126

This home usually has availability

Lower occupancy suggests more openings may be available.

Lower demand than the Vermont average
Occupancy rate 65.8%
Residents per day (avg) 105
Occupancy rate
65.8%
Residents per day (avg)
105

Who this home usually serves

TYPE OF STAY

Mostly short-term rehab stays

Most residents typically stay for a few weeks or months before returning home or moving on.

Might be optimal for
Short stays Recovery Medicare-covered care

Breakdown by payment type

Medicare

47% of new residents, usually for short-term rehab.

Typical stay 2 - 3 months

Private pay

37% of new residents, often for short stays.

Typical stay 4 - 5 months

Medicaid

16% of new residents, often for long-term daily care.

Typical stay 4 - 5 years

Finances and operations

Privately-owned community
Operated by a business corporation.
Home revenue
$14.7M
Operating loss
-$10.2K
Privately-owned community Operated by a business corporation.
Home revenue
$14,660,782.00
Operating loss
$-10,183.00
Payroll costs Info The portion of the home's budget spent on staff, including nurses, caregivers, and other employees who support care and operations.
$3.3M
22.4% of revenue
Other operating costs Info All remaining costs needed to run the home, such as food, utilities, building maintenance, supplies and administrative expenses.
$11.4M
Total costs $14.7M
Walk Score
Walk Score: 86 / 100
Very walkable. Most errands can be accomplished on foot, and many essentials are within a short walk.
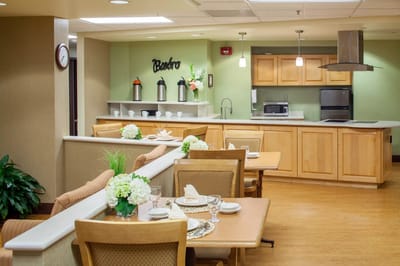
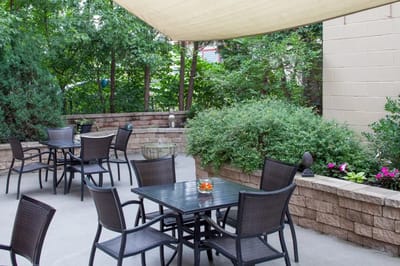
About this community

License details

Facility type
Nursing Home
County: Chittenden

Care Services

Provides Memory Care

Contact Information

Fax: 802-863-8016

Types of Care at Burlington Health & Rehabilitation Center

Memory Care Respite Care Nursing Home Hospice Care
Contact Burlington Health & Rehabilitation Center

Inspection History

In Vermont, the Department of Disabilities, Aging and Independent Living is the authority responsible for inspecting facilities and investigating complaints to protect resident well-being.

10 visits/inspections

5 visits/inspections triggered by complaints

2 routine inspections

Results

10 with issues

0 without issues

Latest inspection

Date:December 17, 2025
Type:Other

46 deficiencies

Deficiencies indicate regulatory issues. A higher number implies the facility had several areas requiring improvement.

Health Inspection History

Inspections
Total health inspections 11

Vermont average 6.5


Last Health inspection on May 2025

Total health citations 35

Vermont average 28.9

Citations per inspection
3.18

Vermont average 4.31


Health citations are formal notices following inspections when they fail to comply with safety and care standards.

8 of 35 citations resulted from standard inspections; 23 of 35 resulted from complaint investigations; and 4 of 35 came from combined inspections (standard and complaint).

Breakdown of citation severity (last 3 years)
Critical Health citations More info 3
329% worse than Vermont average

Vermont average: 0.7


Serious Health citations More info 4
111% worse than Vermont average

Vermont average: 1.9

3 critical citations More info Vermont average: 0.7

4 serious citations More info Vermont average: 1.9

26 moderate citations More info Vermont average: 24.6

2 minor citations More info Vermont average: 1.5
Citations history (last 3 years)
Abuse/Neglect moderate citation Info Issues related to protecting resident's from harm, including abuse, neglect, or mistreatment. May 20, 2025
Corrected

Abuse/Neglect moderate citation Info Issues related to protecting resident's from harm, including abuse, neglect, or mistreatment. May 20, 2025
Corrected

Nursing Services moderate citation Info Issues related to the availability and quality of nursing staff and the care they provide. Dec 04, 2024
Corrected

Nutrition minor citation Info Issues related to food quality, meal service, and resident's nutritional needs. Dec 04, 2024
Corrected

Compare Nursing Homes around Burlington The information below is reported by the Vermont Department of Disabilities, Aging and Independent Living.

3 facilities compared · CMS & VT Dept. of Health data · Updated Mar 2026

Burlington Health & Rehabilitation Center
AL

Assisted Living A licensed, long-term care setting for seniors or individuals with disabilities who need help with daily activities — like bathing, dressing, and medication management — but not 24-hour skilled nursing. Offers housing, meals, and around-the-clock support while aiming to maximize resident independence.

NH

Nursing Home Licensed facility providing 24/7 skilled nursing care for residents with complex, ongoing medical needs. Staffed by RNs, LPNs, and CNAs. Inspected and star-rated annually by CMS. Accepts Medicare (short-term rehab) and Medicaid (long-term care).

Burlington (Old North End)
126
65.8%
-19%
3.49
-17%
-18%
2
35
7
105
86
-
$14,6M
$3,3M
22.5%
475014
Birchwood Terrace Rehab and Healthcare
AL

Assisted Living A licensed, long-term care setting for seniors or individuals with disabilities who need help with daily activities — like bathing, dressing, and medication management — but not 24-hour skilled nursing. Offers housing, meals, and around-the-clock support while aiming to maximize resident independence.

NH

Nursing Home Licensed facility providing 24/7 skilled nursing care for residents with complex, ongoing medical needs. Staffed by RNs, LPNs, and CNAs. Inspected and star-rated annually by CMS. Accepts Medicare (short-term rehab) and Medicaid (long-term care).

Burlington (New North End)
144
86.8%
+7%
4.06
-12%
-5%
1
20
1
130
36
Rubin, Alter
$18,8M
$7,5M
39.6%
475003
Elderwood at Burlington
AL

Assisted Living A licensed, long-term care setting for seniors or individuals with disabilities who need help with daily activities — like bathing, dressing, and medication management — but not 24-hour skilled nursing. Offers housing, meals, and around-the-clock support while aiming to maximize resident independence.

NH

Nursing Home Licensed facility providing 24/7 skilled nursing care for residents with complex, ongoing medical needs. Staffed by RNs, LPNs, and CNAs. Inspected and star-rated annually by CMS. Accepts Medicare (short-term rehab) and Medicaid (long-term care).

Burlington (New North End)
150
72.9%
-10%
3.71
+53%
-13%
3
83
15
121
7
98 Starr Farm Road Operating Holdco Llc
$20,0M
$7,0M
35.1%
475030

Places of interest near Burlington Health & Rehabilitation Center

Address 2.2 miles from city center — 0.3 miles to nearest hospital (UVM Student Health Services)

Address 300 Pearl St, Burlington, VT 05401

Calculate Travel Distance to Burlington Health & Rehabilitation Center

Add your location

Address

Staffing Data (Q2 2025)

This data corresponds to Q2 2025 and is based on CMS Payroll-Based Journal.

Total staff 142
Employees 52
Contractors 90
Staff to resident ratio 1.53:1
6% worse than Vermont average

Vermont average ratio: 1.63:1

Avg staff/day 55
Average shift 9.2 hours
12% better than Vermont average

Vermont average: 8.2 hours

Total staff hours (quarter) 45,825
Nursing staff breakdown
Registered Nurse

Manages medical care and health needs.

Total count 14
Average shift length Info Average shift length. Calculated as total hours divided by days worked and average staff per day. 9.4 hours

This role is partially covered by contractors.

Licensed Practical Nurse

Assists with medical care and medications.

Total count 26
Average shift length Info Average shift length. Calculated as total hours divided by days worked and average staff per day. 11.6 hours

This role is partially covered by contractors.

Certified Nursing Assistant

Helps with daily care and mobility.

Total count 63
Average shift length Info Average shift length. Calculated as total hours divided by days worked and average staff per day. 9.5 hours

This role is partially covered by contractors.

Contractor staffing

Total hours from contractors

67.8%

31,057 contractor hours this quarter

Certified Nursing Assistant: 51 Licensed Practical Nurse: 22 Registered Nurse: 6 Occupational Therapy Assistant: 4 Medical Director: 2 Physician Assistant: 2 Nurse Practitioner: 1 Clinical Nurse Specialist: 1 Other Dietary Services Staff: 1
Staff by category
Certified Nursing Assistant12516322,38691100%9.5
Licensed Practical Nurse422269,65191100%11.6
Registered Nurse86145,21191100%9.4
Respiratory Therapy Technician5051,5076875%7.1
Other Dietary Services Staff4151,0007380%7.4
Clinical Nurse Specialist1129577481%12.1
Physical Therapy Assistant4048097279%6.7
Physical Therapy Aide3035536774%7.5
Dietitian2025336673%8.1
Administrator1015126470%8
Mental Health Service Worker1015006571%7.7
Dental Services Staff1014716470%7.4
Qualified Social Worker3034036571%6.1
Physician Assistant0223725358%3.5
Speech Language Pathologist2023644752%7.6
Nurse Practitioner1122973437%8.7
Medical Director0222405358%3
Occupational Therapy Assistant044613640%1.6
63 Certified Nursing Assistant
% of Days 100%
26 Licensed Practical Nurse
% of Days 100%
14 Registered Nurse
% of Days 100%
5 Respiratory Therapy Technician
% of Days 75%
5 Other Dietary Services Staff
% of Days 80%
2 Clinical Nurse Specialist
% of Days 81%
4 Physical Therapy Assistant
% of Days 79%
3 Physical Therapy Aide
% of Days 74%
2 Dietitian
% of Days 73%
1 Administrator
% of Days 70%
1 Mental Health Service Worker
% of Days 71%
1 Dental Services Staff
% of Days 70%
3 Qualified Social Worker
% of Days 71%
2 Physician Assistant
% of Days 58%
2 Speech Language Pathologist
% of Days 52%
2 Nurse Practitioner
% of Days 37%
2 Medical Director
% of Days 58%
4 Occupational Therapy Assistant
% of Days 40%

Facility Characteristics

Source: CMS Long-Term Care Facility Characteristics (Data as of Jan 2026)

Total census
93 residents
Residents by payment source
Medicare
9 residents (9.7%)
Medicaid
68 residents (73.1%)
Private pay or other
16 residents (17.2%)
Programs & Services
Residents' Group

Residents meet regularly to discuss policies, care quality, and activities

Active Resident Council

Organized group of residents that meets regularly to discuss facility policies, quality of life, and activities.

Quality of care over time

These measures show how residents usually do over time at this home, based on health outcomes and preventive care.

High-risk clinical events score Info A composite score based on pressure ulcers, falls with injury, weight loss, walking ability decline, and activities of daily living decline. 9.9
15% better than Vermont average

Vermont average: 11.6

Functional decline score Info A composite score based on activities of daily living decline, walking ability decline, and incontinence. 19.9
12% better than Vermont average

Vermont average: 22.7

Long-stay resident measures
Average Vermont avg: 2.6 Info CMS star rating based on long-stay quality measure performance. 5 stars = significantly above average, 1 star = significantly below average.
Need for Help with Daily Activities Increased Info Percent of long-stay residents whose need for help with daily activities has increased 11.1%
46% better than Vermont average

Vermont average: 20.4%

Walking Ability Worsened Info Percent of long-stay residents whose ability to move independently worsened 21.2%
5% worse than Vermont average

Vermont average: 20.1%

Low Risk Residents with Bowel/Bladder Incontinence Info Percent of low risk long-stay residents who lose control of their bowels or bladder 27.6%
In line with Vermont average

Vermont average: 27.6%

Falls with Major Injury Info Percent of long-stay residents experiencing one or more falls with major injury 2.5%
58% better than Vermont average

Vermont average: 5.8%

High Risk Residents with Pressure Ulcers Info Percent of long-stay high risk residents with pressure ulcers 6.3%
In line with Vermont average

Vermont average: 6.4%

Urinary Tract Infection Info Percent of long-stay residents with a urinary tract infection 2.5%
In line with Vermont average

Vermont average: 2.5%

Lost Too Much Weight Info Percent of long-stay residents who lose too much weight 8.7%
58% worse than Vermont average

Vermont average: 5.5%

Depressive Symptoms Info Percent of long-stay residents who have depressive symptoms 2.9%
71% better than Vermont average

Vermont average: 10.0%

Antipsychotic Use Info Percent of long-stay residents who received an antipsychotic medication 24.4%
26% worse than Vermont average

Vermont average: 19.4%

Pneumococcal Vaccine Info Percent of long-stay residents assessed and appropriately given the pneumococcal vaccine 97.3%
In line with Vermont average

Vermont average: 95.6%

Influenza Vaccine Info Percent of long-stay residents assessed and appropriately given the seasonal influenza vaccine 97.7%
In line with Vermont average

Vermont average: 97.6%

Hospitalizations per 1,000 days Info Number of hospitalizations per 1,000 long-stay resident days. 1.31
9% better than Vermont average

Vermont average: 1.44

ED visits per 1,000 days Info Number of outpatient emergency department visits per 1,000 long-stay resident days. 0.92
63% better than Vermont average

Vermont average: 2.48

Short-stay resident measures
Above average Vermont avg: 3.0 Info CMS star rating based on short-stay quality measure performance. 5 stars = much above average, 1 star = much below average.
Pneumococcal Vaccine Info Percent of short-stay residents assessed and appropriately given the pneumococcal vaccine 92.4%
7% better than Vermont average

Vermont average: 86.3%

Antipsychotic medication increase Info Percent of short-stay residents who newly received an antipsychotic medication 0.9%
49% better than Vermont average

Vermont average: 1.7%

Influenza Vaccine Info Percent of short-stay residents assessed and appropriately given the seasonal influenza vaccine 86.8%
10% better than Vermont average

Vermont average: 78.9%

Re-hospitalized after SNF stay Info Percentage of short-stay residents who were re-hospitalized after their nursing home admission. 17.7%
18% better than Vermont average

Vermont average: 21.5%

Emergency department visits Info Percentage of short-stay residents who had an outpatient emergency department visit. 12.4%
30% better than Vermont average

Vermont average: 17.6%

Falls with major injury Info Percentage of SNF residents who experience falls with major injury during their stay. 0.0%
100% better than Vermont average

Vermont average: 0.8%

Ability to care for self at discharge Info Percentage of residents at or above expected ability to care for themselves at discharge. 45.6%
15% worse than Vermont average

Vermont average: 53.7%

Successful return to home or community Info Rate of successful return to home or community from a skilled nursing facility. 58.5%
16% better than Vermont average

Vermont average: 50.6%

Penalties and fines

Federal penalties imposed by CMS for regulatory violations, including civil money penalties (fines) and denials of payment for new Medicare/Medicaid admissions.

Source: CMS Penalties Database (Data as of Jan 2026)

Total fines amount $86K
33% lower than Vermont average

Vermont average: $128K

Number of fines 2
13% more fines than Vermont average

Vermont average: 1.8

Payment Denials Info Serious action where Medicare and/or Medicaid temporarily stops payments for new residents until issues are fixed. 0
100% fewer payment denials than Vermont average

Vermont average: 0.5

Fines amount comparison
This facility $86K
Vermont average $128K
Penalty History

Penalties are imposed by CMS for violations of federal nursing home regulations.

Civil Money Penalty Info Fines imposed for noncompliance, which can be assessed per day or per instance of violation. May 29, 2024
$13K
Civil Money Penalty Info Fines imposed for noncompliance, which can be assessed per day or per instance of violation. Oct 11, 2023
$73K

Last updated: Jan 2026

Guides for Better Senior Living

Care Cost Calculator: See Prices in Your Area

Nursing Home Data Explorer

Don’t Wait Too Long: 7 Red Flag Signs Your Parent Needs Assisted Living Now

The True Cost of Assisted Living in 2025 – And How Families Are Paying For It

Understanding Senior Living Costs: Pricing Models, Discounts & Financial Assistance

Financial Aid for Vermont Seniors

Get financial aid guidance

Choices for Care

VT Medicaid CFC

Age 65+ or disabled, Vermont resident, Medicaid-eligible, nursing home-level care need.

~$2,829/month (300% FBR, individual).

$2,000 (individual), $3,000 (couple).

Small state; rural access emphasis.

Vermont Assistive Community Care Services (ACCS)

VT ACCS

Age 65+, Vermont resident, in approved residential setting.

~$1,732/month (individual, varies).

$2,000 (individual).

Facility-based; limited funding.

Older Americans Act (OAA) Services

Vermont OAA Services

Age 60+, VT resident; no income/asset limits.

None; donations encouraged.

Not assessed.

5 AAAs (Age Well, CVCOA, NEKCOA, Senior Solutions, SVCOA); rural focus.

Medicare Savings Program (MSP)

Vermont Medicare Savings Program

Age 65+ or disabled, VT resident, Medicare Part A/B.

~$2,510/month (QMB), ~$3,380/month (SLMB), ~$3,598/month (QI)—individual.

$9,430 (individual), $14,130 (couple).

Includes Extra Help for Part D; no waitlist.

Fuel Assistance Program

Vermont Seasonal Fuel Assistance

Age 60+ prioritized, VT resident, low-income household.

~$3,970/month (185% FPL).

Not assessed.

Covers oil, gas, wood; emergency aid available.

Family Caregiver Support Program (FCSP)

Vermont Family Caregiver Support Program

Caregivers of 60+ needing care or 55+ caregivers of others; VT resident; 2+ ADLs.

No strict cap; prioritizes low-income (~$24,980/year).

Not assessed.

Includes grandparent caregivers; serves ~1,000 annually.

Senior Community Service Employment Program (SCSEP)

Vermont SCSEP

Age 55+, unemployed, low-income, VT resident.

~$1,983/month (125% FPL).

Not specified.

Priority for veterans, rural residents; AARP partnership.

VA Aid and Attendance (A&A) and Housebound Benefits

Vermont VA Aid and Attendance/Housebound

Age 65+ or disabled veteran/spouse, VT resident, wartime service, ADL help (A&A) or homebound.

Net income < ~$1,984/month (veteran with dependent, A&A); pension offsets income.

~$155,356 (net worth).

High rural veteran use; supports care costs.

Property Tax Adjustment Assistance

Vermont Property Tax Credit

Age 65+ (or all ages), VT resident, homeowner/renter, income-based.

~$47,000/year (household); caps credit at ~$128,000.

Not assessed.

Credits up to $8,000; serves ~20,000 households.

Commodity Supplemental Food Program (CSFP)

Vermont CSFP

Age 60+, VT resident, low-income.

~$1,632/month (130% FPL).

Not assessed.

Serves ~5,000 seniors via 50+ drop sites.

Attendant Services Program (ASP)

Vermont Attendant Services Program

Age 65+ (or disabled 18+), VT resident, severe/permanent disability, 2+ ADL needs.

Medicaid-eligible (~$2,829/month) or near-eligible for General Fund.

$2,000 (individual) for Medicaid; varies for General Fund.

Participants hire/manage caregivers; serves ~500 annually.