Burlington Health & Rehabilitation Center
Nursing Home, Memory Care, Respite Care & Hospice Care · South Burlington, VT
CMS overall rating Info The Overall CMS Rating is scored from 1 to 5 stars and combines results from health inspections, staffing levels, and quality measures. Health inspections carry the most weight. Staffing and quality scores can increase or decrease the final rating based on performance compared to state and national standards.

Burlington Health & Rehabilitation Center

Nursing Home, Memory Care, Respite Care & Hospice Care · South Burlington, VT
CMS overall rating Info The Overall CMS Rating is scored from 1 to 5 stars and combines results from health inspections, staffing levels, and quality measures. Health inspections carry the most weight. Staffing and quality scores can increase or decrease the final rating based on performance compared to state and national standards.
Calculator: See prices in your area
Burlington Health & Rehabilitation Center accepts Medicare, Medicaid, and private pay.

Overview of Burlington Health & Rehabilitation Center

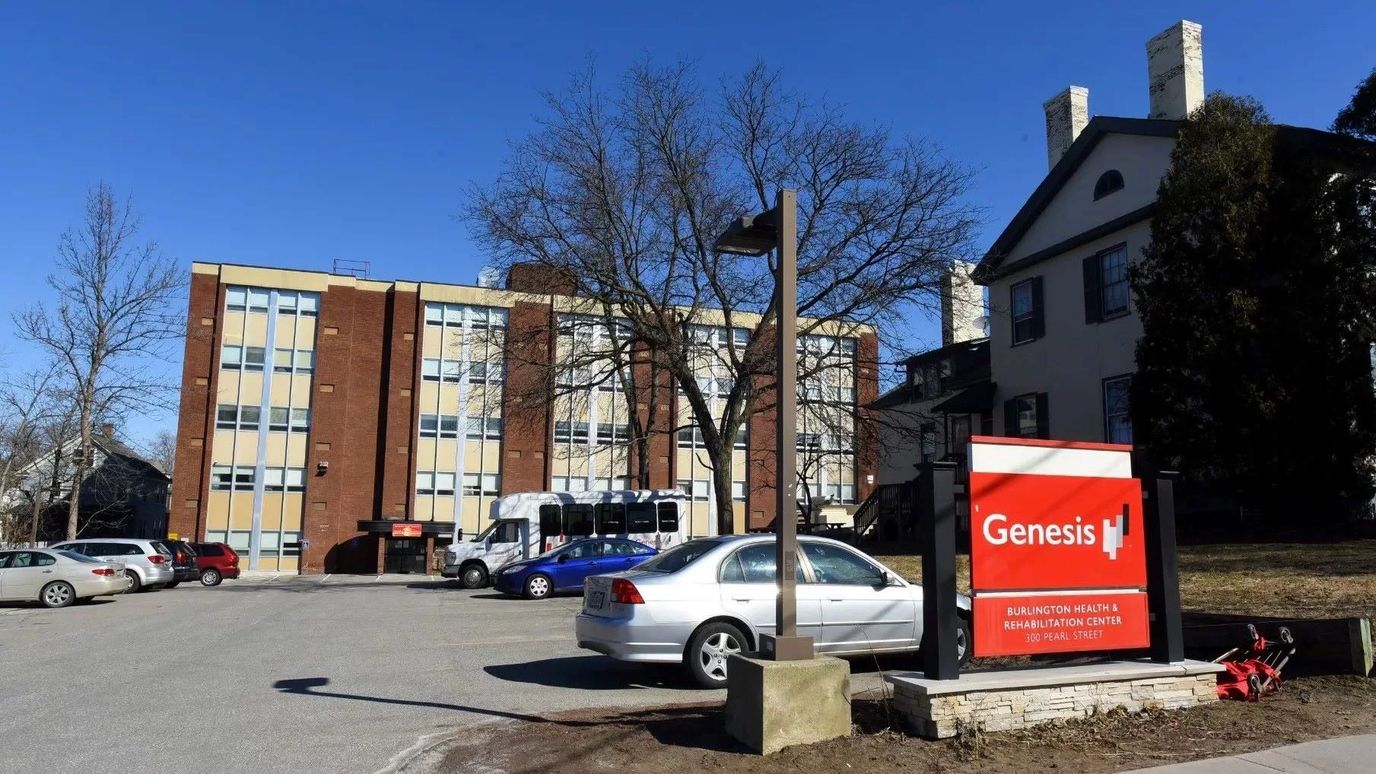
Burlington Health & Rehabilitation Center is a comprehensive care facility that offers skilled nursing and medical rehabilitation, catering to both short-term and extended stays. Notably, they are VA contracted, making their nursing home accessible to veterans. Their dedicated clinical care teams focus on assisting residents in their journey to recovery and overall well-being.
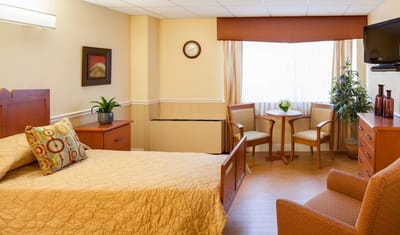
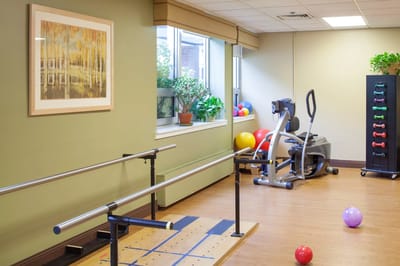
With a wide range of services available, including dietary and nutrition support, dental care, dementia care, personal care, pet therapy, wound care, x-ray services, and social activities, Burlington Health & Rehabilitation Center is equipped to meet various nursing home requirements. Their strategic location provides convenient access to nursing homes nearby, enhancing the accessibility of their services. Additionally, residents can benefit from amenities such as spa services, scenic views, pet-friendly policies, Internet access, a beauty salon, barber services, comfortable lounge areas, and spacious rooms, ensuring a well-rounded and supportive environment for all residents.

(262) 763-9531

Quality ratings

Measured by Centers for Medicare & Medicaid Services (CMS)

Overall rating Info The Overall CMS Rating combines results from health inspections, staffing levels and quality measures. Health inspections carry the most weight. Staffing and quality scores can increase or decrease the final rating based on performance compared to state and national standards.
▼ 24.2% Below VT avg. ▼ 24.2% Below VT avg.Click the badge to see the full State ranking.Click here to see the full State ranking.
Health Inspection Info Based on the results of the facility's three most recent standard inspections and any complaint investigations. CMS reviews the number, scope, and severity of deficiencies, with more recent findings weighted more heavily.
▼ 21.6% Below VT avg. ▼ 21.6% Below VT avg.Click the badge to see the full State ranking.Click here to see the full State ranking.
Staffing Info Measures average nursing staff hours per resident per day, including Registered Nurses (RNs) and total nursing staff. Ratings are adjusted based on the level of care residents require and are compared to state and national benchmarks.
▼ 35.3% Below VT avg. ▼ 35.3% Below VT avg.Click the badge to see the full State ranking.Click here to see the full State ranking.
Quality Measures Info Based on clinical and physical health indicators reported to CMS, such as hospital readmissions, falls, pressure ulcers, and improvements in mobility. These measures reflect how well residents' health needs are being managed.
▲ 29.4% Above VT avg. ▲ 29.4% Above VT avg.Click the badge to see the full State ranking.Click here to see the full State ranking.

Staffing hours breakdown

Info Daily nursing hours per resident by staff type, reported to CMS. Higher is generally better — compare this facility to state and national averages to see where staffing stands.

Hours per resident per day — compared to Vermont state averages

Total nursing care / resident Info This home is ranked 9th out of 12 homes in Vermont. Total adjusted nursing hours per resident per day, combining RN, LPN, and aide time. CMS adjusts this for case-mix so facilities can be fairly compared.
3h 30m per day
Rank #9 / 12Nurse hours — State benchmarkedThis home is ranked 9th out of 12 homes in Vermont. Shows adjusted nurse hours per resident per day benchmarked to the Vermont average, with a ranking across 12 Vermont SNFs. More hours mean more direct care. The national average is about 3.5 hrs; below 3.0 is a red flag.Click the rank badge to see the full State ranking.Click here to see the full State ranking.
This facility Vermont avg (4h 13m per day)
vs Vermont avg
-17%

3 of 6 metrics below state avg

Standout metric Physical Therapist is +67% above state avg
Staff typeHours / Day / Residentvs state avg
Registered Nurse (RN) Info RNs hold the highest nursing license and can assess residents, interpret test results, and direct care plans. More RN hours per day often signals stronger clinical oversight and faster response to health changes. 35m per day ▼ 29% State avg: 49m per day · National avg: 41m per day
LPN / LVN Info Licensed Practical Nurses (LPNs) or Licensed Vocational Nurses (LVNs) deliver routine hands-on care — medication administration, wound dressing, and monitoring vital signs. They work under RN supervision and make up a large share of daily bedside care. 1h 2m per day ▲ 17% State avg: 53m per day · National avg: 52m per day
Nurse Aide Info Certified Nurse Aides (CNAs) provide the most direct day-to-day assistance: bathing, dressing, feeding, and mobility. Nurse aide hours are typically the largest staffing category and directly affect residents' quality of life. 2h 22m per day ▼ 8% State avg: 2h 35m per day · National avg: 2h 21m per day
Weekend Total Nursing Info Combined nursing hours (RN + LPN + Nurse Aide) per resident per day on weekends. Staffing often drops on weekends — this figure reveals whether the facility maintains adequate coverage outside of weekday hours. 3h 42m per day ■ Avg State avg: 3h 41m per day · National avg: 3h 26m per day
Physical Therapist Info Hours per resident per day provided by licensed Physical Therapists (PTs) or PT Assistants. PT services help residents recover mobility after injury or illness and are especially important for post-acute (short-stay) rehabilitation. 10m per day ▲ 67% State avg: 6m per day · National avg: 4m per day
Weekend RN Info Registered nurse hours specifically on weekends. Facilities sometimes reduce RN presence on Saturdays and Sundays — a low weekend RN figure compared to weekday hours can indicate reduced clinical oversight when most administrative staff are absent. 20m per day ▼ 38% State avg: 32m per day · National avg: 29m per day

Types of Care at Burlington Health & Rehabilitation Center

Memory Care Respite Care Nursing Home Hospice Care

Capacity and availability

This home usually has availability

Occupancy lower than 85% suggests more openings may be available.

Lower occupancy than the Vermont average: 81%
Occupancy rate 65.8% Rank #9 / 12Occupancy rate — State benchmarkedThis home is ranked 9th out of 12 homes in Vermont. Shows this facility's occupancy rate versus the Vermont average, with its Statewide rank out of 12. Higher occupancy signals strong local demand and financial stability.Click the rank badge to see the full State ranking.Click here to see the full State ranking.
Avg. Length of Stay 265 days
Occupancy rate
65.8% Rank #9 / 12Occupancy rate — State benchmarkedThis home is ranked 9th out of 12 homes in Vermont. Shows this facility's occupancy rate versus the Vermont average, with its Statewide rank out of 12. Higher occupancy signals strong local demand and financial stability.Click the rank badge to see the full State ranking.Click here to see the full State ranking.
Avg. Length of Stay
265 days
Walk Score
Walk Score: 86 / 100 Rank #6 / 70Walk Score — State benchmarkedThis home is ranked 6th out of 70 homes in Vermont. Shows how walkable this facility's neighborhood is compared to the average Walk Score across Vermont SNFs. Higher scores benefit residents, families, and staff.Click the rank badge to see the full State ranking.Click here to see the full State ranking.
Very walkable. Most errands can be accomplished on foot, and many essentials are within a short walk.

About this community

License Details

Facility TypeNursing Home
CountyChittenden

Contact Information

Fax802-863-8016

Contact Burlington Health & Rehabilitation Center

Inspection History

In Vermont, the Department of Disabilities, Aging and Independent Living is the authority responsible for inspecting facilities and investigating complaints to protect resident well-being.

Since 2023 · 3 years of data 46 deficiencies

Inspection Scorecard Info This scorecard compares key inspection, citation, and complaint metrics at this facility against the Vermont state average. Metrics rated ≥15% worse than average are highlighted in red; those ≥15% better are highlighted in green.

Since 2023 vs. Vermont state average
Overall vs. VT average 2 Worse Metrics worse than Vermont average:
• Total deficiencies (12% above)
• Deficiencies per year (12% above)
0 Better No metrics in this bucket.
Latest Inspection December 17, 2025 Other

Deficiencies Info Deficiencies are formal regulatory issues recorded during state inspections.

This FacilityVT Averagevs. VT Avg
Total deficiencies Info Formal regulatory issues recorded by inspectors across all inspection types. 4641 This facility has 12% more total deficiencies than a typical Vermont nursing home (46 vs. VT avg 41).↑ 12% worse
Deficiencies per year Info Average deficiencies per year since 2023. 15.313.7 This facility has 12% more deficiencies per year than a typical Vermont nursing home (15.3 vs. VT avg 13.7).↑ 12% worse

Inspection Reports Summary Info An editor-reviewed summary of the themes and findings across this facility's recent inspection reports.

The most recent inspection on December 17, 2025, identified deficiencies related to environmental cleanliness, use of compromised resident equipment, and inadequate measures during an abuse investigation. Earlier inspections showed a pattern of issues including resident abuse incidents, medication management problems, staffing shortages, and lapses in food service and infection control. Complaint investigations substantiated multiple abuse cases and failures to protect residents, as well as deficiencies in care planning and neglect related to medical device care. Enforcement actions such as fines or license suspensions were not listed in the available reports. The facility’s inspection history reflects ongoing challenges with resident safety and care, with no clear improvement trend evident.

Read the full inspection reports for this facility, including detailed findings and corrective actions.

Show Inspection Reports

Health Inspection History

Inspections since 2022
Total health inspections 11

Vermont average 6.5


Last Health inspection on May 2025

Total health citations
35 Rank #8 / 12Health citations — State benchmarkedThis home is ranked 8th out of 12 homes in Vermont. Shows this facility's total health deficiency citations benchmarked to the Vermont State average, with a ranking across all 12 VT SNFs. Lower citation counts earn a better rank.Click the rank badge to see the full State ranking.Click here to see the full State ranking.

Vermont average 28.9

Citations per inspection
3.18 Rank #3 / 12Citations per inspection — State benchmarkedThis home is ranked 3rd out of 12 homes in Vermont. Shows average deficiency citations per CMS inspection for this facility versus the Vermont mean across 12 SNFs with citation data. Lower is better.Click the rank badge to see the full State ranking.Click here to see the full State ranking.

Vermont average 4.31


Health citations are formal notices following inspections when they fail to comply with safety and care standards.

8 of 35 citations resulted from standard inspections; 23 of 35 resulted from complaint investigations; and 4 of 35 came from combined inspections (standard and complaint).

Breakdown of citation severity (last 4 years)
Critical Health citations
3
329% worse than Vermont average

Vermont average: 0.7


Serious Health citations
4 Rank #5 / 7Serious citations (G–I) — State benchmarkedThis home is ranked 5th out of 7 homes in Vermont. Shows G–I scope serious health citations for this facility versus other Vermont SNFs. Lower counts rank better.Click the rank badge to see the full State ranking.Click here to see the full State ranking.
111% worse than Vermont average

Vermont average: 1.9

3 critical citations Vermont average: 0.7

4 serious citations Vermont average: 1.9

26 moderate citations Vermont average: 24.6

2 minor citations Vermont average: 1.5
Citations history (last 4 years)
Abuse/Neglect moderate citation May 20, 2025
Corrected

Abuse/Neglect moderate citation May 20, 2025
Corrected

Nursing Services moderate citation Dec 04, 2024
Corrected

Nutrition minor citation Dec 04, 2024
Corrected

Staffing Data

Reporting period: October 1 – December 31, 2025 (Q4 2025). Source: CMS Payroll-Based Journal report.

Total staff 138
Employees 55
Contractors 83
Staff to resident ratio 1.48:1
12% worse than Vermont average
Vermont average ratio: 1.68:1 Vermont average ratio: 1.68:1See full Vermont ranking
Avg staff/day 61
Average shift 9.4 hours
15% better than Vermont average
Vermont average: 8.2 hours Vermont average shift: 8.2 hoursSee full Vermont ranking
Total staff hours (quarter) 52,854

Nursing staff breakdown

Q4 2025 · Oct 1 – Dec 31 More info This data comes from the CMS Payroll-Based Journal report covering October 1 – December 31, 2025.
Registered Nurse

Manages medical care and health needs.

RN Staff 16
Average shift length Info Average shift length. Calculated as total hours divided by days worked and average staff per day. 9.1 hours

This role is partially covered by contractors.

Licensed Practical Nurse

Assists with medical care and medications.

LPN Staff 31
Average shift length Info Average shift length. Calculated as total hours divided by days worked and average staff per day. 10.8 hours

This role is partially covered by contractors.

Certified Nursing Assistant

Helps with daily care and mobility.

CNA Staff 55
Average shift length Info Average shift length. Calculated as total hours divided by days worked and average staff per day. 10.3 hours

This role is partially covered by contractors.

Contractor staffing

Q4 2025 · Oct 1 – Dec 31 More info This data comes from the CMS Payroll-Based Journal report covering October 1 – December 31, 2025.

Total hours from contractors

67.1%

35,491 contractor hours this quarter

Certified Nursing Assistant: 45 Licensed Practical Nurse: 27 Registered Nurse: 3 Occupational Therapy Assistant: 3 Medical Director: 2 Other Physician: 2 Clinical Nurse Specialist: 1

Staff by category

Q4 2025 · Oct 1 – Dec 31 More info This data comes from the CMS Payroll-Based Journal report covering October 1 – December 31, 2025.
Certified Nursing Assistant10455526,04692100%10.3
Licensed Practical Nurse4273111,39292100%10.8
Registered Nurse133165,11292100%9.1
Respiratory Therapy Technician5051,7197480%7.1
Clinical Nurse Specialist1121,5118997%10.2
Physical Therapy Assistant5051,3177986%7
Other Dietary Services Staff4048818795%7.9
Dietitian1016947582%9.3
Therapeutic Recreation Specialist2025717582%7.3
Physical Therapy Aide3035306672%7.6
Mental Health Service Worker1015226571%8
Administrator1015206571%8
Dental Services Staff1014906470%7.6
Other Physician0224465358%4.2
Qualified Social Worker3033936773%5.6
Speech Language Pathologist1013644751%7.7
Medical Director0222785358%3.5
Occupational Therapy Assistant033703336%1.8
55 Certified Nursing Assistant
% of Days 100%
31 Licensed Practical Nurse
% of Days 100%
16 Registered Nurse
% of Days 100%
5 Respiratory Therapy Technician
% of Days 80%
2 Clinical Nurse Specialist
% of Days 97%
5 Physical Therapy Assistant
% of Days 86%
4 Other Dietary Services Staff
% of Days 95%
1 Dietitian
% of Days 82%
2 Therapeutic Recreation Specialist
% of Days 82%
3 Physical Therapy Aide
% of Days 72%
1 Mental Health Service Worker
% of Days 71%
1 Administrator
% of Days 71%
1 Dental Services Staff
% of Days 70%
2 Other Physician
% of Days 58%
3 Qualified Social Worker
% of Days 73%
1 Speech Language Pathologist
% of Days 51%
2 Medical Director
% of Days 58%
3 Occupational Therapy Assistant
% of Days 36%

Penalties and fines

Includes penalties issued in 2023-2024

Federal penalties imposed by CMS for regulatory violations, including civil money penalties (fines) and denials of payment for new Medicare/Medicaid admissions.

Source: CMS Penalties Database (Data as of Jan 2026)

Total fines amount $86K Rank #9 / 12Federal fines — State benchmarkedThis home is ranked 9th out of 12 homes in Vermont. Shows this facility's cumulative CMS federal fine dollars versus the Vermont average among facilities with fines, and where it ranks among 12 skilled nursing facilities in the pool. Lower total dollars mean a better rank.Click the rank badge to see the full State ranking.Click here to see the full State ranking.
33% lower than Vermont average

Vermont average: $128K

Number of fines 2
13% more fines than Vermont average

Vermont average: 1.8

Payment Denials Info Serious action where Medicare and/or Medicaid temporarily stops payments for new residents until issues are fixed. 0
100% fewer payment denials than Vermont average

Vermont average: 0.5

Fines amount comparison
This facility $86K
Vermont average $128K
Penalty History

Penalties are imposed by CMS for violations of federal nursing home regulations.

2 penalties in the past 3 years

Multiple penalties were reported in the last 3 years.

Civil Money Penalty Info Fines imposed for noncompliance, which can be assessed per day or per instance of violation. May 29, 2024
$13K
Civil Money Penalty Info Fines imposed for noncompliance, which can be assessed per day or per instance of violation. Oct 11, 2023
$73K

Last updated: Jan 2026

Quality of care over time

These measures show how residents usually do over time at this home, based on health outcomes and preventive care.

High-risk clinical events score Info A composite score based on pressure ulcers, falls with injury, weight loss, walking ability decline, and activities of daily living decline. 9.9
15% better than Vermont average

Vermont average: 11.6

Functional decline score Info A composite score based on activities of daily living decline, walking ability decline, and incontinence. 19.9
12% better than Vermont average

Vermont average: 22.7

Long-stay resident measures
Average Vermont avg: 2.5 Info CMS star rating based on long-stay quality measure performance. 5 stars = significantly above average, 1 star = significantly below average.
Need for Help with Daily Activities Increased Info Percent of long-stay residents whose need for help with daily activities has increased 11.1%
46% better than Vermont average

Vermont average: 20.4%

Walking Ability Worsened Info Percent of long-stay residents whose ability to move independently worsened 21.2%
5% worse than Vermont average

Vermont average: 20.1%

Low Risk Residents with Bowel/Bladder Incontinence Info Percent of low risk long-stay residents who lose control of their bowels or bladder 27.6%
In line with Vermont average

Vermont average: 27.6%

Falls with Major Injury Info Percent of long-stay residents experiencing one or more falls with major injury 2.5%
58% better than Vermont average

Vermont average: 5.8%

High Risk Residents with Pressure Ulcers Info Percent of long-stay high risk residents with pressure ulcers 6.3%
In line with Vermont average

Vermont average: 6.4%

Urinary Tract Infection Info Percent of long-stay residents with a urinary tract infection 2.5%
In line with Vermont average

Vermont average: 2.5%

Lost Too Much Weight Info Percent of long-stay residents who lose too much weight 8.7%
58% worse than Vermont average

Vermont average: 5.5%

Depressive Symptoms Info Percent of long-stay residents who have depressive symptoms 2.9%
71% better than Vermont average

Vermont average: 10.0%

Antipsychotic Use Info Percent of long-stay residents who received an antipsychotic medication 24.4%
26% worse than Vermont average

Vermont average: 19.4%

Pneumococcal Vaccine Info Percent of long-stay residents assessed and appropriately given the pneumococcal vaccine 97.3%
In line with Vermont average

Vermont average: 95.6%

Influenza Vaccine Info Percent of long-stay residents assessed and appropriately given the seasonal influenza vaccine 97.7%
In line with Vermont average

Vermont average: 97.6%

Hospitalizations per 1,000 days Info Number of hospitalizations per 1,000 long-stay resident days. 1.31
9% better than Vermont average

Vermont average: 1.44

ED visits per 1,000 days Info Number of outpatient emergency department visits per 1,000 long-stay resident days. 0.92
63% better than Vermont average

Vermont average: 2.48

Short-stay resident measures
Above average Vermont avg: 3.0 Info CMS star rating based on short-stay quality measure performance. 5 stars = much above average, 1 star = much below average.
Pneumococcal Vaccine Info Percent of short-stay residents assessed and appropriately given the pneumococcal vaccine 92.4%
7% better than Vermont average

Vermont average: 86.3%

Antipsychotic medication increase Info Percent of short-stay residents who newly received an antipsychotic medication 0.9%
49% better than Vermont average

Vermont average: 1.7%

Influenza Vaccine Info Percent of short-stay residents assessed and appropriately given the seasonal influenza vaccine 86.8%
10% better than Vermont average

Vermont average: 78.9%

Re-hospitalized after SNF stay Info Percentage of short-stay residents who were re-hospitalized after their nursing home admission. 17.7%
18% better than Vermont average

Vermont average: 21.5%

Emergency department visits Info Percentage of short-stay residents who had an outpatient emergency department visit. 12.4%
30% better than Vermont average

Vermont average: 17.6%

Falls with major injury Info Percentage of SNF residents who experience falls with major injury during their stay. 0.0%
100% better than Vermont average

Vermont average: 0.8%

Ability to care for self at discharge Info Percentage of residents at or above expected ability to care for themselves at discharge. 45.6%
15% worse than Vermont average

Vermont average: 53.7%

Successful return to home or community Info Rate of successful return to home or community from a skilled nursing facility. 58.5%
16% better than Vermont average

Vermont average: 50.6%

Breakdown by payment type

Medicare

47% of new residents, usually for short-term rehab.

Typical stay 2 - 3 months

Private pay

37% of new residents, often for short stays.

Typical stay 4 - 5 months

Medicaid

16% of new residents, often for long-term daily care.

Typical stay 4 - 5 years

Facility Characteristics

Source: CMS Long-Term Care Facility Characteristics (Data as of Jan 2026)

Total residents 93
Medicare
9
9.7% of residents
Medicaid
68
73.1% of residents
Private pay or other
16
17.2% of residents
Programs & Services
Residents Group

Residents meet regularly to discuss policies, care quality, and activities

Active Resident Council

Organized group of residents that meets regularly to discuss facility policies, quality of life, and activities.

Finances and operations

Privately-owned community
Operated by a business corporation.
Home revenue
$14.7M
Operating loss
-$10.2K
Privately-owned community Operated by a business corporation.
Home revenue
$14.7M Rank #10 / 11Revenue — State benchmarkedThis home is ranked 10th out of 11 homes in Vermont. Shows this facility's annual revenue compared to the Vermont SNF average. Higher revenue generally means more resources for staffing and capital — read alongside Payroll %.Click the rank badge to see the full State ranking.Click here to see the full State ranking.
Operating loss
-$10.2K
Payroll costs Info The portion of the home's budget spent on staff, including nurses, caregivers, and other employees who support care and operations. Rank #8 / 11Payroll — State benchmarkedThis home is ranked 8th out of 11 homes in Vermont. Shows total annual staff payroll benchmarked to the Vermont average. Higher payroll investment relative to peers often signals better staffing and less reliance on cheaper contract labor.Click the rank badge to see the full State ranking.Click here to see the full State ranking.
$11.1M
75.7% of revenue Rank #2 / 11Payroll % — State benchmarkedThis home is ranked 2nd out of 11 homes in Vermont. Shows payroll as a percentage of revenue versus the Vermont average. Below 25% may signal understaffing or heavy agency use — read with Staffing ratings.Click the rank badge to see the full State ranking.Click here to see the full State ranking.
Other operating costs Info All remaining costs needed to run the home, such as food, utilities, building maintenance, supplies and administrative expenses.
$3.6M
Total costs $14.7M

Who this home usually serves

TYPE OF STAY

Mostly short-term rehab stays

Most residents typically stay for a few weeks or months before returning home or moving on.

Places of interest near Burlington Health & Rehabilitation Center

Address 2.2 miles from city center Info Estimated distance in miles from Burlington's city center to Burlington Health & Rehabilitation Center's address, calculated via Google Maps. — 0.3 miles to nearest hospital (UVM Student Health Services)

Calculate Travel Distance to Burlington Health & Rehabilitation Center

Add your location

Address

Financial Assistance for
Nursing Home in Vermont

Burlington Health & Rehabilitation Center is located in Burlington, Vermont.
Here are the financial assistance programs available to residents in Vermont.

Get Financial aid guidance

Choices for Care

VT Medicaid CFC

Age 65+ or disabled
General Vermont resident, Medicaid-eligible, nursing home-level care need.
Income Limits (2025) ~$2,829/month 300% FBR, individual
Asset Limits $2,000 (individual), $3,000 (couple).
VT

Small state; rural access emphasis.

Benefits
Personal care (5-7 hours/day) Respite (240 hours/year) Adult day care (~$65/day) Assisted living options

Vermont Assistive Community Care Services (ACCS)

VT ACCS

Age 65+
General Vermont resident, in approved residential setting.
Income Limits ~$1,732/month individual, varies
Asset Limits $2,000 individual
VT

Facility-based; limited funding.

Benefits
Personal care (2-4 hours/day in facility) Respite (varies) Basic support services

Older Americans Act (OAA) Services

Vermont OAA Services

Age 60+
General VT resident; no income/asset limits.
Income Limits (2025) None; donations encouraged.
Asset Limits Not assessed.
VT

5 AAAs (Age Well, CVCOA, NEKCOA, Senior Solutions, SVCOA); rural focus.

Benefits
Meals (~$5-$7/meal) Transportation Homemaker services (~4 hours/week) Respite (~5 days/year) Legal aid

Medicare Savings Program (MSP)

Vermont Medicare Savings Program

Age 65+ or disabled
General VT resident, Medicare Part A/B.
Income Limits (2025) ~$2,510/month (QMB), ~$3,380/month (SLMB), ~$3,598/month (QI)—individual.
Asset Limits $9,430 (individual), $14,130 (couple).
VT

Includes Extra Help for Part D; no waitlist.

Benefits
Covers Part B premiums ($174.70/month) Deductibles ($240/year) Copays (~20%)

Fuel Assistance Program

Vermont Seasonal Fuel Assistance

Age 60+ prioritized
General VT resident, low-income household.
Income Limits (2025) ~$3,970/month 185% FPL
Asset Limits Not assessed.
VT

Covers oil, gas, wood; emergency aid available.

Benefits
Heating aid ($300-$1,000/season) Crisis aid ($500 max)

Family Caregiver Support Program (FCSP)

Vermont Family Caregiver Support Program

Age
General Caregivers of 60+ needing care or 55+ caregivers of others; VT resident; 2+ ADLs.
Income Limits (2025) No strict cap; prioritizes low-income ~$24,980/year
Asset Limits Not assessed.
VT

Includes grandparent caregivers; serves ~1,000 annually.

Benefits
Respite (4-6 hours/week or 5 days/year) Adult day care ($60/day) Training Supplies (~$500/year)

VA Aid and Attendance (A&A) and Housebound Benefits

Vermont VA Aid and Attendance/Housebound

Age 65+ or disabled veteran/spouse
General VT resident, wartime service, ADL help (A&A) or homebound.
Income Limits (2025) Net income < ~$1,984/month (veteran with dependent, A&A); pension offsets income.
Asset Limits ~$155,356 net worth
VT

High rural veteran use; supports care costs.

Benefits
Cash (~$1,433-$2,642/month veteran, ~$951-$1,318 spouse) for care costs

Property Tax Adjustment Assistance

Vermont Property Tax Credit

Age 65+ (or all ages)
General VT resident, homeowner/renter, income-based.
Income Limits (2025) ~$47,000/year (household); caps credit at ~$128,000.
Asset Limits Not assessed.
VT

Credits up to $8,000; serves ~20,000 households.

Benefits
Tax credit (~$500-$2,500 avg., up to $8,000 max) reduces property tax

Commodity Supplemental Food Program (CSFP)

Vermont CSFP

Age 60+
General VT resident, low-income.
Income Limits (2025) ~$1,632/month 130% FPL
Asset Limits Not assessed.
VT

Serves ~5,000 seniors via 50+ drop sites.

Benefits
Monthly food box (~$50 value) with shelf-stable goods (e.g., cereal, canned goods)

Attendant Services Program (ASP)

Vermont Attendant Services Program

Age 65+ (or disabled 18+)
General VT resident, severe/permanent disability, 2+ ADL needs.
Income Limits (2025) Medicaid-eligible (~$2,829/month) or near-eligible for General Fund.
Asset Limits $2,000 (individual) for Medicaid; varies for General Fund.
VT

Participants hire/manage caregivers; serves ~500 annually.

Benefits
Personal care (4-6 hours/day) Respite (~5 days/year) Limited supplies

Compare Nursing Home around Burlington

The information below is reported by the Vermont Department of Disabilities, Aging and Independent Living.

3 facilities compared · CMS & VT Dept. of Health data

Filter by care type
Burlington Health & Rehabilitation Center
NH

Nursing Home Licensed facility providing 24/7 skilled nursing care for residents with complex, ongoing medical needs. Staffed by RNs, LPNs, and CNAs. Inspected and star-rated annually by CMS. Accepts Medicare (short-term rehab) and Medicaid (long-term care).

AL

Assisted Living A licensed, long-term care setting for seniors or individuals with disabilities who need help with daily activities — like bathing, dressing, and medication management — but not 24-hour skilled nursing. Offers housing, meals, and around-the-clock support while aiming to maximize resident independence.

Burlington (Old North End)126 65.8% -19%3.49 -1%-18%$85.8k353.27105 86 -$14.7M$11.1M75.7%475014
Birchwood Terrace Rehab and Healthcare
NH

Nursing Home Licensed facility providing 24/7 skilled nursing care for residents with complex, ongoing medical needs. Staffed by RNs, LPNs, and CNAs. Inspected and star-rated annually by CMS. Accepts Medicare (short-term rehab) and Medicaid (long-term care).

AL

Assisted Living A licensed, long-term care setting for seniors or individuals with disabilities who need help with daily activities — like bathing, dressing, and medication management — but not 24-hour skilled nursing. Offers housing, meals, and around-the-clock support while aiming to maximize resident independence.

Burlington (New North End)144 86.8% +7%4.06 -2%-5%$127.8k204.01130 36 Alter Rubin$18.9M$11.3M59.4%475003
Elderwood at Burlington
NH

Nursing Home Licensed facility providing 24/7 skilled nursing care for residents with complex, ongoing medical needs. Staffed by RNs, LPNs, and CNAs. Inspected and star-rated annually by CMS. Accepts Medicare (short-term rehab) and Medicaid (long-term care).

AL

Assisted Living A licensed, long-term care setting for seniors or individuals with disabilities who need help with daily activities — like bathing, dressing, and medication management — but not 24-hour skilled nursing. Offers housing, meals, and around-the-clock support while aiming to maximize resident independence.

Burlington (New North End)150 72.9% -10%3.71 +21%-13%$392.5k837.615121 7 98 Starr Farm Road Operating Holdco LLC$20.5M$13.9M67.5%475030

Frequently Asked Questions about Burlington Health & Rehabilitation Center

What neighborhood is Burlington Health & Rehabilitation Center in?

Burlington Health & Rehabilitation Center is in the Old North End neighborhood of Burlington.

Is Burlington Health & Rehabilitation Center in a walkable area?

Burlington Health & Rehabilitation Center has a walk score of 86. Very walkable. Most errands can be accomplished on foot, and many essentials are within a short walk.

Who is the administrator of Burlington Health & Rehabilitation Center?

field_administrator is the administrator of Burlington Health & Rehabilitation Center.

What is the phone number of Burlington Health & Rehabilitation Center?

(262) 763-9531 will put you in contact with the team at Burlington Health & Rehabilitation Center.

What county is Burlington Health & Rehabilitation Center located in?

Burlington Health & Rehabilitation Center is in Chittenden County.

Is Burlington Health & Rehabilitation Center Medicare or Medicaid certified?

Yes — Burlington Health & Rehabilitation Center is a CMS-certified provider of Medicare and Medicaid.

Guides for Better Senior Living

Care Cost Calculator: See Prices in Your Area

Nursing Home Data Explorer

Don’t Wait Too Long: 7 Red Flag Signs Your Parent Needs Assisted Living Now

The True Cost of Assisted Living in 2025 – And How Families Are Paying For It

Understanding Senior Living Costs: Pricing Models, Discounts & Financial Assistance

Explore Open Rooms
1 Contact details
2 What type of senior care service are you looking for?
3 What budget do you have in mind for senior care?
4 How soon do you need to find care?
5 Additional details

Thank you for your interest!

Our team will be in touch shortly to help with next steps.