Caring Angel Home Health
Nursing Home, Home Care, Hospice Care, Memory Care & Respite Care · Smyrna, DE
CMS overall rating Info CMS (the Centers for Medicare & Medicaid Services) is the federal agency that rates nursing home quality. Its Overall Rating runs from 1 to 5 stars, combining health inspections, staffing, and quality measures, with inspections weighted most heavily.

Caring Angel Home Health

Nursing Home, Home Care, Hospice Care, Memory Care & Respite Care · Smyrna, DE
CMS overall rating Info CMS (the Centers for Medicare & Medicaid Services) is the federal agency that rates nursing home quality. Its Overall Rating runs from 1 to 5 stars, combining health inspections, staffing, and quality measures, with inspections weighted most heavily.
Calculator: See prices in your area
Caring Angel Home Health accepts Medicare, Medicaid, and private pay.

Overview of Caring Angel Home Health

With the seniors’ wellness in mind, Caring Angel Home Health based in Main Street, Smyrna, DE, is a notable home health provider providing nursing care, physical, occupational, and speech therapy, and medical social services. The home health provider ensures that seniors receive the best care and assistance they need in the comfort of their homes. Caring Angel Home Health focuses on the individuality of the seniors, providing them with care and assistance tailored to their unique needs.

Moreover, the home health provider forges a trusting relationship with the seniors and their families to ensure that their needs are heard and preferences are followed. Caring Angel Home Health enhances the quality of life of seniors within the walls of their residence, ensuring they are comfortable and safe.

Quality ratings

Measured by Centers for Medicare & Medicaid Services (CMS)

Overall rating Info The Overall CMS Rating combines results from health inspections, staffing levels and quality measures. Health inspections carry the most weight. Staffing and quality scores can increase or decrease the final rating based on performance compared to state and national standards.
▼ 39.0% Below DE avg. ▼ 39.0% Below DE avg.DE average: 3.3Click the badge to see the full State ranking.Click here to see the full State ranking.
Health Inspection Info Based on the results of the facility's three most recent standard inspections and any complaint investigations. CMS reviews the number, scope, and severity of deficiencies, with more recent findings weighted more heavily.
▼ 27.7% Below DE avg. ▼ 27.7% Below DE avg.DE average: 2.8Click the badge to see the full State ranking.Click here to see the full State ranking.
Staffing Info Measures average nursing staff hours per resident per day, including Registered Nurses (RNs) and total nursing staff. Ratings are adjusted based on the level of care residents require and are compared to state and national benchmarks.
▼ 50.3% Below DE avg. ▼ 50.3% Below DE avg.DE average: 4.0Click the badge to see the full State ranking.Click here to see the full State ranking.
Quality Measures Info Based on clinical and physical health indicators reported to CMS, such as hospital readmissions, falls, pressure ulcers, and improvements in mobility. These measures reflect how well residents' health needs are being managed.
At DE avg. At DE avg.DE average: 4.0Click the badge to see the full State ranking.Click here to see the full State ranking.

Staffing hours breakdown

Info Daily nursing hours per resident by staff type, reported to CMS. Higher is generally better — compare this facility to state and national averages to see where staffing stands.

Hours per resident per day — compared to Delaware state averages

Staff typeHours / Day / Residentvs state avg
Registered Nurse (RN) Info RNs hold the highest nursing license and can assess residents, interpret test results, and direct care plans. More RN hours per day often signals stronger clinical oversight and faster response to health changes. 27m per day ▼ 56% State avg: 1h 0m per day · National avg: 41m per day
LPN / LVN Info Licensed Practical Nurses (LPNs) or Licensed Vocational Nurses (LVNs) deliver routine hands-on care — medication administration, wound dressing, and monitoring vital signs. They work under RN supervision and make up a large share of daily bedside care. 1h 3m per day ■ Avg State avg: 1h 2m per day · National avg: 52m per day
Nurse Aide Info Certified Nurse Aides (CNAs) provide the most direct day-to-day assistance: bathing, dressing, feeding, and mobility. Nurse aide hours are typically the largest staffing category and directly affect residents' quality of life. 2h 10m per day ▼ 13% State avg: 2h 29m per day · National avg: 2h 20m per day
Weekend Total Nursing Info Combined nursing hours (RN + LPN + Nurse Aide) per resident per day on weekends. Staffing often drops on weekends — this figure reveals whether the facility maintains adequate coverage outside of weekday hours. 3h 21m per day ▼ 21% State avg: 4h 14m per day · National avg: 3h 27m per day
Physical Therapist Info Hours per resident per day provided by licensed Physical Therapists (PTs) or PT Assistants. PT services help residents recover mobility after injury or illness and are especially important for post-acute (short-stay) rehabilitation. 3m per day ▼ 76% State avg: 12m per day · National avg: 4m per day
Weekend RN Info Registered nurse hours specifically on weekends. Facilities sometimes reduce RN presence on Saturdays and Sundays — a low weekend RN figure compared to weekday hours can indicate reduced clinical oversight when most administrative staff are absent. 20m per day ▼ 52% State avg: 42m per day · National avg: 29m per day

Capacity and availability

This home usually has availability

Similar occupancy to the Delaware average: 80.7%
Occupancy rate
80.6% Rank #31 / 44Occupancy rate — State benchmarkedThis home is ranked 31st out of 44 homes in Delaware. Shows this facility's occupancy rate versus the Delaware average, with its Statewide rank out of 44. Higher occupancy signals strong local demand and financial stability.Rankings are based only on facilities in Delaware that report data for that category. Facilities without available data are excluded from the ranking.Click the rank badge to see the full State ranking.Click here to see the full State ranking.
Avg. Length of Stay
101 days
Bed community size
181-bed community Rank #2 / 73Bed count — State benchmarkedThis home is ranked 2nd out of 73 homes in Delaware. Shows this facility's certified or reported bed count compared to other Delaware facilities. Larger communities may offer more amenities, programs, and on-site services for residents and families.Rankings are based only on facilities in Delaware that report data for that category. Facilities without available data are excluded from the ranking.Click the rank badge to see the full State ranking.Click here to see the full State ranking.
A large-scale community that may provide a wide range of amenities, services, and structured programs.
Walk Score
Walk Score: 79 / 100 Rank #10 / 110Walk Score — State benchmarkedThis home is ranked 10th out of 110 homes in Delaware. Shows how walkable this facility's neighborhood is compared to the average Walk Score across Delaware facilities. Higher scores benefit residents, families, and staff.Rankings are based only on facilities in Delaware that report data for that category. Facilities without available data are excluded from the ranking.Click the rank badge to see the full State ranking.Click here to see the full State ranking.
Very walkable. Most errands can be accomplished on foot, and many essentials are within a short walk.

Therapy & Rehabilitation

1 service
Respite Care

Staffing & Medical

2 services
Licensed Nurses/CNAs
24-Hour Staffing

Amenities & Lifestyle

Specific ProgramsAlzheimer’s Care/Dementia Care, Transportation/Doctor Visit, Hospice Care/End of Life Care/After Surgery Care, Meal Preparation, Companionship/Caregiving, Personal Care/Hygiene, Caregivers
Operating HoursMon-Sun: 24/7

Contact Caring Angel Home Health

Staffing Data

Reporting period: October 1 – December 31, 2025 (Q4 2025). Source: CMS Payroll-Based Journal report.

Total staff 212
Employees 163
Contractors 49
Staff to resident ratio 1.31 : 1
20% fewer staff per resident than Delaware average
Delaware average ratio: 1.63 : 1 Delaware average ratio: 1.63 : 1See full Delaware ranking
Avg staff/day 88
Average shift 7.9 hours
0% compared with Delaware average
Delaware average: 7.6 hours Delaware average shift: 7.6 hoursSee full Delaware ranking
Total staff hours (quarter) 64,086

Nursing staff breakdown

Q4 2025 · Oct 1 – Dec 31 More info This data comes from the CMS Payroll-Based Journal report covering October 1 – December 31, 2025.
Registered Nurse

Manages medical care and health needs.

RN Staff Info 25 total: 11 full-time employees and 14 contractors. 25
Average shift length Info Average shift length. Calculated as total hours divided by days worked and average staff per day. 7.6 hours
Licensed Practical Nurse

Assists with medical care and medications.

LPN Staff Info 42 total: 30 full-time employees and 12 contractors. 42
Average shift length Info Average shift length. Calculated as total hours divided by days worked and average staff per day. 9.3 hours
Certified Nursing Assistant

Helps with daily care and mobility.

CNA Staff Info All 87 CNA Staff are full-time employees. No contractors work on this role. 87
Average shift length Info Average shift length. Calculated as total hours divided by days worked and average staff per day. 7.6 hours

Contractor staffing

Q4 2025 · Oct 1 – Dec 31 More info This data comes from the CMS Payroll-Based Journal report covering October 1 – December 31, 2025.

Total hours from contractors

11%

7,020 contractor hours this quarter

Registered Nurse: 14 Licensed Practical Nurse: 12 Qualified Social Worker: 8 Physical Therapy Aide: 5 Physical Therapy Assistant: 4 Respiratory Therapy Technician: 3 Speech Language Pathologist: 3

Staff by category

Q4 2025 · Oct 1 – Dec 31 More info This data comes from the CMS Payroll-Based Journal report covering October 1 – December 31, 2025.
Certified Nursing Assistant8708732,56692100%7.6
Licensed Practical Nurse30124213,11792100%9.3
Clinical Nurse Specialist140143,69992100%7.9
RN Director of Nursing7072,6906975%7.5
Registered Nurse1114252,4959199%7.6
Physical Therapy Aide0552,2238289%7.5
Speech Language Pathologist0331,0988188%7.4
Other Dietary Services Staff3031,0758491%7.8
Physical Therapy Assistant0441,0297683%7.9
Dietitian2029477784%7.5
Dental Services Staff3038216874%7.6
Respiratory Therapy Technician0337027683%6.9
Nurse Practitioner1014996470%7.8
Mental Health Service Worker1014566267%7.4
Administrator3034215560%7.6
Qualified Social Worker0881372527%5.5
Occupational Therapist1011121415%8
87 Certified Nursing Assistant
% of Days 100%
42 Licensed Practical Nurse
% of Days 100%
14 Clinical Nurse Specialist
% of Days 100%
7 RN Director of Nursing
% of Days 75%
25 Registered Nurse
% of Days 99%
5 Physical Therapy Aide
% of Days 89%
3 Speech Language Pathologist
% of Days 88%
3 Other Dietary Services Staff
% of Days 91%
4 Physical Therapy Assistant
% of Days 83%
2 Dietitian
% of Days 84%
3 Dental Services Staff
% of Days 74%
3 Respiratory Therapy Technician
% of Days 83%
1 Nurse Practitioner
% of Days 70%
1 Mental Health Service Worker
% of Days 67%
3 Administrator
% of Days 60%
8 Qualified Social Worker
% of Days 27%
1 Occupational Therapist
% of Days 15%

Penalties and fines

Federal penalties imposed by CMS for regulatory violations, including civil money penalties (fines) and denials of payment for new Medicare/Medicaid admissions.

Source: CMS Penalties Database

No penalties in the past 3 years

No civil money penalties or payment denials were reported in the last 3 years.

Quality of care over time

These measures show how residents usually do over time at this home, based on health outcomes and preventive care.

High-risk clinical events score Info A composite score based on pressure ulcers, falls with injury, weight loss, walking ability decline, and activities of daily living decline. 10.6
10% worse than Delaware average

Delaware average: 9.6

Functional decline score Info A composite score based on activities of daily living decline, walking ability decline, and incontinence. 22.9
21% worse than Delaware average

Delaware average: 19.0

Long-stay resident measures
Need for Help with Daily Activities Increased Info Percent of long-stay residents whose need for help with daily activities has increased 17.2%
11% worse than Delaware average

Delaware average: 15.4%

Walking Ability Worsened Info Percent of long-stay residents whose ability to move independently worsened 28.5%
44% worse than Delaware average

Delaware average: 19.8%

Low Risk Residents with Bowel/Bladder Incontinence Info Percent of low risk long-stay residents who lose control of their bowels or bladder 23.0%
In line with Delaware average

Delaware average: 22.1%

Falls with Major Injury Info Percent of long-stay residents experiencing one or more falls with major injury 1.0%
68% better than Delaware average

Delaware average: 3.0%

High Risk Residents with Pressure Ulcers Info Percent of long-stay high risk residents with pressure ulcers 2.3%
49% better than Delaware average

Delaware average: 4.4%

Urinary Tract Infection Info Percent of long-stay residents with a urinary tract infection 1.6%
26% better than Delaware average

Delaware average: 2.1%

Lost Too Much Weight Info Percent of long-stay residents who lose too much weight 4.1%
29% better than Delaware average

Delaware average: 5.8%

Depressive Symptoms Info Percent of long-stay residents who have depressive symptoms 3.5%
41% better than Delaware average

Delaware average: 6.0%

Antipsychotic Use Info Percent of long-stay residents who received an antipsychotic medication 18.1%
65% worse than Delaware average

Delaware average: 11.0%

Pneumococcal Vaccine Info Percent of long-stay residents assessed and appropriately given the pneumococcal vaccine 97.4%
In line with Delaware average

Delaware average: 95.3%

Influenza Vaccine Info Percent of long-stay residents assessed and appropriately given the seasonal influenza vaccine 98.6%
In line with Delaware average

Delaware average: 97.4%

Short-stay resident measures
Pneumococcal Vaccine Info Percent of short-stay residents assessed and appropriately given the pneumococcal vaccine 88.2%
7% better than Delaware average

Delaware average: 82.1%

Antipsychotic medication increase Info Percent of short-stay residents who newly received an antipsychotic medication 1.1%
28% worse than Delaware average

Delaware average: 0.9%

Influenza Vaccine Info Percent of short-stay residents assessed and appropriately given the seasonal influenza vaccine 86.9%
5% better than Delaware average

Delaware average: 83.1%

Breakdown by payment type

Medicare

40% of new residents, usually for short-term rehab.

Typical stay 27 days

Private pay

46% of new residents, often for short stays.

Typical stay 27 days

Medicaid

14% of new residents, often for long-term daily care.

Typical stay 1 - 2 years

Facility Characteristics

Source: CMS Long-Term Care Facility Characteristics (Data as of Jan 2026)

Total residents 162
Medicare
12
7.4% of residents
Medicaid
130
80.2% of residents
Private pay or other
20
12.3% of residents
Programs & Services
Residents Group

Residents meet regularly to discuss policies, care quality, and activities

Active Resident Council

Organized group of residents that meets regularly to discuss facility policies, quality of life, and activities.

Finances and operations

Based on CMS SNF Cost Report for fiscal year ending in 12/2023.

For-profit
Operated by a single business entity.
Net patient revenue Info Net patient revenue — what the home actually collects for resident care, after contractual allowances, bad debt and discounts are subtracted from its gross charges (CMS cost report, Worksheet G-3). It covers resident care only; money the home earns from other sources is shown separately as "Other income."
$19.2M
Net patient income Info Net patient income: net patient revenue minus the home's total operating expenses. A positive figure means it earns more from resident care than it spends to deliver it; a negative figure means the opposite. It excludes non-operating "other income."
-$2.9M
For-profit Operated by a single business entity.
Net patient revenue Info Net patient revenue — what the home actually collects for resident care, after contractual allowances, bad debt and discounts are subtracted from its gross charges (CMS cost report, Worksheet G-3). It covers resident care only; money the home earns from other sources is shown separately as "Other income."
$19.2M Rank #2 / 37Revenue — State benchmarkedThis home is ranked 2nd out of 37 homes in Delaware. Shows this facility's annual revenue compared to the Delaware average. Higher revenue generally means more resources for staffing and capital — read alongside Payroll %.Rankings are based only on facilities in Delaware that report data for that category. Facilities without available data are excluded from the ranking.Click the rank badge to see the full State ranking.Click here to see the full State ranking.
Net patient income Info Net patient income: net patient revenue minus the home's total operating expenses. A positive figure means it earns more from resident care than it spends to deliver it; a negative figure means the opposite. It excludes non-operating "other income."
-$2.9M
Other income Info Money the home earns outside of resident care — such as investments, grants, rentals and other non-operating sources (CMS cost report, Worksheet G-3). It is tracked separately from net patient revenue: it is not part of that figure, and it is not included in net patient income.
$116.7K
Payroll costs Info Staff salaries plus wage-related costs — benefits such as payroll taxes, health insurance and retirement — from the home's own accounting records (CMS cost report, Worksheet A). Contract or agency labor is counted separately, under other operating costs. Rank #3 / 37Payroll — State benchmarkedThis home is ranked 3rd out of 37 homes in Delaware. Shows total annual staff payroll benchmarked to the Delaware average. Higher payroll investment relative to peers often signals better staffing and less reliance on cheaper contract labor.Rankings are based only on facilities in Delaware that report data for that category. Facilities without available data are excluded from the ranking.Click the rank badge to see the full State ranking.Click here to see the full State ranking.
$8.9M 46.5% of net patient revenue Info Payroll as a share of revenue: staff salaries and wage-related benefits divided by net patient revenue. A higher figure means more of each revenue dollar goes to staff pay. Rank #26 / 37Payroll % — State benchmarkedThis home is ranked 26th out of 37 homes in Delaware. Shows payroll as a percentage of revenue versus the Delaware average. Well-run Delaware facilities typically land around 52–60% — the top third Statewide. Below 25% may signal understaffing or heavy agency use — read with Staffing ratings.Rankings are based only on facilities in Delaware that report data for that category. Facilities without available data are excluded from the ranking.Click the rank badge to see the full State ranking.Click here to see the full State ranking.
Other operating costs Info Everything it costs to run the home apart from payroll — food, utilities, supplies, maintenance, contract labor and administration. Calculated as total operating expense minus payroll (staff salaries and wage-related benefits).
$13.1M
Total costs Info The home's total operating expense for the year — all the costs of running it, salaries included (CMS cost report, Worksheet G-3).
$22.0M

What does this home offer?

Housing options icon

Housing Options: Private Rooms / Semi-Private Rooms

Building type icon
Building type icon

Building Type: Single-story

Transportation services icon

Transportation Services

Fitness and recreation icon

Fitness and Recreation

Who this home usually serves

TYPE OF STAY

Mix of rehab and long-term care

This home supports both short-term rehab and long-term care, with residents staying for a wide range of durations.

New residents most often arrive under private pay (46% of admissions), and a typical private pay stay runs around 27 days.

Admissions
512 total

Coverage residents most often arrive under.

Medicare 40%
Private pay 46%
Medicaid 14%
Discharges
527 total

Coverage residents most often leave under.

Medicare 27%
Private pay 44%
Medicaid 29%

Places of interest near Caring Angel Home Health

Address 0.3 miles from city center Info Estimated distance in miles from Smyrna's city center to Caring Angel Home Health's address, calculated via Google Maps.

Calculate Travel Distance to Caring Angel Home Health

Add your location

Address

Financial Assistance for
Home Care in Delaware

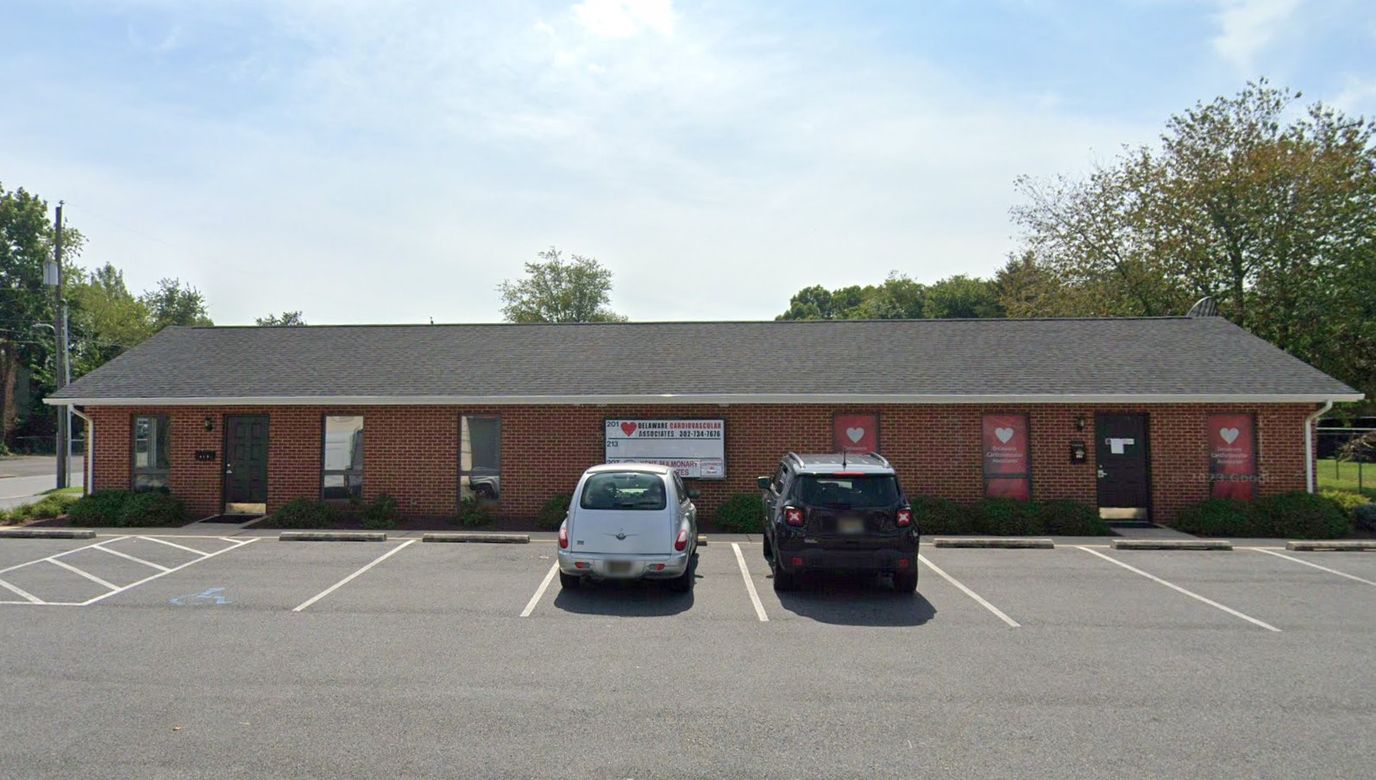
Caring Angel Home Health is located in Smyrna, Delaware.
Here are the financial assistance programs available to residents in Delaware.

Get Financial aid guidance

Elderly and Disabled Waiver

Delaware Medicaid E&D Waiver

Age 65+ or disabled
General Delaware resident, Medicaid- eligible, nursing home-level care need.
Income Limits (2025) ~$2,829/month 300% FBR, individual
Asset Limits $2,000 (individual), $3,000 (couple).
DE

Small state, faster processing in some areas.

Benefits
Personal care (5-7 hours/day) Respite (240 hours/year) Adult day care (~$60/day) Home modifications

Delaware Caregiver Support Program

DE Caregiver Support (NFCSP)

Age Caregiver of someone 60+
General Delaware resident.
Income Limits No strict limit; prioritizes low-income.
Asset Limits Not applicable.
DE

Limited slots; rural focus.

Benefits
In-home respite (4-6 hours/day) Adult day care (~$60/day) Short-term facility care (up to 5 days)

Program of All-Inclusive Care for the Elderly (PACE)

Delaware Medicaid PACE

Age 55+
General Delaware resident, nursing home-level care need, safe with PACE support.
Income Limits (2025) ~$2,829/month 300% FBR
Asset Limits $2,000 (individual), $3,000 (couple).
DE

Limited to specific areas (e.g., New Castle County); few providers.

Benefits
Personal care (5-7 hours/day) Medical care Meals Transportation Therapy

Medicare Savings Program (MSP)

Delaware Medicare Savings Program

Age 65+ or disabled
General Delaware resident, enrolled in Medicare Part A/B.
Income Limits (2025) ~$2,510/month (QMB), ~$3,380/month (SLMB), ~$3,598/month (QI)—individual, adjusted annually.
Asset Limits $9,430 (individual), $14,130 (couple).
DE

Three tiers; broader limits than some states.

Benefits
Covers Medicare Part B premiums ($174.70/month) Deductibles ($240/year) Copays (~20% of services)

Frequently Asked Questions about Caring Angel Home Health

Is Caring Angel Home Health in a walkable area?

Caring Angel Home Health has a walk score of 79. Very walkable. Most errands can be accomplished on foot, and many essentials are within a short walk.

What is the occupancy rate at Caring Angel Home Health?

Caring Angel Home Health's occupancy is 80.6%.

Does Caring Angel Home Health operate as a for-profit or non-profit?

Caring Angel Home Health is registered as a for-profit.

Are there photos of Caring Angel Home Health?

Yes — there are 4 photos of Caring Angel Home Health in the photo gallery on this page.

What is the address of Caring Angel Home Health?

Caring Angel Home Health is located at 201 N Main St, Smyrna, DE 19977.

What is the phone number of Caring Angel Home Health?

(302) 653-8435 will put you in contact with the team at Caring Angel Home Health.

Is Caring Angel Home Health Medicare or Medicaid certified?

Yes — Caring Angel Home Health is a CMS-certified provider of Medicare and Medicaid.

Guides for Better Senior Living

Care Cost Calculator: See Prices in Your Area

Nursing Home Data Explorer

Don’t Wait Too Long: 7 Red Flag Signs Your Parent Needs Assisted Living Now

The True Cost of Assisted Living in 2025 – And How Families Are Paying For It

Understanding Senior Living Costs: Pricing Models, Discounts & Financial Assistance