Monroe House
Assisted Living · Moses Lake, WA
CMS overall rating Info The Overall CMS Rating is scored from 1 to 5 stars and combines results from health inspections, staffing levels, and quality measures. Health inspections carry the most weight. Staffing and quality scores can increase or decrease the final rating based on performance compared to state and national standards.

Monroe House

Assisted Living · Moses Lake, WA
CMS overall rating Info The Overall CMS Rating is scored from 1 to 5 stars and combines results from health inspections, staffing levels, and quality measures. Health inspections carry the most weight. Staffing and quality scores can increase or decrease the final rating based on performance compared to state and national standards.
Calculator: See prices in your area
Monroe House accepts Medicaid, Medicare, and private pay.

Overview of Monroe House

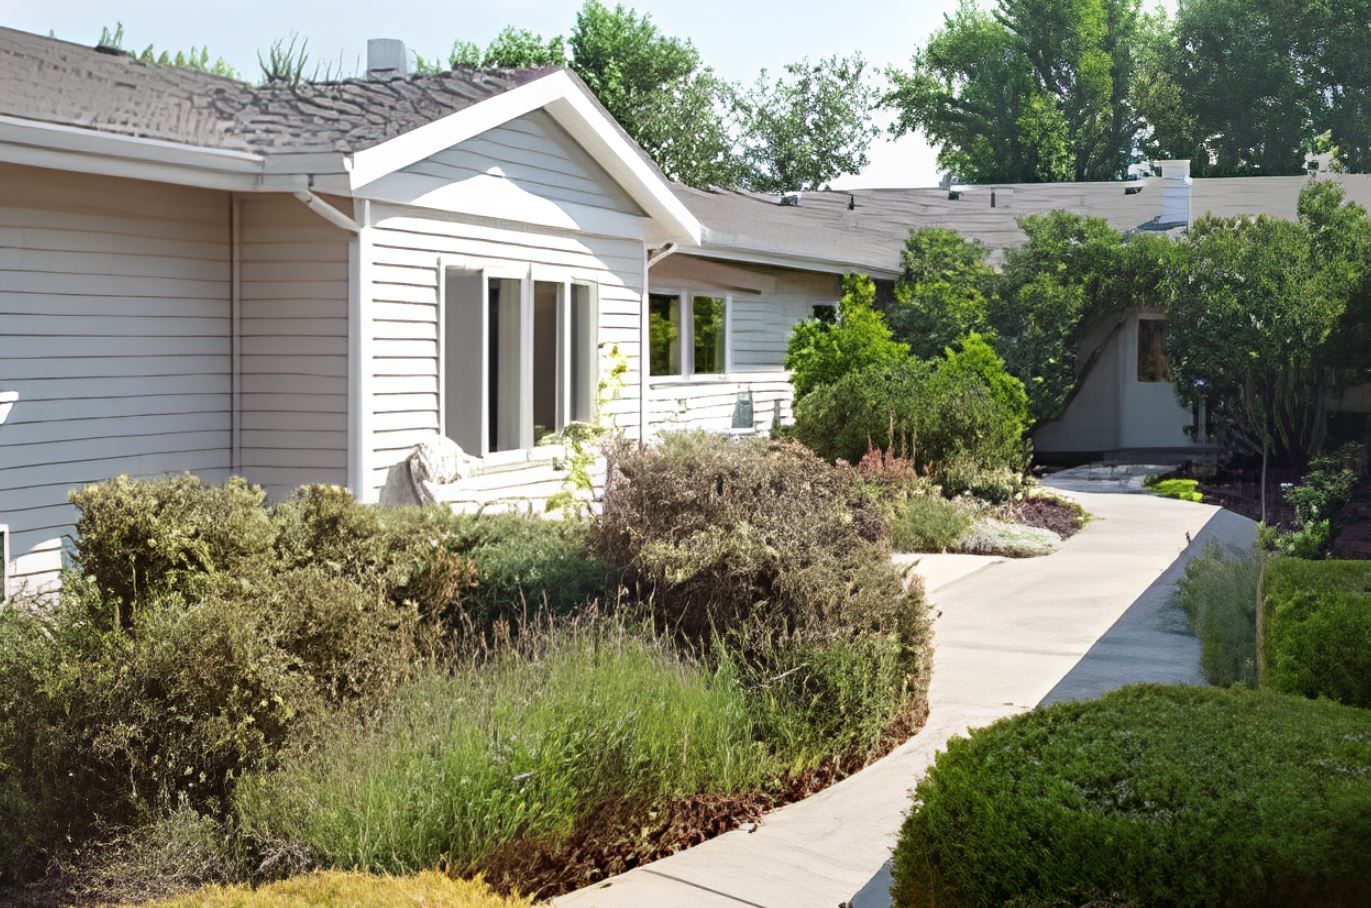
Monroe House prioritizes assisted senior living with personalized care. Their team of compassionate professionals works closely with residents to develop individualized care plans that meet their unique needs. This may include assistance with daily living activities like bathing and dressing, medication management, and support for memory challenges.

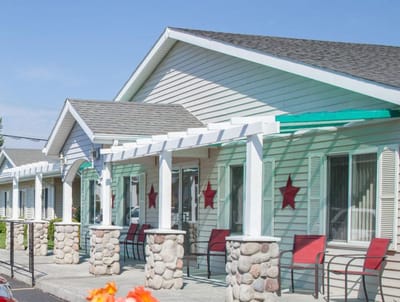
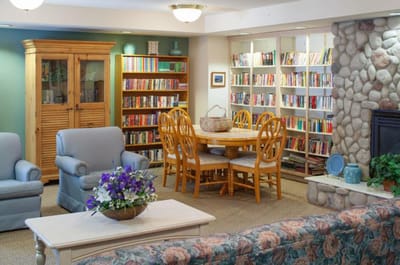
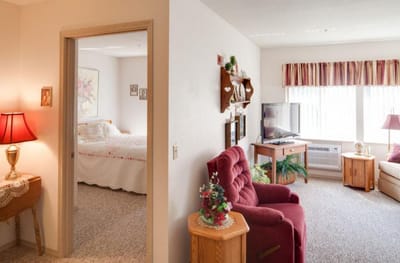
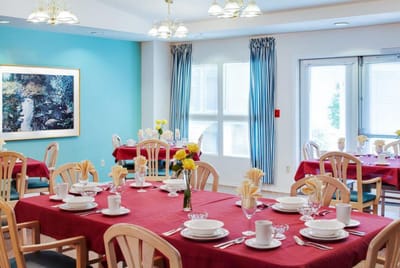
Residents enjoy a comfortable and secure atmosphere in studio or one-bedroom apartments. Monroe House provides delicious, home-made meals, daily activities, and a variety of amenities like a beautiful courtyard, on-site laundry, and complimentary Wi-Fi. Their dedicated staff, from recreation specialists to caregivers, are invested in resident happiness. This commitment to creating a positive and enriching environment has earned Monroe House recognition as the top Assisted Living Facilities for three consecutive years.

(360) 765-3917

Quality ratings

Measured by Centers for Medicare & Medicaid Services (CMS)

Overall rating Info The Overall CMS Rating combines results from health inspections, staffing levels and quality measures. Health inspections carry the most weight. Staffing and quality scores can increase or decrease the final rating based on performance compared to state and national standards.
▼ 42.2% Below WA avg. ▼ 42.2% Below WA avg.Click the badge to see the full State ranking.Click here to see the full State ranking.
Health Inspection Info Based on the results of the facility's three most recent standard inspections and any complaint investigations. CMS reviews the number, scope, and severity of deficiencies, with more recent findings weighted more heavily.
▼ 30.6% Below WA avg. ▼ 30.6% Below WA avg.Click the badge to see the full State ranking.Click here to see the full State ranking.
Staffing Info Measures average nursing staff hours per resident per day, including Registered Nurses (RNs) and total nursing staff. Ratings are adjusted based on the level of care residents require and are compared to state and national benchmarks.
▼ 22.1% Below WA avg. ▼ 22.1% Below WA avg.Click the badge to see the full State ranking.Click here to see the full State ranking.
Quality Measures Info Based on clinical and physical health indicators reported to CMS, such as hospital readmissions, falls, pressure ulcers, and improvements in mobility. These measures reflect how well residents' health needs are being managed.
▼ 26.5% Below WA avg. ▼ 26.5% Below WA avg.Click the badge to see the full State ranking.Click here to see the full State ranking.

Staffing hours breakdown

Info Daily nursing hours per resident by staff type, reported to CMS. Higher is generally better — compare this facility to state and national averages to see where staffing stands.

Hours per resident per day — compared to Washington state averages

Total nursing care / resident Info This home is ranked 52nd out of 89 homes in Washington. Total adjusted nursing hours per resident per day, combining RN, LPN, and aide time. CMS adjusts this for case-mix so facilities can be fairly compared.
4h 1m per day
Rank #52 / 89Nurse hours — State benchmarkedThis home is ranked 52nd out of 89 homes in Washington. Shows adjusted nurse hours per resident per day benchmarked to the Washington average, with a ranking across 89 Washington SNFs. More hours mean more direct care. The national average is about 3.5 hrs; below 3.0 is a red flag.Click the rank badge to see the full State ranking.Click here to see the full State ranking.
This facility Washington avg (4h 22m per day)
vs Washington avg
-8%

1 of 1 metrics below state avg

Staff typeHours / Day / Residentvs state avg
Weekend Total Nursing Info Combined nursing hours (RN + LPN + Nurse Aide) per resident per day on weekends. Staffing often drops on weekends — this figure reveals whether the facility maintains adequate coverage outside of weekday hours. 3h 41m per day ▼ 4% State avg: 3h 50m per day · National avg: 3h 25m per day

Types of Care at Monroe House

Assisted Living

Capacity and availability

This home usually has availability

Higher occupancy than the Washington average: 72.5%
Occupancy rate
77.2% Rank #137 / 310Occupancy rate — State benchmarkedThis home is ranked 137th out of 310 homes in Washington. Shows this facility's occupancy rate versus the Washington average, with its Statewide rank out of 310. Higher occupancy signals strong local demand and financial stability.Click the rank badge to see the full State ranking.Click here to see the full State ranking.
Avg. Length of Stay
77 days
Bed community size
41-bed community Rank #321 / 366Bed count — State benchmarkedThis home is ranked 321st out of 366 homes in Washington. Shows this facility's certified or reported bed count compared to other Washington SNFs. Larger communities may offer more amenities, programs, and on-site services for residents and families.Click the rank badge to see the full State ranking.Click here to see the full State ranking.
A moderately sized community that may balance personal attention with shared amenities and social activities.
Years in operation
28 years in operation
A longer operating history, which may indicate experience navigating regulations and delivering ongoing care.
Walk Score
Walk Score: 52 / 100 Rank #312 / 628Walk Score — State benchmarkedThis home is ranked 312th out of 628 homes in Washington. Shows how walkable this facility's neighborhood is compared to the average Walk Score across Washington SNFs. Higher scores benefit residents, families, and staff.Click the rank badge to see the full State ranking.Click here to see the full State ranking.
Moderately walkable. Some errands can be accomplished on foot, with a mix of nearby amenities.

About this community

License Details

Facility TypeBoarding Home
StatusOperating
ExpirationJune 30, 2026
CountyGrant
License Number2752

Staffing

Key information about the people who lead and staff this community.

Leadership

ContactDeborah D. Rhodes

Contact Monroe House

Health Inspection History

Inspections since 2022
Total health inspections 7

Washington average 7.8


Last Health inspection on Dec 2024

Total health citations
72 Rank #69 / 91Health citations — State benchmarkedThis home is ranked 69th out of 91 homes in Washington. Shows this facility's total health deficiency citations benchmarked to the Washington State average, with a ranking across all 91 WA SNFs. Lower citation counts earn a better rank.Click the rank badge to see the full State ranking.Click here to see the full State ranking.

Washington average 48.9

Citations per inspection
10.29 Rank #75 / 91Citations per inspection — State benchmarkedThis home is ranked 75th out of 91 homes in Washington. Shows average deficiency citations per CMS inspection for this facility versus the Washington mean across 91 SNFs with citation data. Lower is better.Click the rank badge to see the full State ranking.Click here to see the full State ranking.

Washington average 6.92


Health citations are formal notices following inspections when they fail to comply with safety and care standards.

61 of 72 citations resulted from standard inspections; 8 of 72 resulted from complaint investigations; and 3 of 72 came from combined inspections (standard and complaint).

Breakdown of citation severity (last 4 years)
Critical health citations
0
100% better than Washington average

Washington average: 0.3


Serious health citations
5
194% worse than Washington average

Washington average: 1.7

0 critical citations Washington average: 0.3

5 serious citations Washington average: 1.7

67 moderate citations Washington average: 46.3

0 minor citations Washington average: 0.5
Citations history (last 4 years)
Abuse/Neglect moderate citation Dec 12, 2024
Corrected

Pharmacy moderate citation Dec 12, 2024
Corrected

Resident Rights moderate citation Dec 12, 2024
Corrected

Abuse/Neglect moderate citation Oct 04, 2024
Corrected

Staffing Data

Reporting period: October 1 – December 31, 2025 (Q4 2025). Source: CMS Payroll-Based Journal report.

Total staff 97
Employees 95
Contractors 2
Staff to resident ratio 1.24:1
33% worse than Washington average
Washington average ratio: 1.86:1 Washington average ratio: 1.86:1See full Washington ranking
Avg staff/day 44
Average shift 8.5 hours
5% better than Washington average
Washington average: 8.1 hours Washington average shift: 8.1 hoursSee full Washington ranking
Total staff hours (quarter) 34,255

Nursing staff breakdown

Q4 2025 · Oct 1 – Dec 31 More info This data comes from the CMS Payroll-Based Journal report covering October 1 – December 31, 2025.
Registered Nurse

Manages medical care and health needs.

RN Staff 14
Average shift length Info Average shift length. Calculated as total hours divided by days worked and average staff per day. 8.3 hours

This role is partially covered by contractors.

Licensed Practical Nurse

Assists with medical care and medications.

LPN Staff 10
Average shift length Info Average shift length. Calculated as total hours divided by days worked and average staff per day. 9 hours

No contractors work on this role.

Certified Nursing Assistant

Helps with daily care and mobility.

CNA Staff 37
Average shift length Info Average shift length. Calculated as total hours divided by days worked and average staff per day. 8.6 hours

No contractors work on this role.

Contractor staffing

Q4 2025 · Oct 1 – Dec 31 More info This data comes from the CMS Payroll-Based Journal report covering October 1 – December 31, 2025.

Total hours from contractors

0%

16 contractor hours this quarter

Registered Nurse: 2

Staff by category

Q4 2025 · Oct 1 – Dec 31 More info This data comes from the CMS Payroll-Based Journal report covering October 1 – December 31, 2025.
Certified Nursing Assistant3703715,24292100%8.6
Licensed Practical Nurse100104,37492100%9
Registered Nurse122143,79192100%8.3
Physical Therapist120123,6357683%7.8
RN Director of Nursing5051,9278390%8.7
Clinical Nurse Specialist6061,2377784%8.4
Occupational Therapy Aide4049657683%7.6
Other Dietary Services Staff3037229098%6.8
Mental Health Service Worker2027196267%7.7
Nurse Practitioner1015126470%8
Administrator1015046368%8
Dietitian1013524549%7.8
Nurse Aide in Training1012773538%7.9
37 Certified Nursing Assistant
% of Days 100%
10 Licensed Practical Nurse
% of Days 100%
14 Registered Nurse
% of Days 100%
12 Physical Therapist
% of Days 83%
5 RN Director of Nursing
% of Days 90%
6 Clinical Nurse Specialist
% of Days 84%
4 Occupational Therapy Aide
% of Days 83%
3 Other Dietary Services Staff
% of Days 98%
2 Mental Health Service Worker
% of Days 67%
1 Nurse Practitioner
% of Days 70%
1 Administrator
% of Days 68%
1 Dietitian
% of Days 49%
1 Nurse Aide in Training
% of Days 38%

Penalties and fines

Includes penalties issued in 2024

Federal penalties imposed by CMS for regulatory violations, including civil money penalties (fines) and denials of payment for new Medicare/Medicaid admissions.

Source: CMS Penalties Database (Data as of Jan 2026)

Total fines amount $116K Rank #71 / 91Federal fines — State benchmarkedThis home is ranked 71st out of 91 homes in Washington. Shows this facility's cumulative CMS federal fine dollars versus the Washington average among facilities with fines, and where it ranks among 91 skilled nursing facilities in the pool. Lower total dollars mean a better rank.Click the rank badge to see the full State ranking.Click here to see the full State ranking.
42% higher than Washington average

Washington average: $82K

Number of fines 2
8% more fines than Washington average

Washington average: 1.8

Payment Denials Info Serious action where Medicare and/or Medicaid temporarily stops payments for new residents until issues are fixed. 0
100% fewer payment denials than Washington average

Washington average: 0.3

Fines amount comparison
This facility $116K
Washington average $82K
Penalty History

Penalties are imposed by CMS for violations of federal nursing home regulations.

1 penalty in the past 3 years

Feb 2, 2024 · $68K

Civil Money Penalty Info Fines imposed for noncompliance, which can be assessed per day or per instance of violation. Feb 2, 2024
$68K

Last updated: Jan 2026

Quality of care over time

These measures show how residents usually do over time at this home, based on health outcomes and preventive care.

High-risk clinical events score Info A composite score based on pressure ulcers, falls with injury, weight loss, walking ability decline, and activities of daily living decline. 11.7
17% worse than Washington average

Washington average: 10.0

Functional decline score Info A composite score based on activities of daily living decline, walking ability decline, and incontinence. 25.7
23% worse than Washington average

Washington average: 20.9

Long-stay resident measures
Need for Help with Daily Activities Increased Info Percent of long-stay residents whose need for help with daily activities has increased 15.6%
5% better than Washington average

Washington average: 16.4%

Walking Ability Worsened Info Percent of long-stay residents whose ability to move independently worsened 31.3%
43% worse than Washington average

Washington average: 21.8%

Low Risk Residents with Bowel/Bladder Incontinence Info Percent of low risk long-stay residents who lose control of their bowels or bladder 30.3%
25% worse than Washington average

Washington average: 24.3%

Falls with Major Injury Info Percent of long-stay residents experiencing one or more falls with major injury 0.4%
83% better than Washington average

Washington average: 2.6%

High Risk Residents with Pressure Ulcers Info Percent of long-stay high risk residents with pressure ulcers 5.3%
9% worse than Washington average

Washington average: 4.9%

Urinary Tract Infection Info Percent of long-stay residents with a urinary tract infection 1.8%
In line with Washington average

Washington average: 1.7%

Lost Too Much Weight Info Percent of long-stay residents who lose too much weight 5.9%
In line with Washington average

Washington average: 5.8%

Depressive Symptoms Info Percent of long-stay residents who have depressive symptoms 24.1%
49% worse than Washington average

Washington average: 16.2%

Antipsychotic Use Info Percent of long-stay residents who received an antipsychotic medication 20.3%
40% worse than Washington average

Washington average: 14.5%

Pneumococcal Vaccine Info Percent of long-stay residents assessed and appropriately given the pneumococcal vaccine 86.7%
10% worse than Washington average

Washington average: 96.2%

Influenza Vaccine Info Percent of long-stay residents assessed and appropriately given the seasonal influenza vaccine 62.5%
33% worse than Washington average

Washington average: 93.8%

Short-stay resident measures
Pneumococcal Vaccine Info Percent of short-stay residents assessed and appropriately given the pneumococcal vaccine 44.5%
49% worse than Washington average

Washington average: 88.1%

Antipsychotic medication increase Info Percent of short-stay residents who newly received an antipsychotic medication 1.6%
13% worse than Washington average

Washington average: 1.4%

Influenza Vaccine Info Percent of short-stay residents assessed and appropriately given the seasonal influenza vaccine 44.1%
46% worse than Washington average

Washington average: 82.0%

Breakdown by payment type

Medicare

20% of new residents, usually for short-term rehab.

Typical stay 29 days

Private pay

76% of new residents, often for short stays.

Typical stay 27 days

Medicaid

4% of new residents, often for long-term daily care.

Typical stay 4 - 5 years

Facility Characteristics

Source: CMS Long-Term Care Facility Characteristics (Data as of Jan 2026)

Total residents 78
Medicare
3
3.8% of residents
Medicaid
54
69.2% of residents
Private pay or other
21
26.9% of residents
Programs & Services
Residents Group

Residents meet regularly to discuss policies, care quality, and activities

Active Resident Council

Organized group of residents that meets regularly to discuss facility policies, quality of life, and activities.

Finances and operations

Privately-owned community
Home revenue
$4.1M
Profit
$17.5K
Privately-owned community
Home revenue
$4.1M Rank #88 / 93Revenue — State benchmarkedThis home is ranked 88th out of 93 homes in Washington. Shows this facility's annual revenue compared to the Washington SNF average. Higher revenue generally means more resources for staffing and capital — read alongside Payroll %.Click the rank badge to see the full State ranking.Click here to see the full State ranking.
Profit
$17.5K
Payroll costs Info The portion of the home's budget spent on staff, including nurses, caregivers, and other employees who support care and operations. Rank #85 / 93Payroll — State benchmarkedThis home is ranked 85th out of 93 homes in Washington. Shows total annual staff payroll benchmarked to the Washington average. Higher payroll investment relative to peers often signals better staffing and less reliance on cheaper contract labor.Click the rank badge to see the full State ranking.Click here to see the full State ranking.
$2.9M
70.3% of revenue Rank #3 / 93Payroll % — State benchmarkedThis home is ranked 3rd out of 93 homes in Washington. Shows payroll as a percentage of revenue versus the Washington average. Well-run Washington SNFs typically land around 53–61% — the top third Statewide. Below 25% may signal understaffing or heavy agency use — read with Staffing ratings.Click the rank badge to see the full State ranking.Click here to see the full State ranking.
Other operating costs Info All remaining costs needed to run the home, such as food, utilities, building maintenance, supplies and administrative expenses.
$1.2M
Total costs $4.1M

What does this home offer?

Housing options icon

Housing Options: Studio / 1 Bed

Building type icon
Building type icon

Building Type: Single-story

Fitness and recreation icon

Fitness and Recreation

Who this home usually serves

TYPE OF STAY

Primarily short stays

Residents typically stay for brief periods, with frequent admissions and discharges throughout the year.

Places of interest near Monroe House

Address 1.2 miles from city center Info Estimated distance in miles from Moses Lake's city center to Monroe House's address, calculated via Google Maps. — 0.35 miles to nearest hospital (Samaritan Healthcare)

Calculate Travel Distance to Monroe House

Add your location

Address

Financial Assistance for
Assisted Living in Washington

Monroe House is located in Moses Lake, Washington.
Here are the financial assistance programs available to residents in Washington.

Get Financial aid guidance

Community Options Program Entry System (COPES)

WA Medicaid COPES

Age 65+ or disabled
General Washington resident, Medicaid-eligible, nursing home-level care need.
Income Limits (2025) ~$2,829/month 300% FBR, individual
Asset Limits $2,000 (individual), $3,000 (couple).
WA

High demand in urban areas (e.g., Seattle).

Benefits
Personal care (5-7 hours/day) Respite (240 hours/year) Adult day care ($70/day) Home modifications ($1,500 avg.)

Washington Family Caregiver Support Program

WA NFCSP

Age Caregiver of someone 60+ (or with dementia)
General Washington resident.
Income Limits No strict limit; prioritizes low-income.
Asset Limits Not applicable.
WA

High urban demand; rural outreach.

Benefits
In-home respite (4-6 hours/day) Adult day care (~$70/day) Short-term facility care (up to 5 days)

Community First Choice (CFC)

Washington Community First Choice

Age 65+ (or disabled 18+)
General WA resident, Medicaid-eligible, need help with 2+ ADLs/IADLs.
Income Limits (2025) ~$2,829/month; QIT optional.
Asset Limits $2,000 (individual), $3,000 (couple).
WA

Broader than COPES; serves ~20,000; self-directed option.

Benefits
Personal care (4-6 hours/day) Respite (~240 hours/year) Assistive devices Training Transportation

Older Americans Act (OAA) Services

Washington OAA Services

Age 60+
General WA resident; no income/asset limits.
Income Limits (2025) None; donations encouraged.
Asset Limits Not assessed.
WA

13 AAAs; includes Meals on Wheels; rural focus.

Benefits
Meals (~$5-$7/meal) Transportation Homemaker services (~4 hours/week) Respite (~5 days/year) Legal aid

Medicare Savings Program (MSP)

Washington Medicare Savings Program

Age 65+ or disabled
General WA resident, Medicare Part A/B.
Income Limits (2025) ~$2,510/month (QMB), ~$3,380/month (SLMB), ~$3,598/month (QI)—individual.
Asset Limits $9,430 (individual), $14,130 (couple).
WA

Includes Extra Help for Part D; no waitlist.

Benefits
Covers Part B premiums ($174.70/month) Deductibles ($240/year) Copays (~20%)

VA Aid and Attendance (A&A) and Housebound Benefits

Washington VA Aid and Attendance/Housebound

Age 65+ or disabled veteran/spouse
General WA resident, wartime service, ADL help (A&A) or homebound.
Income Limits (2025) Net income < ~$1,984/month (veteran with dependent, A&A); pension offsets income.
Asset Limits ~$155,356 net worth
WA

High veteran use; supports rural/urban needs.

Benefits
Cash (~$1,433-$2,642/month veteran, ~$951-$1,318 spouse) for care costs

Senior Citizens Property Tax Exemption

Washington Senior Property Tax Exemption

Age 61+ or disabled retiree
General WA resident, homeowner, income-based.
Income Limits (2025) ~$45,000-$70,000/year varies by county, e.g., King: $70,000
Asset Limits Not assessed; home value cap varies ~$250,000-$400,000
WA

Saves ~$500-$1,500/year; offered statewide.

Benefits
Tax exemption (~$500-$1,500/year depending on county)

Senior Farmers’ Market Nutrition Program (SFMNP)

Washington SFMNP

Age 60+
General WA resident, low-income.
Income Limits (2025) ~$2,322/month 185% FPL
Asset Limits Not assessed.
WA

Vouchers (~$80/season); serves ~20,000 via AAAs.

Benefits
Vouchers (~$80/season) for produce at farmers’ markets

Frequently Asked Questions about Monroe House

Is Monroe House in a walkable area?

Monroe House has a walk score of 52. Moderately walkable. Some errands can be accomplished on foot, with a mix of nearby amenities.

What is the license number of Monroe House?

According to WA state health department records, Monroe House's license number is 2752.

When does Monroe House's license expire?

According to WA state health department records, Monroe House's license expires on June 30, 2026.

How many beds does Monroe House have?

Monroe House has 41 beds.

What is the phone number of Monroe House?

(360) 765-3917 will put you in contact with the team at Monroe House.

What county is Monroe House located in?

Monroe House is in Grant County.

Is Monroe House Medicare or Medicaid certified?

Yes — Monroe House is a CMS-certified provider of Medicare and Medicaid.

Guides for Better Senior Living

Care Cost Calculator: See Prices in Your Area

Nursing Home Data Explorer

Don’t Wait Too Long: 7 Red Flag Signs Your Parent Needs Assisted Living Now

The True Cost of Assisted Living in 2025 – And How Families Are Paying For It

Understanding Senior Living Costs: Pricing Models, Discounts & Financial Assistance

Explore Open Rooms
1 Contact details
2 What type of senior care service are you looking for?
3 What budget do you have in mind for senior care?
4 How soon do you need to find care?
5 Additional details

Thank you for your interest!

Our team will be in touch shortly to help with next steps.