Avamere Rehabilitation of Issaquah
Nursing Home, Palliative Care & Respite Care · Issaquah, WA
CMS overall rating Info CMS (the Centers for Medicare & Medicaid Services) is the federal agency that rates nursing home quality. Its Overall Rating runs from 1 to 5 stars, combining health inspections, staffing, and quality measures, with inspections weighted most heavily.

Avamere Rehabilitation of Issaquah

Nursing Home, Palliative Care & Respite Care · Issaquah, WA
CMS overall rating Info CMS (the Centers for Medicare & Medicaid Services) is the federal agency that rates nursing home quality. Its Overall Rating runs from 1 to 5 stars, combining health inspections, staffing, and quality measures, with inspections weighted most heavily.
Calculator: See prices in your area
Avamere Rehabilitation of Issaquah accepts Medicare, Medicaid, and private pay.

Overview of Avamere Rehabilitation of Issaquah

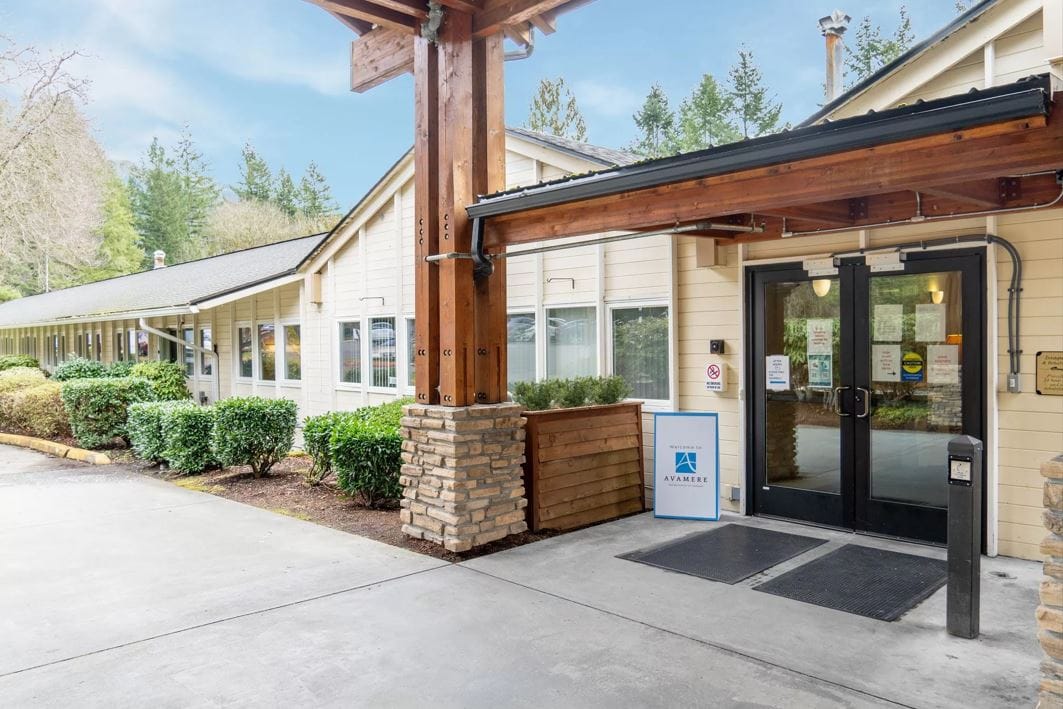
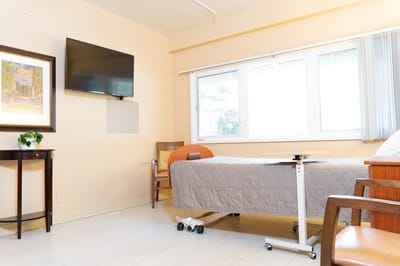
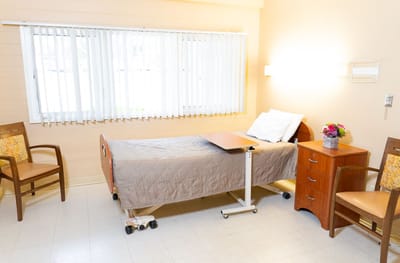
In Issaquah, Washington, Avamere Rehabilitation Center stands tall as a trusted facility of expert care. With skilled nursing, rehabilitation, and long-term services, they guide residents toward recovery with precision. Their adept team, proficient in managing diverse medical conditions, ensures tailored attention for each resident’s unique needs.
Avamere’s commitment also shines through their skilled therapists and 24/7 licensed nursing. With advanced safety features and reliable nurse call systems, families find peace knowing their loved ones are in capable hands. Avamere is definitely a dependable ally on the journey to health and well-being.

(425) 392-1271

Quality ratings

Measured by Centers for Medicare & Medicaid Services (CMS)

Overall rating Info The Overall CMS Rating combines results from health inspections, staffing levels and quality measures. Health inspections carry the most weight. Staffing and quality scores can increase or decrease the final rating based on performance compared to state and national standards.
▼ 38.0% Below WA avg. ▼ 38.0% Below WA avg.WA average: 3.2Click the badge to see the full State ranking.Click here to see the full State ranking.
Health Inspection Info Based on the results of the facility's three most recent standard inspections and any complaint investigations. CMS reviews the number, scope, and severity of deficiencies, with more recent findings weighted more heavily.
▼ 29.0% Below WA avg. ▼ 29.0% Below WA avg.WA average: 2.8Click the badge to see the full State ranking.Click here to see the full State ranking.
Staffing Info Measures average nursing staff hours per resident per day, including Registered Nurses (RNs) and total nursing staff. Ratings are adjusted based on the level of care residents require and are compared to state and national benchmarks.
▼ 41.6% Below WA avg. ▼ 41.6% Below WA avg.WA average: 3.4Click the badge to see the full State ranking.Click here to see the full State ranking.
Quality Measures Info Based on clinical and physical health indicators reported to CMS, such as hospital readmissions, falls, pressure ulcers, and improvements in mobility. These measures reflect how well residents' health needs are being managed.
▲ 1.7% Above WA avg. ▲ 1.7% Above WA avg.WA average: 3.9Click the badge to see the full State ranking.Click here to see the full State ranking.

Staffing hours breakdown

Info Daily nursing hours per resident by staff type, reported to CMS. Higher is generally better — compare this facility to state and national averages to see where staffing stands.

Hours per resident per day — compared to Washington state averages

Total nursing care / resident Info This home is ranked 77th out of 90 homes in Washington for nurse hours. Total adjusted nursing hours per resident per day, combining RN, LPN, and aide time. CMS adjusts this for case-mix so facilities can be fairly compared.
3h 31m per day
Rank #77 / 90Nurse hours — State benchmarkedThis home is ranked 77th out of 90 homes in Washington. Shows adjusted nurse hours per resident per day benchmarked to the Washington average, with a ranking across 90 Washington facilities. More hours mean more direct care. The national average is about 3.5 hrs; below 3.0 is a red flag.Ranking totals vary by category as each rank only includes facilities that report data for that metric. Homes missing that data point aren't included in the ranking.Click the rank badge to see the full State ranking.Click here to see the full State ranking.
This facility Washington avg (4h 13m per day)
vs Washington avg
-17%

3 of 6 metrics below state avg

Standout metric LPN / LVN is +29% above state avg
Staff typeHours / Day / Residentvs state avg
Registered Nurse (RN) Info RNs hold the highest nursing license and can assess residents, interpret test results, and direct care plans. More RN hours per day often signals stronger clinical oversight and faster response to health changes. 35m per day ▼ 35% State avg: 53m per day · National avg: 41m per day
LPN / LVN Info Licensed Practical Nurses (LPNs) or Licensed Vocational Nurses (LVNs) deliver routine hands-on care — medication administration, wound dressing, and monitoring vital signs. They work under RN supervision and make up a large share of daily bedside care. 1h 3m per day ▲ 29% State avg: 49m per day · National avg: 52m per day
Nurse Aide Info Certified Nurse Aides (CNAs) provide the most direct day-to-day assistance: bathing, dressing, feeding, and mobility. Nurse aide hours are typically the largest staffing category and directly affect residents' quality of life. 2h 39m per day ■ Avg State avg: 2h 41m per day · National avg: 2h 21m per day
Weekend Total Nursing Info Combined nursing hours (RN + LPN + Nurse Aide) per resident per day on weekends. Staffing often drops on weekends — this figure reveals whether the facility maintains adequate coverage outside of weekday hours. 3h 44m per day ■ Avg State avg: 3h 47m per day · National avg: 3h 26m per day
Physical Therapist Info Hours per resident per day provided by licensed Physical Therapists (PTs) or PT Assistants. PT services help residents recover mobility after injury or illness and are especially important for post-acute (short-stay) rehabilitation. 2m per day ▼ 50% State avg: 5m per day · National avg: 4m per day
Weekend RN Info Registered nurse hours specifically on weekends. Facilities sometimes reduce RN presence on Saturdays and Sundays — a low weekend RN figure compared to weekday hours can indicate reduced clinical oversight when most administrative staff are absent. 22m per day ▼ 43% State avg: 38m per day · National avg: 29m per day

Capacity and availability

This home usually has availability

Lower occupancy than the Washington average: 72.5%
Occupancy rate
52.9% Rank #278 / 310Occupancy rate — State benchmarkedThis home is ranked 278th out of 310 homes in Washington. Shows this facility's occupancy rate versus the Washington average, with its Statewide rank out of 310. Higher occupancy signals strong local demand and financial stability.Ranking totals vary by category as each rank only includes facilities that report data for that metric. Homes missing that data point aren't included in the ranking.Click the rank badge to see the full State ranking.Click here to see the full State ranking.
Avg. Length of Stay
96 days
Bed community size
140-bed community Rank #21 / 366Bed count — State benchmarkedThis home is ranked 21st out of 366 homes in Washington. Shows this facility's certified or reported bed count compared to other Washington facilities. Larger communities may offer more amenities, programs, and on-site services for residents and families.Ranking totals vary by category as each rank only includes facilities that report data for that metric. Homes missing that data point aren't included in the ranking.Click the rank badge to see the full State ranking.Click here to see the full State ranking.
A larger shared setting that may offer more common spaces and organized community services.
Walk Score
Walk Score: 16 / 100 Rank #554 / 628Walk Score — State benchmarkedThis home is ranked 554th out of 628 homes in Washington. Shows how walkable this facility's neighborhood is compared to the average Walk Score across Washington facilities. Higher scores benefit residents, families, and staff.Ranking totals vary by category as each rank only includes facilities that report data for that metric. Homes missing that data point aren't included in the ranking.Click the rank badge to see the full State ranking.Click here to see the full State ranking.
Car-dependent. Most errands require a car, with limited nearby walkable options.

About this community

Contact Avamere Rehabilitation of Issaquah

Staffing Data

Reporting period: October 1 – December 31, 2025 (Q4 2025). Source: CMS Payroll-Based Journal report.

Total staff 101
Employees 98
Contractors 3
Staff to resident ratio 1.23 : 1
34% fewer staff per resident than Washington average
Washington average ratio: 1.86 : 1 Washington average ratio: 1.86 : 1See full Washington ranking
Avg staff/day 49
Average shift 8.5 hours
5% better than Washington average
Washington average: 8.1 hours Washington average shift: 8.1 hoursSee full Washington ranking
Total staff hours (quarter) 38,450

Nursing staff breakdown

Q4 2025 · Oct 1 – Dec 31 More info This data comes from the CMS Payroll-Based Journal report covering October 1 – December 31, 2025.
Registered Nurse

Manages medical care and health needs.

RN Staff Info 11 total: 10 full-time employees and 1 contractor. 11
Average shift length Info Average shift length. Calculated as total hours divided by days worked and average staff per day. 9.3 hours
Licensed Practical Nurse

Assists with medical care and medications.

LPN Staff Info All 15 LPN Staff are full-time employees. No contractors work on this role. 15
Average shift length Info Average shift length. Calculated as total hours divided by days worked and average staff per day. 10 hours
Certified Nursing Assistant

Helps with daily care and mobility.

CNA Staff Info All 47 CNA Staff are full-time employees. No contractors work on this role. 47
Average shift length Info Average shift length. Calculated as total hours divided by days worked and average staff per day. 8.7 hours

Contractor staffing

Q4 2025 · Oct 1 – Dec 31 More info This data comes from the CMS Payroll-Based Journal report covering October 1 – December 31, 2025.

Total hours from contractors

0.3%

115 contractor hours this quarter

Registered Nurse: 1 Medical Director: 1 Occupational Therapy Assistant: 1

Staff by category

Q4 2025 · Oct 1 – Dec 31 More info This data comes from the CMS Payroll-Based Journal report covering October 1 – December 31, 2025.
Certified Nursing Assistant4704720,25392100%8.7
Licensed Practical Nurse150157,32992100%10
Registered Nurse101113,75792100%9.3
Other Dietary Services Staff3039149098%7.5
Physical Therapy Aide4048446672%7.1
Speech Language Pathologist4048376672%6.3
RN Director of Nursing2026896470%6.9
Nurse Practitioner2025686672%8
Mental Health Service Worker1014886368%7.8
Dietitian1014726874%6.9
Physical Therapy Assistant1014606267%7.4
Dental Services Staff1013855560%7
Administrator1013844852%8
Qualified Social Worker1013685762%6.5
Respiratory Therapy Technician2023155560%5.7
Occupational Therapy Aide2022082729%7.7
Clinical Nurse Specialist101761213%6.3
Occupational Therapy Assistant0115578%7.9
Medical Director011481213%4
47 Certified Nursing Assistant
% of Days 100%
15 Licensed Practical Nurse
% of Days 100%
11 Registered Nurse
% of Days 100%
3 Other Dietary Services Staff
% of Days 98%
4 Physical Therapy Aide
% of Days 72%
4 Speech Language Pathologist
% of Days 72%
2 RN Director of Nursing
% of Days 70%
2 Nurse Practitioner
% of Days 72%
1 Mental Health Service Worker
% of Days 68%
1 Dietitian
% of Days 74%
1 Physical Therapy Assistant
% of Days 67%
1 Dental Services Staff
% of Days 60%
1 Administrator
% of Days 52%
1 Qualified Social Worker
% of Days 62%
2 Respiratory Therapy Technician
% of Days 60%
2 Occupational Therapy Aide
% of Days 29%
1 Clinical Nurse Specialist
% of Days 13%
1 Occupational Therapy Assistant
% of Days 8%
1 Medical Director
% of Days 13%

Penalties and fines

Includes penalties issued in 2024

Federal penalties imposed by CMS for regulatory violations, including civil money penalties (fines) and denials of payment for new Medicare/Medicaid admissions.

Source: CMS Penalties Database (Data as of Jan 2026)

Total fines amount $71K Rank #55 / 92Federal fines — State benchmarkedThis home is ranked 55th out of 92 homes in Washington. Shows this facility's cumulative CMS federal fine dollars versus the Washington average among facilities with fines, and where it ranks among 92 facilities in the pool. Lower total dollars mean a better rank.Ranking totals vary by category as each rank only includes facilities that report data for that metric. Homes missing that data point aren't included in the ranking.Click the rank badge to see the full State ranking.Click here to see the full State ranking.
14% lower than Washington average

Washington average: $82K

Number of fines 2
8% more fines than Washington average

Washington average: 1.8

Payment Denials Info Serious action where Medicare and/or Medicaid temporarily stops payments for new residents until issues are fixed. 0
100% fewer payment denials than Washington average

Washington average: 0.3

Fines amount comparison
This facility $71K
Washington average $82K
Penalty History

Penalties are imposed by CMS for violations of federal nursing home regulations.

1 penalty in the past 3 years

Feb 6, 2024 · $49K

Civil Money Penalty Info Fines imposed for noncompliance, which can be assessed per day or per instance of violation. Feb 6, 2024
$49K

Last updated: Jan 2026

Quality of care over time

These measures show how residents usually do over time at this home, based on health outcomes and preventive care.

High-risk clinical events score Info A composite score based on pressure ulcers, falls with injury, weight loss, walking ability decline, and activities of daily living decline. 10.6
6% worse than Washington average

Washington average: 10.0

Functional decline score Info A composite score based on activities of daily living decline, walking ability decline, and incontinence. 19.9
In line with Washington average

Washington average: 20.9

Long-stay resident measures
Above average Washington avg: 3.6 Info CMS star rating based on long-stay quality measure performance. 5 stars = significantly above average, 1 star = significantly below average.
Need for Help with Daily Activities Increased Info Percent of long-stay residents whose need for help with daily activities has increased 21.7%
32% worse than Washington average

Washington average: 16.4%

Walking Ability Worsened Info Percent of long-stay residents whose ability to move independently worsened 19.4%
11% better than Washington average

Washington average: 21.8%

Low Risk Residents with Bowel/Bladder Incontinence Info Percent of low risk long-stay residents who lose control of their bowels or bladder 18.7%
23% better than Washington average

Washington average: 24.3%

Falls with Major Injury Info Percent of long-stay residents experiencing one or more falls with major injury 1.1%
56% better than Washington average

Washington average: 2.6%

High Risk Residents with Pressure Ulcers Info Percent of long-stay high risk residents with pressure ulcers 3.0%
40% better than Washington average

Washington average: 4.9%

Urinary Tract Infection Info Percent of long-stay residents with a urinary tract infection 1.1%
35% better than Washington average

Washington average: 1.7%

Lost Too Much Weight Info Percent of long-stay residents who lose too much weight 7.9%
36% worse than Washington average

Washington average: 5.8%

Depressive Symptoms Info Percent of long-stay residents who have depressive symptoms 93.5%
477% worse than Washington average

Washington average: 16.2%

Antipsychotic Use Info Percent of long-stay residents who received an antipsychotic medication 12.9%
11% better than Washington average

Washington average: 14.5%

Pneumococcal Vaccine Info Percent of long-stay residents assessed and appropriately given the pneumococcal vaccine 99.2%
In line with Washington average

Washington average: 96.2%

Influenza Vaccine Info Percent of long-stay residents assessed and appropriately given the seasonal influenza vaccine 96.2%
In line with Washington average

Washington average: 93.8%

Hospitalizations per 1,000 days Info Number of hospitalizations per 1,000 long-stay resident days. 1.43
In line with Washington average

Washington average: 1.38

ED visits per 1,000 days Info Number of outpatient emergency department visits per 1,000 long-stay resident days. 2.72
80% worse than Washington average

Washington average: 1.51

Short-stay resident measures
Above average Washington avg: 3.6 Info CMS star rating based on short-stay quality measure performance. 5 stars = much above average, 1 star = much below average.
Pneumococcal Vaccine Info Percent of short-stay residents assessed and appropriately given the pneumococcal vaccine 91.9%
In line with Washington average

Washington average: 88.1%

Antipsychotic medication increase Info Percent of short-stay residents who newly received an antipsychotic medication 0.0%
100% better than Washington average

Washington average: 1.4%

Influenza Vaccine Info Percent of short-stay residents assessed and appropriately given the seasonal influenza vaccine 86.5%
5% better than Washington average

Washington average: 82.0%

Re-hospitalized after SNF stay Info Percentage of short-stay residents who were re-hospitalized after their nursing home admission. 27.6%
39% worse than Washington average

Washington average: 19.9%

Emergency department visits Info Percentage of short-stay residents who had an outpatient emergency department visit. 18.8%
42% worse than Washington average

Washington average: 13.2%

Falls with major injury Info Percentage of SNF residents who experience falls with major injury during their stay. 0.0%
100% better than Washington average

Washington average: 0.8%

Ability to care for self at discharge Info Percentage of residents at or above expected ability to care for themselves at discharge. 77.6%
44% better than Washington average

Washington average: 53.7%

Successful return to home or community Info Rate of successful return to home or community from a skilled nursing facility. 64.4%
27% better than Washington average

Washington average: 50.6%

Breakdown by payment type

Medicare

58% of new residents, usually for short-term rehab.

Typical stay 24 days

Private pay

35% of new residents, often for short stays.

Typical stay 1 - 2 months

Medicaid

7% of new residents, often for long-term daily care.

Typical stay 2 years

Facility Characteristics

Source: CMS Long-Term Care Facility Characteristics (Data as of Jan 2026)

Total residents 82
Medicare
7
8.5% of residents
Medicaid
54
65.9% of residents
Private pay or other
21
25.6% of residents
Programs & Services
Residents Group

Residents meet regularly to discuss policies, care quality, and activities

Active Resident Council

Organized group of residents that meets regularly to discuss facility policies, quality of life, and activities.

Finances and operations

Based on CMS SNF Cost Report for fiscal year ending in 12/2023.

Privately-owned community
Operated by a single business entity.
Net patient revenue Info Net patient revenue — what the home actually collects for resident care, after contractual allowances, bad debt and discounts are subtracted from its gross charges (CMS cost report, Worksheet G-3). It covers resident care only; money the home earns from other sources is shown separately as "Other income."
$11.3M
Net patient income Info Net patient income: net patient revenue minus the home's total operating expenses. A positive figure means it earns more from resident care than it spends to deliver it; a negative figure means the opposite. It excludes non-operating "other income."
-$322.5K
Privately-owned community Operated by a single business entity.
Net patient revenue Info Net patient revenue — what the home actually collects for resident care, after contractual allowances, bad debt and discounts are subtracted from its gross charges (CMS cost report, Worksheet G-3). It covers resident care only; money the home earns from other sources is shown separately as "Other income."
$11.3M Rank #71 / 94Revenue — State benchmarkedThis home is ranked 71st out of 94 homes in Washington. Shows this facility's annual revenue compared to the Washington average. Higher revenue generally means more resources for staffing and capital — read alongside Payroll %.Ranking totals vary by category as each rank only includes facilities that report data for that metric. Homes missing that data point aren't included in the ranking.Click the rank badge to see the full State ranking.Click here to see the full State ranking.
Net patient income Info Net patient income: net patient revenue minus the home's total operating expenses. A positive figure means it earns more from resident care than it spends to deliver it; a negative figure means the opposite. It excludes non-operating "other income."
-$322.5K
Other income Info Money the home earns outside of resident care — such as investments, grants, rentals and other non-operating sources (CMS cost report, Worksheet G-3). It is tracked separately from net patient revenue: it is not part of that figure, and it is not included in net patient income.
$4.9K
Payroll costs Info Staff salaries plus wage-related costs — benefits such as payroll taxes, health insurance and retirement — from the home's own accounting records (CMS cost report, Worksheet A). Contract or agency labor is counted separately, under other operating costs. Rank #51 / 94Payroll — State benchmarkedThis home is ranked 51st out of 94 homes in Washington. Shows total annual staff payroll benchmarked to the Washington average. Higher payroll investment relative to peers often signals better staffing and less reliance on cheaper contract labor.Ranking totals vary by category as each rank only includes facilities that report data for that metric. Homes missing that data point aren't included in the ranking.Click the rank badge to see the full State ranking.Click here to see the full State ranking.
$6.6M 58.8% of net patient revenue Info Payroll as a share of revenue: staff salaries and wage-related benefits divided by net patient revenue. A higher figure means more of each revenue dollar goes to staff pay. Rank #19 / 94Payroll % — State benchmarkedThis home is ranked 19th out of 94 homes in Washington. Shows payroll as a percentage of revenue versus the Washington average. Well-run Washington facilities typically land around 53–61% — the top third Statewide. Below 25% may signal understaffing or heavy agency use — read with Staffing ratings.Ranking totals vary by category as each rank only includes facilities that report data for that metric. Homes missing that data point aren't included in the ranking.Click the rank badge to see the full State ranking.Click here to see the full State ranking.
Other operating costs Info Everything it costs to run the home apart from payroll — food, utilities, supplies, maintenance, contract labor and administration. Calculated as total operating expense minus payroll (staff salaries and wage-related benefits).
$5.0M
Total costs Info The home's total operating expense for the year — all the costs of running it, salaries included (CMS cost report, Worksheet G-3).
$11.6M

Who this home usually serves

TYPE OF STAY

Mostly short-term rehab stays

Most residents typically stay for a few weeks or months before returning home or moving on.

Most new residents arrive under Medicare (58% of admissions), and a typical Medicare stay runs around 24 days.

Admissions
253 total

Coverage residents most often arrive under.

Medicare 58%
Private pay 35%
Medicaid 7%
Discharges
236 total

Coverage residents most often leave under.

Medicare 38%
Private pay 42%
Medicaid 20%

Places of interest near Avamere Rehabilitation of Issaquah

Address 1 mile from city center — 1.19 miles to nearest hospital (Swedish Issaquah Campus)

Calculate Travel Distance to Avamere Rehabilitation of Issaquah

Add your location

Address

Compare Nursing Home around Issaquah

The information below is reported by the Washington Department of Social and Health Services, Residential Care Services.

2 facilities compared · CMS & WA Dept. of Health data

Timber Ridge
NH
AL
IL
MC
Issaquah (Talus)
26
Facility 26
WA AVG 82
Rank #352 / 366
88.5%
Facility 88.5%
WA AVG 72.5%
Rank #56 / 310
+22%
5.65
Facility 5.65
WA AVG 4.22
Rank #5 / 90
-34%+34%
$0
Facility $0
WA AVG $87.7k
Rank #1 / 92
17
Facility 17
WA AVG 48.9
Rank #6 / 92
5.7
Facility 5.7
WA AVG 6.9
Rank #37 / 92
-23A+
19
Facility 19
WA AVG 51
Rank #532 / 628
Lcs Timber Ridge LLC
$31.6M
Facility $31.6M
WA AVG $13.2M
Rank #7 / 94
$13.6M
Facility $13.6M
WA AVG $5.7M
Rank #12 / 94
43%
Facility 43%
WA AVG 45.5%
Rank #77 / 94
505518
Avamere Rehabilitation of Issaquah
NH
PC
RC
Issaquah (Sycamore)
140
Facility 140
WA AVG 82
Rank #21 / 366
52.9%
Facility 52.9%
WA AVG 72.5%
Rank #278 / 310
-27%
3.52
Facility 3.52
WA AVG 4.22
Rank #77 / 90
-24%-17%
$48.7k
Facility $48.7k
WA AVG $87.7k
Rank #55 / 92
60
Facility 60
WA AVG 48.9
Rank #59 / 92
10.0
Facility 10.0
WA AVG 6.9
Rank #73 / 92
483-
16
Facility 16
WA AVG 51
Rank #554 / 628
Carl Tabor
$11.3M
Facility $11.3M
WA AVG $13.2M
Rank #71 / 94
$6.6M
Facility $6.6M
WA AVG $5.7M
Rank #51 / 94
58.8%
Facility 58.8%
WA AVG 45.5%
Rank #19 / 94
505004

Financial Assistance for
Nursing Home in Washington

Avamere Rehabilitation of Issaquah is located in Issaquah, Washington.
Here are the financial assistance programs available to residents in Washington.

Get Financial aid guidance

Community Options Program Entry System (COPES)

WA Medicaid COPES

Age 65+ or disabled
General Washington resident, Medicaid-eligible, nursing home-level care need.
Income Limits (2025) ~$2,829/month 300% FBR, individual
Asset Limits $2,000 (individual), $3,000 (couple).
WA

High demand in urban areas (e.g., Seattle).

Benefits
Personal care (5-7 hours/day) Respite (240 hours/year) Adult day care ($70/day) Home modifications ($1,500 avg.)

Washington Family Caregiver Support Program

WA NFCSP

Age Caregiver of someone 60+ (or with dementia)
General Washington resident.
Income Limits No strict limit; prioritizes low-income.
Asset Limits Not applicable.
WA

High urban demand; rural outreach.

Benefits
In-home respite (4-6 hours/day) Adult day care (~$70/day) Short-term facility care (up to 5 days)

Community First Choice (CFC)

Washington Community First Choice

Age 65+ (or disabled 18+)
General WA resident, Medicaid-eligible, need help with 2+ ADLs/IADLs.
Income Limits (2025) ~$2,829/month; QIT optional.
Asset Limits $2,000 (individual), $3,000 (couple).
WA

Broader than COPES; serves ~20,000; self-directed option.

Benefits
Personal care (4-6 hours/day) Respite (~240 hours/year) Assistive devices Training Transportation

Older Americans Act (OAA) Services

Washington OAA Services

Age 60+
General WA resident; no income/asset limits.
Income Limits (2025) None; donations encouraged.
Asset Limits Not assessed.
WA

13 AAAs; includes Meals on Wheels; rural focus.

Benefits
Meals (~$5-$7/meal) Transportation Homemaker services (~4 hours/week) Respite (~5 days/year) Legal aid

Medicare Savings Program (MSP)

Washington Medicare Savings Program

Age 65+ or disabled
General WA resident, Medicare Part A/B.
Income Limits (2025) ~$2,510/month (QMB), ~$3,380/month (SLMB), ~$3,598/month (QI)—individual.
Asset Limits $9,430 (individual), $14,130 (couple).
WA

Includes Extra Help for Part D; no waitlist.

Benefits
Covers Part B premiums ($174.70/month) Deductibles ($240/year) Copays (~20%)

VA Aid and Attendance (A&A) and Housebound Benefits

Washington VA Aid and Attendance/Housebound

Age 65+ or disabled veteran/spouse
General WA resident, wartime service, ADL help (A&A) or homebound.
Income Limits (2025) Net income < ~$1,984/month (veteran with dependent, A&A); pension offsets income.
Asset Limits ~$155,356 net worth
WA

High veteran use; supports rural/urban needs.

Benefits
Cash (~$1,433-$2,642/month veteran, ~$951-$1,318 spouse) for care costs

Senior Citizens Property Tax Exemption

Washington Senior Property Tax Exemption

Age 61+ or disabled retiree
General WA resident, homeowner, income-based.
Income Limits (2025) ~$45,000-$70,000/year varies by county, e.g., King: $70,000
Asset Limits Not assessed; home value cap varies ~$250,000-$400,000
WA

Saves ~$500-$1,500/year; offered statewide.

Benefits
Tax exemption (~$500-$1,500/year depending on county)

Senior Farmers’ Market Nutrition Program (SFMNP)

Washington SFMNP

Age 60+
General WA resident, low-income.
Income Limits (2025) ~$2,322/month 185% FPL
Asset Limits Not assessed.
WA

Vouchers (~$80/season); serves ~20,000 via AAAs.

Benefits
Vouchers (~$80/season) for produce at farmers’ markets

Frequently Asked Questions about Avamere Rehabilitation of Issaquah

What neighborhood is Avamere Rehabilitation of Issaquah in?

Avamere Rehabilitation of Issaquah is in the Sycamore neighborhood.

Is Avamere Rehabilitation of Issaquah in a walkable area?

Avamere Rehabilitation of Issaquah has a walk score of 16. Car-dependent. Most errands require a car, with limited nearby walkable options.

What is the occupancy rate at Avamere Rehabilitation of Issaquah?

Avamere Rehabilitation of Issaquah's occupancy is 52.9%.

Are there photos of Avamere Rehabilitation of Issaquah?

Yes — there are 4 photos of Avamere Rehabilitation of Issaquah in the photo gallery on this page.

What is the phone number of Avamere Rehabilitation of Issaquah?

(425) 392-1271 will put you in contact with the team at Avamere Rehabilitation of Issaquah.

Is Avamere Rehabilitation of Issaquah Medicare or Medicaid certified?

Yes — Avamere Rehabilitation of Issaquah is a CMS-certified provider of Medicare and Medicaid.

Guides for Better Senior Living

Care Cost Calculator: See Prices in Your Area

Nursing Home Data Explorer

Don’t Wait Too Long: 7 Red Flag Signs Your Parent Needs Assisted Living Now

The True Cost of Assisted Living in 2025 – And How Families Are Paying For It

Understanding Senior Living Costs: Pricing Models, Discounts & Financial Assistance