Willensky Residence
Nursing Home, Assisted Living, Hospice Care, Independent Living & Memory Care · Beachwood, OH
CMS overall rating Info CMS (the Centers for Medicare & Medicaid Services) is the federal agency that rates nursing home quality. Its Overall Rating runs from 1 to 5 stars, combining health inspections, staffing, and quality measures, with inspections weighted most heavily.

Willensky Residence

Nursing Home, Assisted Living, Hospice Care, Independent Living & Memory Care · Beachwood, OH
CMS overall rating Info CMS (the Centers for Medicare & Medicaid Services) is the federal agency that rates nursing home quality. Its Overall Rating runs from 1 to 5 stars, combining health inspections, staffing, and quality measures, with inspections weighted most heavily.
Calculator: See prices in your area
Willensky Residence accepts Medicare, Medicaid, and private pay.

Overview of Willensky Residence

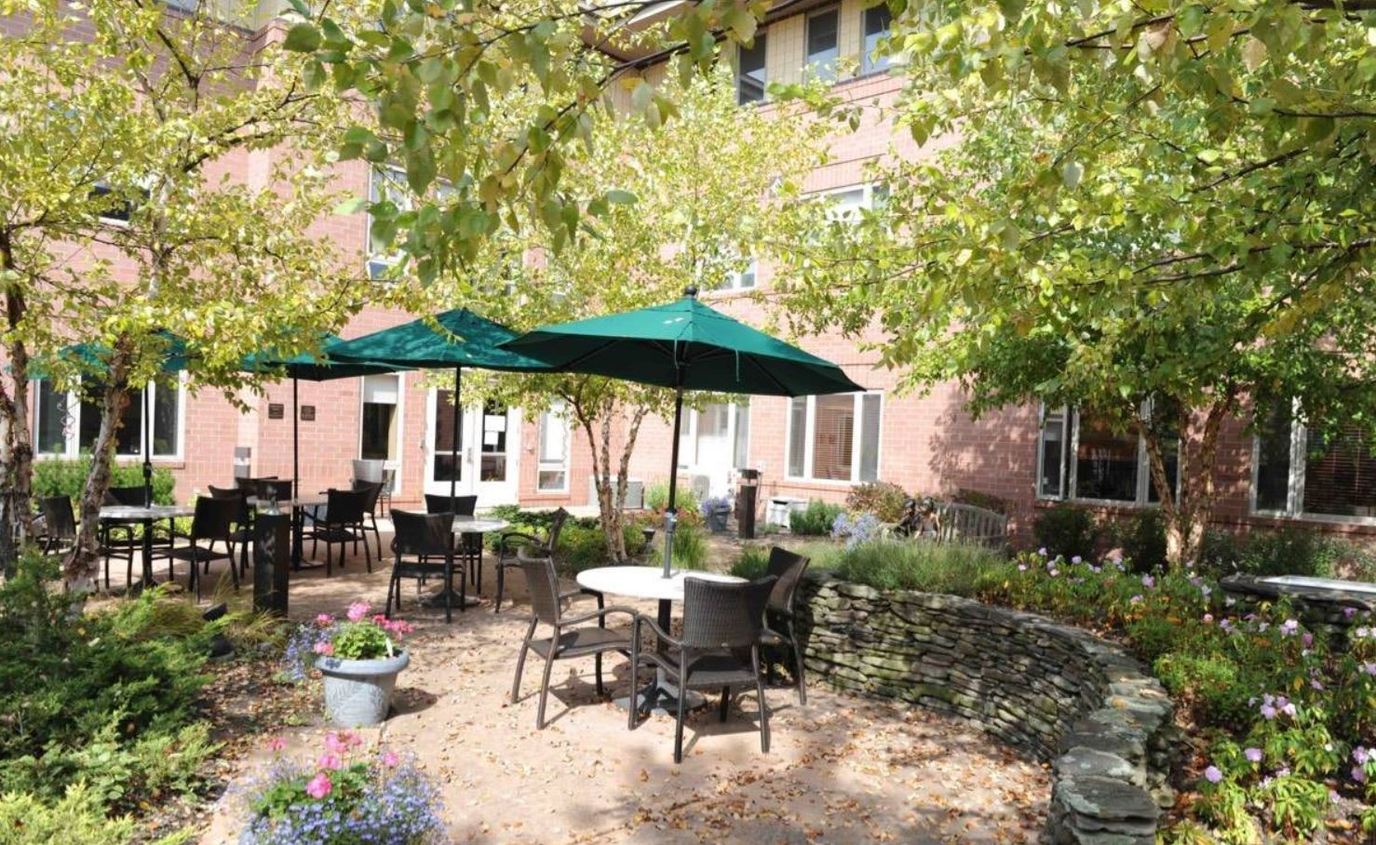
With the seniors’ welfare in mind, Willensky Residence on the Beachwood Campus which is connected to the Daughters of Miriam building, is a blissful senior living community providing memory care. Focusing on the strengths of its residents while minimizing the challenges of memory loss, the community strives to deliver individualized and dedicated care round-the-clock. With multi-sensory rooms provided, Willensky Residence ensures its residents’ comfort.

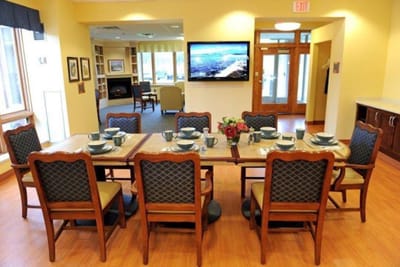
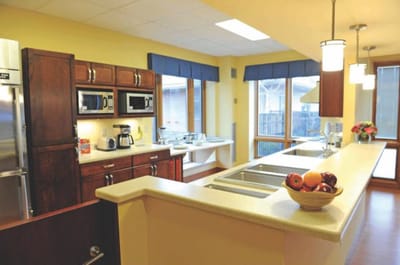
Willensky Residence features an innovative It’s Never 2 Late technology system that provides residents opportunities to connect and enjoy to foster wellness and empowerment despite of physical and cognitive ability. The community orchestrates activities to stimulate the mind, body, and spirit, accompanied by continued education and support for their families. Amenities include elegant common areas and two secure outdoor courtyards where residents may enjoy their walk around or sit and relax to ease their minds.

Quality ratings

Measured by Centers for Medicare & Medicaid Services (CMS)

Overall rating Info The Overall CMS Rating combines results from health inspections, staffing levels and quality measures. Health inspections carry the most weight. Staffing and quality scores can increase or decrease the final rating based on performance compared to state and national standards.
Health Inspection Info Based on the results of the facility's three most recent standard inspections and any complaint investigations. CMS reviews the number, scope, and severity of deficiencies, with more recent findings weighted more heavily.
Staffing Info Measures average nursing staff hours per resident per day, including Registered Nurses (RNs) and total nursing staff. Ratings are adjusted based on the level of care residents require and are compared to state and national benchmarks.
Quality Measures Info Based on clinical and physical health indicators reported to CMS, such as hospital readmissions, falls, pressure ulcers, and improvements in mobility. These measures reflect how well residents' health needs are being managed.

Staffing hours breakdown

Info Daily nursing hours per resident by staff type, reported to CMS. Higher is generally better — compare this facility to state and national averages to see where staffing stands.

Hours per resident per day — compared to state averages

Total nursing care / resident Info Total adjusted nursing hours per resident per day, combining RN, LPN, and aide time. CMS adjusts this for case-mix so facilities can be fairly compared.
5h 5m per day
Rank #14 / 210Nurse hours — State benchmarkedThis home is ranked 14th out of 210 homes in Ohio. Shows adjusted nurse hours per resident per day benchmarked to the Ohio average, with a ranking across 210 Ohio facilities. More hours mean more direct care. The national average is about 3.5 hrs; below 3.0 is a red flag.Rankings are based only on facilities in Ohio that report data for that category. Facilities without available data are excluded from the ranking.Click the rank badge to see the full State ranking.Click here to see the full State ranking.
vs avg
Staff typeHours / Day / Residentvs state avg
Registered Nurse (RN) Info RNs hold the highest nursing license and can assess residents, interpret test results, and direct care plans. More RN hours per day often signals stronger clinical oversight and faster response to health changes. 1h 13m per day
LPN / LVN Info Licensed Practical Nurses (LPNs) or Licensed Vocational Nurses (LVNs) deliver routine hands-on care — medication administration, wound dressing, and monitoring vital signs. They work under RN supervision and make up a large share of daily bedside care. 1h 29m per day
Nurse Aide Info Certified Nurse Aides (CNAs) provide the most direct day-to-day assistance: bathing, dressing, feeding, and mobility. Nurse aide hours are typically the largest staffing category and directly affect residents' quality of life. 2h 39m per day
Weekend Total Nursing Info Combined nursing hours (RN + LPN + Nurse Aide) per resident per day on weekends. Staffing often drops on weekends — this figure reveals whether the facility maintains adequate coverage outside of weekday hours. 4h 38m per day
Physical Therapist Info Hours per resident per day provided by licensed Physical Therapists (PTs) or PT Assistants. PT services help residents recover mobility after injury or illness and are especially important for post-acute (short-stay) rehabilitation. 4m per day
Weekend RN Info Registered nurse hours specifically on weekends. Facilities sometimes reduce RN presence on Saturdays and Sundays — a low weekend RN figure compared to weekday hours can indicate reduced clinical oversight when most administrative staff are absent. 46m per day

Capacity and availability

This home usually has availability

Lower occupancy than the state average
Occupancy rate
65.3% Rank #178 / 211Occupancy rate — State benchmarkedThis home is ranked 178th out of 211 homes in Ohio. Shows this facility's occupancy rate versus the Ohio average, with its Statewide rank out of 211. Higher occupancy signals strong local demand and financial stability.Rankings are based only on facilities in Ohio that report data for that category. Facilities without available data are excluded from the ranking.Click the rank badge to see the full State ranking.Click here to see the full State ranking.
Avg. Length of Stay
56 days
Bed community size
233-bed community Rank #2 / 323Bed count — State benchmarkedThis home is ranked 2nd out of 323 homes in Ohio. Shows this facility's certified or reported bed count compared to other Ohio facilities. Larger communities may offer more amenities, programs, and on-site services for residents and families.Rankings are based only on facilities in Ohio that report data for that category. Facilities without available data are excluded from the ranking.Click the rank badge to see the full State ranking.Click here to see the full State ranking.
A large-scale community that may provide a wide range of amenities, services, and structured programs.
Walk Score
Walk Score: 54 / 100 Rank #209 / 705Walk Score — State benchmarkedThis home is ranked 209th out of 705 homes in Ohio. Shows how walkable this facility's neighborhood is compared to the average Walk Score across Ohio facilities. Higher scores benefit residents, families, and staff.Rankings are based only on facilities in Ohio that report data for that category. Facilities without available data are excluded from the ranking.Click the rank badge to see the full State ranking.Click here to see the full State ranking.
Moderately walkable. Some errands can be accomplished on foot, with a mix of nearby amenities.

Contact Willensky Residence

Staffing Data

Reporting period: October 1 – December 31, 2025 (Q4 2025). Source: CMS Payroll-Based Journal report.

Total staff 236
Employees 232
Contractors 4
Staff to resident ratio 1.41 : 1
0% compared with State average

State average ratio: 0 : 0

Avg staff/day 97
Average shift 8.4 hours
0% compared with State average

State average: 0 hours

Total staff hours (quarter) 74,828

Nursing staff breakdown

Q4 2025 · Oct 1 – Dec 31 More info This data comes from the CMS Payroll-Based Journal report covering October 1 – December 31, 2025.
Registered Nurse

Manages medical care and health needs.

RN Staff Info All 34 RN Staff are full-time employees. No contractors work on this role. 34
Average shift length Info Average shift length. Calculated as total hours divided by days worked and average staff per day. 8 hours
Licensed Practical Nurse

Assists with medical care and medications.

LPN Staff Info All 47 LPN Staff are full-time employees. No contractors work on this role. 47
Average shift length Info Average shift length. Calculated as total hours divided by days worked and average staff per day. 8.6 hours
Certified Nursing Assistant

Helps with daily care and mobility.

CNA Staff Info 116 total: 113 full-time employees and 3 contractors. 116
Average shift length Info Average shift length. Calculated as total hours divided by days worked and average staff per day. 8.9 hours

Contractor staffing

Q4 2025 · Oct 1 – Dec 31 More info This data comes from the CMS Payroll-Based Journal report covering October 1 – December 31, 2025.

Total hours from contractors

2.9%

2,183 contractor hours this quarter

Certified Nursing Assistant: 3 Medical Director: 1

Staff by category

Q4 2025 · Oct 1 – Dec 31 More info This data comes from the CMS Payroll-Based Journal report covering October 1 – December 31, 2025.
Certified Nursing Assistant113311633,62192100%8.9
Licensed Practical Nurse4704717,17992100%8.6
Registered Nurse3403413,07792100%8
Clinical Nurse Specialist5051,8218289%9.1
RN Director of Nursing4041,7407076%7.5
Other Dietary Services Staff4041,7267278%7.2
Respiratory Therapy Technician2028806874%7.2
Speech Language Pathologist3038336571%7.7
Dental Services Staff2027785964%7.8
Physical Therapy Aide7077517076%7.2
Qualified Social Worker6065447177%5.3
Physical Therapy Assistant2024907278%6.8
Nurse Practitioner1014806065%8
Administrator1014436166%7.3
Occupational Therapy Aide1014026166%6.6
Medical Director011652628%2.5
116 Certified Nursing Assistant
% of Days 100%
47 Licensed Practical Nurse
% of Days 100%
34 Registered Nurse
% of Days 100%
5 Clinical Nurse Specialist
% of Days 89%
4 RN Director of Nursing
% of Days 76%
4 Other Dietary Services Staff
% of Days 78%
2 Respiratory Therapy Technician
% of Days 74%
3 Speech Language Pathologist
% of Days 71%
2 Dental Services Staff
% of Days 64%
7 Physical Therapy Aide
% of Days 76%
6 Qualified Social Worker
% of Days 77%
2 Physical Therapy Assistant
% of Days 78%
1 Nurse Practitioner
% of Days 65%
1 Administrator
% of Days 66%
1 Occupational Therapy Aide
% of Days 66%
1 Medical Director
% of Days 28%

Penalties and fines

Federal penalties imposed by CMS for regulatory violations, including civil money penalties (fines) and denials of payment for new Medicare/Medicaid admissions.

Source: CMS Penalties Database

No penalties in the past 3 years

No civil money penalties or payment denials were reported in the last 3 years.

Quality of care over time

These measures show how residents usually do over time at this home, based on health outcomes and preventive care.

High-risk clinical events score Info A composite score based on pressure ulcers, falls with injury, weight loss, walking ability decline, and activities of daily living decline. 9.2
58% worse than State average

State average: 5.8

Functional decline score Info A composite score based on activities of daily living decline, walking ability decline, and incontinence. 22.0
74% worse than State average

State average: 12.7

Long-stay resident measures
Need for Help with Daily Activities Increased Info Percent of long-stay residents whose need for help with daily activities has increased 14.5%
112% worse than State average

State average: 6.8%

Walking Ability Worsened Info Percent of long-stay residents whose ability to move independently worsened 19.4%
118% worse than State average

State average: 8.9%

Low Risk Residents with Bowel/Bladder Incontinence Info Percent of low risk long-stay residents who lose control of their bowels or bladder 32.2%
47% worse than State average

State average: 22.0%

Falls with Major Injury Info Percent of long-stay residents experiencing one or more falls with major injury 3.2%
5% better than State average

State average: 3.4%

High Risk Residents with Pressure Ulcers Info Percent of long-stay high risk residents with pressure ulcers 3.6%
9% better than State average

State average: 3.9%

Urinary Tract Infection Info Percent of long-stay residents with a urinary tract infection 0.4%
30% better than State average

State average: 0.5%

Lost Too Much Weight Info Percent of long-stay residents who lose too much weight 5.5%
12% better than State average

State average: 6.2%

Depressive Symptoms Info Percent of long-stay residents who have depressive symptoms 36.1%
50% worse than State average

State average: 24.0%

Antipsychotic Use Info Percent of long-stay residents who received an antipsychotic medication 3.1%
64% better than State average

State average: 8.4%

Pneumococcal Vaccine Info Percent of long-stay residents assessed and appropriately given the pneumococcal vaccine 67.9%
26% worse than State average

State average: 92.4%

Influenza Vaccine Info Percent of long-stay residents assessed and appropriately given the seasonal influenza vaccine 63.6%
33% worse than State average

State average: 94.5%

Short-stay resident measures
Pneumococcal Vaccine Info Percent of short-stay residents assessed and appropriately given the pneumococcal vaccine 65.1%
17% worse than State average

State average: 78.0%

Antipsychotic medication increase Info Percent of short-stay residents who newly received an antipsychotic medication 0.5%
62% better than State average

State average: 1.3%

Influenza Vaccine Info Percent of short-stay residents assessed and appropriately given the seasonal influenza vaccine 35.5%
53% worse than State average

State average: 75.6%

Breakdown by payment type

Medicare

16% of new residents, usually for short-term rehab.

Typical stay 17 days

Private pay

79% of new residents, often for short stays.

Typical stay 2 - 3 months

Medicaid

5% of new residents, often for long-term daily care.

Typical stay 4 - 5 months

Facility Characteristics

Source: CMS Long-Term Care Facility Characteristics (Data as of Jan 2026)

Total residents 167
Medicare
27
16.2% of residents
Medicaid
104
62.3% of residents
Private pay or other
36
21.6% of residents
Programs & Services
Residents Group

Residents meet regularly to discuss policies, care quality, and activities

CCRC

Part of a Continuing Care Retirement Community offering multiple care levels

Active Resident Council

Organized group of residents that meets regularly to discuss facility policies, quality of life, and activities.

Finances and operations

Based on CMS SNF Cost Report for fiscal year ending in 12/2023.

For-profit
Corporation
Net patient revenue Info Net patient revenue — what the home actually collects for resident care, after contractual allowances, bad debt and discounts are subtracted from its gross charges (CMS cost report, Worksheet G-3). It covers resident care only; money the home earns from other sources is shown separately as "Other income."
$8.0M
Net patient income Info Net patient income: net patient revenue minus the home's total operating expenses. A positive figure means it earns more from resident care than it spends to deliver it; a negative figure means the opposite. It excludes non-operating "other income."
-$4.4M
For-profit Corporation
Net patient revenue Info Net patient revenue — what the home actually collects for resident care, after contractual allowances, bad debt and discounts are subtracted from its gross charges (CMS cost report, Worksheet G-3). It covers resident care only; money the home earns from other sources is shown separately as "Other income."
$8.0M Rank #9 / 210Revenue — State benchmarkedThis home is ranked 9th out of 210 homes in Ohio. Shows this facility's annual revenue compared to the Ohio average. Higher revenue generally means more resources for staffing and capital — read alongside Payroll %.Rankings are based only on facilities in Ohio that report data for that category. Facilities without available data are excluded from the ranking.Click the rank badge to see the full State ranking.Click here to see the full State ranking.
Net patient income Info Net patient income: net patient revenue minus the home's total operating expenses. A positive figure means it earns more from resident care than it spends to deliver it; a negative figure means the opposite. It excludes non-operating "other income."
-$4.4M
Other income Info Money the home earns outside of resident care — such as investments, grants, rentals and other non-operating sources (CMS cost report, Worksheet G-3). It is tracked separately from net patient revenue: it is not part of that figure, and it is not included in net patient income.
$3.4M
Payroll costs Info Staff salaries plus wage-related costs — benefits such as payroll taxes, health insurance and retirement — from the home's own accounting records (CMS cost report, Worksheet A). Contract or agency labor is counted separately, under other operating costs. Rank #6 / 210Payroll — State benchmarkedThis home is ranked 6th out of 210 homes in Ohio. Shows total annual staff payroll benchmarked to the Ohio average. Higher payroll investment relative to peers often signals better staffing and less reliance on cheaper contract labor.Rankings are based only on facilities in Ohio that report data for that category. Facilities without available data are excluded from the ranking.Click the rank badge to see the full State ranking.Click here to see the full State ranking.
$6.0M 75% of net patient revenue Info Payroll as a share of revenue: staff salaries and wage-related benefits divided by net patient revenue. A higher figure means more of each revenue dollar goes to staff pay. Rank #118 / 210Payroll % — State benchmarkedThis home is ranked 118th out of 210 homes in Ohio. Shows payroll as a percentage of revenue versus the Ohio average. Well-run Ohio facilities typically land around 54–64% — the top third Statewide. Below 25% may signal understaffing or heavy agency use — read with Staffing ratings.Rankings are based only on facilities in Ohio that report data for that category. Facilities without available data are excluded from the ranking.Click the rank badge to see the full State ranking.Click here to see the full State ranking.
Other operating costs Info Everything it costs to run the home apart from payroll — food, utilities, supplies, maintenance, contract labor and administration. Calculated as total operating expense minus payroll (staff salaries and wage-related benefits).
$6.4M
Total costs Info The home's total operating expense for the year — all the costs of running it, salaries included (CMS cost report, Worksheet G-3).
$12.4M

What does this home offer?

Housing options icon

Housing Options: Private Rooms / Shared Rooms

Building type icon
Building type icon

Building Type: 3-story

Transportation services icon

Transportation Services

Who this home usually serves

TYPE OF STAY

Primarily short stays

Residents typically stay for brief periods, with frequent admissions and discharges throughout the year.

Most new residents arrive under private pay (79% of admissions), and a typical private pay stay runs around 2 - 3 months.

Admissions
490 total

Coverage residents most often arrive under.

Medicare 16%
Private pay 79%
Medicaid 5%
Discharges
467 total

Coverage residents most often leave under.

Medicare 16%
Private pay 78%
Medicaid 6%

Places of interest near Willensky Residence

Address 2.6 miles from city center Info Estimated distance in miles from Beachwood's city center to Willensky Residence's address, calculated via Google Maps.

Calculate Travel Distance to Willensky Residence

Add your location

Address

Frequently Asked Questions about Willensky Residence

Is Willensky Residence in a walkable area?

Willensky Residence has a walk score of 54. Moderately walkable. Some errands can be accomplished on foot, with a mix of nearby amenities.

What is the occupancy rate at Willensky Residence?

Willensky Residence's occupancy is 65.3%.

Does Willensky Residence operate as a for-profit or non-profit?

Willensky Residence is registered as a for-profit.

Are there photos of Willensky Residence?

Yes — there are 3 photos of Willensky Residence in the photo gallery on this page.

What is the address of Willensky Residence?

Willensky Residence is located at One David Myers Pkwy, Beachwood, OH 44122.

What is the phone number of Willensky Residence?

(216) 910-2323 will put you in contact with the team at Willensky Residence.

Is Willensky Residence Medicare or Medicaid certified?

Yes — Willensky Residence is a CMS-certified provider of Medicare and Medicaid.

Guides for Better Senior Living

Care Cost Calculator: See Prices in Your Area

Nursing Home Data Explorer

Don’t Wait Too Long: 7 Red Flag Signs Your Parent Needs Assisted Living Now

The True Cost of Assisted Living in 2025 – And How Families Are Paying For It

Understanding Senior Living Costs: Pricing Models, Discounts & Financial Assistance