Bradford House Nursing and Rehabilitation
Nursing Home & Respite Care · Farmington, AR
CMS overall rating Info CMS (the Centers for Medicare & Medicaid Services) is the federal agency that rates nursing home quality. Its Overall Rating runs from 1 to 5 stars, combining health inspections, staffing, and quality measures, with inspections weighted most heavily.

Bradford House Nursing and Rehabilitation

Nursing Home & Respite Care · Farmington, AR
CMS overall rating Info CMS (the Centers for Medicare & Medicaid Services) is the federal agency that rates nursing home quality. Its Overall Rating runs from 1 to 5 stars, combining health inspections, staffing, and quality measures, with inspections weighted most heavily.
Calculator: See prices in your area
Bradford House Nursing and Rehabilitation accepts Medicare, Medicaid, and private pay.

Overview of Bradford House Nursing and Rehabilitation

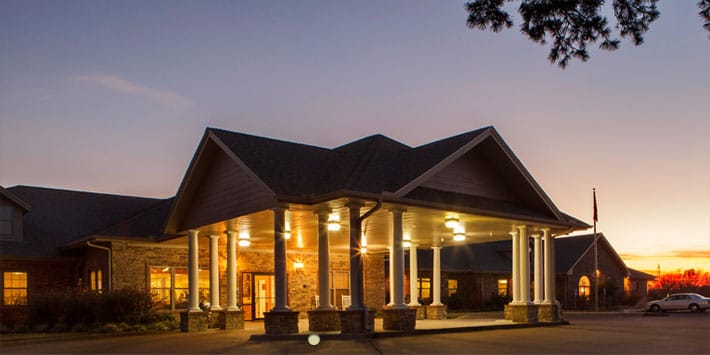
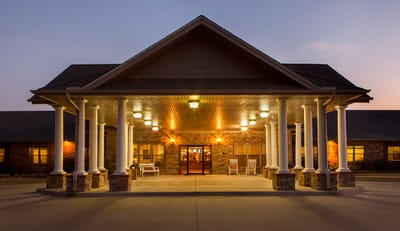
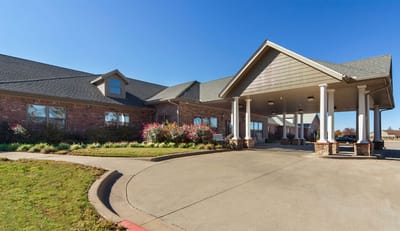
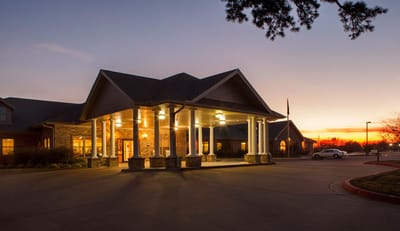
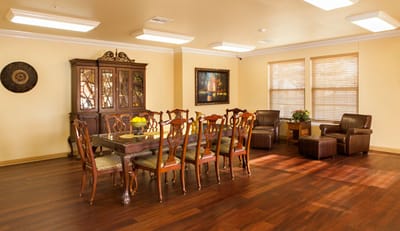
In Bentonville, Arkansas, Bradford House is a haven for skilled professional care. Wrapped in a compassionate and supportive atmosphere, their specialization spans Short-Term Rehabilitation and Long-Term Care services. This supportive community strives to create an environment where seniors receive the highest standard of care and respect.

The dedicated team at Bradford House is comprised of licensed nurses, physicians, optometrists, dentists, and various specialists who understand the significance of forging strong relationships with residents and their families. This belief is deeply embedded in their approach to the healing process. The staff at Bradford House is unwavering in their devotion to delivering quality care that reveres the dignity and grace of every senior resident.

(479) 273-3430

Quality ratings

Measured by Centers for Medicare & Medicaid Services (CMS)

Overall rating Info The Overall CMS Rating combines results from health inspections, staffing levels and quality measures. Health inspections carry the most weight. Staffing and quality scores can increase or decrease the final rating based on performance compared to state and national standards.
▲ 27.5% Above AR avg. ▲ 27.5% Above AR avg.AR average: 3.1Click the badge to see the full State ranking.Click here to see the full State ranking.
Health Inspection Info Based on the results of the facility's three most recent standard inspections and any complaint investigations. CMS reviews the number, scope, and severity of deficiencies, with more recent findings weighted more heavily.
▲ 3.8% Above AR avg. ▲ 3.8% Above AR avg.AR average: 2.9Click the badge to see the full State ranking.Click here to see the full State ranking.
Staffing Info Measures average nursing staff hours per resident per day, including Registered Nurses (RNs) and total nursing staff. Ratings are adjusted based on the level of care residents require and are compared to state and national benchmarks.
▼ 5.8% Below AR avg. ▼ 5.8% Below AR avg.AR average: 3.2Click the badge to see the full State ranking.Click here to see the full State ranking.
Quality Measures Info Based on clinical and physical health indicators reported to CMS, such as hospital readmissions, falls, pressure ulcers, and improvements in mobility. These measures reflect how well residents' health needs are being managed.
▲ 36.6% Above AR avg. ▲ 36.6% Above AR avg.AR average: 3.7Click the badge to see the full State ranking.Click here to see the full State ranking.

Staffing hours breakdown

Info Daily nursing hours per resident by staff type, reported to CMS. Higher is generally better — compare this facility to state and national averages to see where staffing stands.

Hours per resident per day — compared to Arkansas state averages

Total nursing care / resident Info Total adjusted nursing hours per resident per day, combining RN, LPN, and aide time. CMS adjusts this for case-mix so facilities can be fairly compared.
4h 46m per day
This facility Arkansas avg (4h 40m per day)
vs Arkansas avg
+2%

3 of 6 metrics below state avg

Standout metric Physical Therapist is +32% above state avg
Staff typeHours / Day / Residentvs state avg
Registered Nurse (RN) Info RNs hold the highest nursing license and can assess residents, interpret test results, and direct care plans. More RN hours per day often signals stronger clinical oversight and faster response to health changes. 24m per day ■ Avg State avg: 24m per day · National avg: 41m per day
LPN / LVN Info Licensed Practical Nurses (LPNs) or Licensed Vocational Nurses (LVNs) deliver routine hands-on care — medication administration, wound dressing, and monitoring vital signs. They work under RN supervision and make up a large share of daily bedside care. 57m per day ■ Avg State avg: 57m per day · National avg: 52m per day
Nurse Aide Info Certified Nurse Aides (CNAs) provide the most direct day-to-day assistance: bathing, dressing, feeding, and mobility. Nurse aide hours are typically the largest staffing category and directly affect residents' quality of life. 2h 22m per day ▼ 14% State avg: 2h 44m per day · National avg: 2h 21m per day
Weekend Total Nursing Info Combined nursing hours (RN + LPN + Nurse Aide) per resident per day on weekends. Staffing often drops on weekends — this figure reveals whether the facility maintains adequate coverage outside of weekday hours. 3h 14m per day ▼ 7% State avg: 3h 29m per day · National avg: 3h 26m per day
Physical Therapist Info Hours per resident per day provided by licensed Physical Therapists (PTs) or PT Assistants. PT services help residents recover mobility after injury or illness and are especially important for post-acute (short-stay) rehabilitation. 3m per day ▲ 32% State avg: 2m per day · National avg: 4m per day
Weekend RN Info Registered nurse hours specifically on weekends. Facilities sometimes reduce RN presence on Saturdays and Sundays — a low weekend RN figure compared to weekday hours can indicate reduced clinical oversight when most administrative staff are absent. 13m per day ▼ 19% State avg: 16m per day · National avg: 29m per day

Capacity and availability

Avg. Length of Stay
170 days
Bed community size
85-bed community Rank #171 / 330Bed count — State benchmarkedThis home is ranked 171st out of 330 homes in Arkansas. Shows this facility's certified or reported bed count compared to other Arkansas facilities. Larger communities may offer more amenities, programs, and on-site services for residents and families.Rankings are based only on facilities in Arkansas that report data for that category. Facilities without available data are excluded from the ranking.Click the rank badge to see the full State ranking.Click here to see the full State ranking.
A larger shared setting that may offer more common spaces and organized community services.
Walk Score
Walk Score: 43 / 100 Rank #142 / 419Walk Score — State benchmarkedThis home is ranked 142nd out of 419 homes in Arkansas. Shows how walkable this facility's neighborhood is compared to the average Walk Score across Arkansas facilities. Higher scores benefit residents, families, and staff.Rankings are based only on facilities in Arkansas that report data for that category. Facilities without available data are excluded from the ranking.Click the rank badge to see the full State ranking.Click here to see the full State ranking.
Somewhat walkable. A few nearby services may be reachable on foot, but most trips require transportation.

About this community

Occupancy

Occupancy rate
83%
Higher than the Arkansas average: 71.3%
Occupied beds
70 / 85
Average occupied beds in Arkansas homes 77 beds

License Details

Facility TypeSkilled Nursing Facility With Dual Certified Beds (medicaid /medicare)
CountyBenton
Business TypeLimited Liability Company
Certification TypeMedicaid / Medicare

Ownership & Operating Entity

Bradford House Nursing and Rehabilitation is legally operated by Bradford House Nursing and Rehab, LLC, and administered by Devin Darnell.

Type Of Units

Medicaid and Medicare
85 units
Total beds
85 units

Safety & Compliance

Wheelchair Accessible
Safety Features24-hour Nursing Services by specialized staff.

Therapy & Rehabilitation

3 services
Rehabilitation Services
Respite Care
Short-Term Rehab

Staffing & Medical

1 service
24-Hour Staffing

Additional Services

1 service
Short-Term Rehabilitation

Contact Information

Fax479-273-3578

Amenities & Lifestyle

Free Wireless Internet
Flat Screen Tv’s
State Of The Art Rehabilitation Gym
Outside Covered Patio Area
Outside Garden
Physician Services 24/7
Private Dining Room For Family Events
Beauty Salon Services
Wonderful Activity Program
Daily Housekeeping And Laundry Services
ActivitiesYes

Dining & Nutrition

Food DescriptionMeals are provided in a beautiful dining area, encouraging family members to share meals when possible.

Contact Bradford House Nursing and Rehabilitation

Inspection History

In Arkansas, the Department of Human Services, Office of Long Term Care is authorized to conduct unannounced inspections and issue official quality of care reports for all senior living providers.

Since 2022 · 4 years of data 29 deficiencies

Inspection Scorecard Info This scorecard compares key inspection, citation, and complaint metrics at this facility against the Arkansas state average. Metrics rated ≥15% worse than average are highlighted in red; those ≥15% better are highlighted in green.

Since 2022 vs. Arkansas state average
Overall vs. AR average 2 Worse Metrics worse than Arkansas average:
• Total deficiencies (38% above)
• Deficiencies per year (38% above)
0 Better No metrics in this bucket.
Latest Inspection May 30, 2025 Annual Inspection

Deficiencies Info Deficiencies are formal regulatory issues recorded during state inspections.

This FacilityAR Averagevs. AR Avg
Total deficiencies Info Formal regulatory issues recorded by inspectors across all inspection types. 2921 This facility has 38% more total deficiencies than a typical Arkansas nursing home (29 vs. AR avg 21).↑ 38% worse
Deficiencies per year Info Average deficiencies per year since 2022. 7.35.3 This facility has 38% more deficiencies per year than a typical Arkansas nursing home (7.3 vs. AR avg 5.3).↑ 38% worse

Inspection Reports Summary Info An editor-reviewed summary of the themes and findings across this facility's recent inspection reports.

  • May 30, 2025 inspection found four deficiencies including unsafe medication self-administration, food safety violations, and unsecured archived medical records.
  • Substantiated complaints confirmed failure to follow two-person transfer protocols causing falls and injuries to two residents; two CNAs were terminated.
  • January 3, 2025 complaint investigation found improper use of psychotropic medication as chemical restraint and inaccurate restraint documentation for Resident #3.

Health Inspection History

Inspections since 2022
Total health inspections 4

Arkansas average 4.2


Last Health inspection on May 2025

Total health citations
15

Arkansas average 21.8

Citations per inspection
3.75

Arkansas average 5.32


Health citations are formal notices following inspections when they fail to comply with safety and care standards.

12 of 15 citations resulted from standard inspections; and 3 of 15 resulted from complaint investigations.

Breakdown of citation severity (last 4 years)
Critical health citations
0
100% better than Arkansas average

Arkansas average: 0.4


Serious health citations
0
100% better than Arkansas average

Arkansas average: 0.2

0 critical citations Arkansas average: 0.4

0 serious citations Arkansas average: 0.2

15 moderate citations Arkansas average: 20.9

0 minor citations Arkansas average: 0.4
Citations history (last 4 years)
Nutrition moderate citation May 30, 2025
Corrected

Quality of Care moderate citation May 30, 2025
Corrected

Care Planning moderate citation May 30, 2025
Corrected

Resident Rights moderate citation May 30, 2025
Corrected

Staffing Data

Reporting period: October 1 – December 31, 2025 (Q4 2025). Source: CMS Payroll-Based Journal report.

Total staff 139
Employees 108
Contractors 31
Staff to resident ratio 1.88 : 1
18% more staff per resident than Arkansas average
Arkansas average ratio: 1.59 : 1 Arkansas average ratio: 1.59 : 1See full Arkansas ranking
Avg staff/day 38
Average shift 8.4 hours
5% better than Arkansas average
Arkansas average: 8 hours Arkansas average shift: 8 hoursSee full Arkansas ranking
Total staff hours (quarter) 29,257

Nursing staff breakdown

Q4 2025 · Oct 1 – Dec 31 More info This data comes from the CMS Payroll-Based Journal report covering October 1 – December 31, 2025.
Registered Nurse

Manages medical care and health needs.

RN Staff Info All 6 RN Staff are full-time employees. No contractors work on this role. 6
Average shift length Info Average shift length. Calculated as total hours divided by days worked and average staff per day. 10.3 hours
Licensed Practical Nurse

Assists with medical care and medications.

LPN Staff Info All 14 LPN Staff are full-time employees. No contractors work on this role. 14
Average shift length Info Average shift length. Calculated as total hours divided by days worked and average staff per day. 10 hours
Certified Nursing Assistant

Helps with daily care and mobility.

CNA Staff Info All 65 CNA Staff are full-time employees. No contractors work on this role. 65
Average shift length Info Average shift length. Calculated as total hours divided by days worked and average staff per day. 8.5 hours

Contractor staffing

Q4 2025 · Oct 1 – Dec 31 More info This data comes from the CMS Payroll-Based Journal report covering October 1 – December 31, 2025.

Total hours from contractors

4.4%

1,276 contractor hours this quarter

Qualified Social Worker: 6 Physical Therapy Aide: 6 Physical Therapy Assistant: 6 Speech Language Pathologist: 5 Respiratory Therapy Technician: 4 Occupational Therapy Aide: 1 Clinical Nurse Specialist: 1 Occupational Therapy Assistant: 1 Medical Director: 1

Staff by category

Q4 2025 · Oct 1 – Dec 31 More info This data comes from the CMS Payroll-Based Journal report covering October 1 – December 31, 2025.
Certified Nursing Assistant6506515,18192100%8.5
Licensed Practical Nurse140145,60892100%10
Clinical Nurse Specialist3141,3128997%8.1
Medication Aide/Technician5051,0836773%8.9
RN Director of Nursing6061,0177278%8.4
Registered Nurse6069576267%10.3
Administrator1015286672%8
Other Dietary Services Staff1015056874%7.4
Dental Services Staff1015046065%8.4
Occupational Therapy Aide1124946368%7.6
Nurse Practitioner1014886166%8
Dietitian1014775762%8.4
Respiratory Therapy Technician0443066470%4.5
Physical Therapy Aide0663006571%4.5
Nurse Aide in Training3032042325%8.9
Qualified Social Worker0661055257%1.9
Speech Language Pathologist055942527%3.5
Physical Therapy Assistant066472932%1.6
Occupational Therapy Assistant0113855%7.5
Medical Director0111233%4
65 Certified Nursing Assistant
% of Days 100%
14 Licensed Practical Nurse
% of Days 100%
4 Clinical Nurse Specialist
% of Days 97%
5 Medication Aide/Technician
% of Days 73%
6 RN Director of Nursing
% of Days 78%
6 Registered Nurse
% of Days 67%
1 Administrator
% of Days 72%
1 Other Dietary Services Staff
% of Days 74%
1 Dental Services Staff
% of Days 65%
2 Occupational Therapy Aide
% of Days 68%
1 Nurse Practitioner
% of Days 66%
1 Dietitian
% of Days 62%
4 Respiratory Therapy Technician
% of Days 70%
6 Physical Therapy Aide
% of Days 71%
3 Nurse Aide in Training
% of Days 25%
6 Qualified Social Worker
% of Days 57%
5 Speech Language Pathologist
% of Days 27%
6 Physical Therapy Assistant
% of Days 32%
1 Occupational Therapy Assistant
% of Days 5%
1 Medical Director
% of Days 3%

Penalties and fines

Federal penalties imposed by CMS for regulatory violations, including civil money penalties (fines) and denials of payment for new Medicare/Medicaid admissions.

Source: CMS Penalties Database

No penalties in the past 3 years

No civil money penalties or payment denials were reported in the last 3 years.

Quality of care over time

These measures show how residents usually do over time at this home, based on health outcomes and preventive care.

High-risk clinical events score Info A composite score based on pressure ulcers, falls with injury, weight loss, walking ability decline, and activities of daily living decline. 15.7
104% worse than Arkansas average

Arkansas average: 7.7

Functional decline score Info A composite score based on activities of daily living decline, walking ability decline, and incontinence. 26.0
95% worse than Arkansas average

Arkansas average: 13.3

Long-stay resident measures
Above average Arkansas avg: 4.2 Info CMS star rating based on long-stay quality measure performance. 5 stars = significantly above average, 1 star = significantly below average.
Need for Help with Daily Activities Increased Info Percent of long-stay residents whose need for help with daily activities has increased 24.3%
111% worse than Arkansas average

Arkansas average: 11.5%

Walking Ability Worsened Info Percent of long-stay residents whose ability to move independently worsened 31.3%
135% worse than Arkansas average

Arkansas average: 13.4%

Low Risk Residents with Bowel/Bladder Incontinence Info Percent of low risk long-stay residents who lose control of their bowels or bladder 22.4%
48% worse than Arkansas average

Arkansas average: 15.1%

Falls with Major Injury Info Percent of long-stay residents experiencing one or more falls with major injury 4.1%
In line with Arkansas average

Arkansas average: 3.9%

High Risk Residents with Pressure Ulcers Info Percent of long-stay high risk residents with pressure ulcers 4.0%
16% better than Arkansas average

Arkansas average: 4.7%

Urinary Tract Infection Info Percent of long-stay residents with a urinary tract infection 3.4%
161% worse than Arkansas average

Arkansas average: 1.3%

Lost Too Much Weight Info Percent of long-stay residents who lose too much weight 14.7%
194% worse than Arkansas average

Arkansas average: 5.0%

Depressive Symptoms Info Percent of long-stay residents who have depressive symptoms 0.4%
73% better than Arkansas average

Arkansas average: 1.5%

Antipsychotic Use Info Percent of long-stay residents who received an antipsychotic medication 7.0%
34% better than Arkansas average

Arkansas average: 10.5%

Pneumococcal Vaccine Info Percent of long-stay residents assessed and appropriately given the pneumococcal vaccine 96.3%
In line with Arkansas average

Arkansas average: 94.4%

Influenza Vaccine Info Percent of long-stay residents assessed and appropriately given the seasonal influenza vaccine 94.8%
In line with Arkansas average

Arkansas average: 96.2%

Hospitalizations per 1,000 days Info Number of hospitalizations per 1,000 long-stay resident days. 0.82
58% better than Arkansas average

Arkansas average: 1.97

ED visits per 1,000 days Info Number of outpatient emergency department visits per 1,000 long-stay resident days. 0.76
65% better than Arkansas average

Arkansas average: 2.18

Short-stay resident measures
Above average Arkansas avg: 2.7 Info CMS star rating based on short-stay quality measure performance. 5 stars = much above average, 1 star = much below average.
Pneumococcal Vaccine Info Percent of short-stay residents assessed and appropriately given the pneumococcal vaccine 86.8%
7% better than Arkansas average

Arkansas average: 80.9%

Antipsychotic medication increase Info Percent of short-stay residents who newly received an antipsychotic medication 1.2%
19% better than Arkansas average

Arkansas average: 1.5%

Influenza Vaccine Info Percent of short-stay residents assessed and appropriately given the seasonal influenza vaccine 73.0%
6% worse than Arkansas average

Arkansas average: 77.7%

Re-hospitalized after SNF stay Info Percentage of short-stay residents who were re-hospitalized after their nursing home admission. 9.5%
62% better than Arkansas average

Arkansas average: 25.2%

Emergency department visits Info Percentage of short-stay residents who had an outpatient emergency department visit. 17.0%
23% worse than Arkansas average

Arkansas average: 13.8%

Falls with major injury Info Percentage of SNF residents who experience falls with major injury during their stay. 0.0%
100% better than Arkansas average

Arkansas average: 0.8%

Ability to care for self at discharge Info Percentage of residents at or above expected ability to care for themselves at discharge. 72.7%
35% better than Arkansas average

Arkansas average: 53.7%

Successful return to home or community Info Rate of successful return to home or community from a skilled nursing facility. 54.3%
7% better than Arkansas average

Arkansas average: 50.6%

Breakdown by payment type

Medicare

18% of new residents, usually for short-term rehab.

Typical stay 22 days

Private pay

66% of new residents, often for short stays.

Typical stay 1 - 2 months

Medicaid

16% of new residents, often for long-term daily care.

Typical stay 2 years

Facility Characteristics

Source: CMS Long-Term Care Facility Characteristics (Data as of Jan 2026)

Total residents 74
Medicare
6
8.1% of residents
Medicaid
42
56.8% of residents
Private pay or other
26
35.1% of residents
Programs & Services
Residents Group

Residents meet regularly to discuss policies, care quality, and activities

Active Resident Council

Organized group of residents that meets regularly to discuss facility policies, quality of life, and activities.

Finances and operations

Based on CMS SNF Cost Report for fiscal year ending in 12/2023.

Privately-owned community
Operated by a single business entity.
Net patient revenue Info Net patient revenue — what the home actually collects for resident care, after contractual allowances, bad debt and discounts are subtracted from its gross charges (CMS cost report, Worksheet G-3). It covers resident care only; money the home earns from other sources is shown separately as "Other income."
$9.2M
Net patient income Info Net patient income: net patient revenue minus the home's total operating expenses. A positive figure means it earns more from resident care than it spends to deliver it; a negative figure means the opposite. It excludes non-operating "other income."
$527.5K
Privately-owned community Operated by a single business entity.
Net patient revenue Info Net patient revenue — what the home actually collects for resident care, after contractual allowances, bad debt and discounts are subtracted from its gross charges (CMS cost report, Worksheet G-3). It covers resident care only; money the home earns from other sources is shown separately as "Other income."
$9.2M
Net patient income Info Net patient income: net patient revenue minus the home's total operating expenses. A positive figure means it earns more from resident care than it spends to deliver it; a negative figure means the opposite. It excludes non-operating "other income."
$527.5K
Other income Info Money the home earns outside of resident care — such as investments, grants, rentals and other non-operating sources (CMS cost report, Worksheet G-3). It is tracked separately from net patient revenue: it is not part of that figure, and it is not included in net patient income.
$1.4K
Payroll costs Info Staff salaries plus wage-related costs — benefits such as payroll taxes, health insurance and retirement — from the home's own accounting records (CMS cost report, Worksheet A). Contract or agency labor is counted separately, under other operating costs.
$4.2M 45.3% of net patient revenue Info Payroll as a share of revenue: staff salaries and wage-related benefits divided by net patient revenue. A higher figure means more of each revenue dollar goes to staff pay.
Other operating costs Info Everything it costs to run the home apart from payroll — food, utilities, supplies, maintenance, contract labor and administration. Calculated as total operating expense minus payroll (staff salaries and wage-related benefits).
$4.5M
Total costs Info The home's total operating expense for the year — all the costs of running it, salaries included (CMS cost report, Worksheet G-3).
$8.7M

Who this home usually serves

TYPE OF STAY

Primarily short stays

Residents typically stay for brief periods, with frequent admissions and discharges throughout the year.

Most new residents arrive under private pay (66% of admissions), and a typical private pay stay runs around 1 - 2 months.

Admissions
173 total

Coverage residents most often arrive under.

Medicare 18%
Private pay 66%
Medicaid 16%
Discharges
163 total

Coverage residents most often leave under.

Medicare 15%
Private pay 64%
Medicaid 21%

Places of interest near Bradford House Nursing and Rehabilitation

Address 26.9 miles from city center Info Estimated distance in miles from Bentonville's city center to Bradford House Nursing and Rehabilitation's address, calculated via Google Maps.

Calculate Travel Distance to Bradford House Nursing and Rehabilitation

Add your location

Address

Compare Nursing Homes around Farmington

The information below is reported by the Arkansas Department of Human Services, Office of Long Term Care.

2 facilities compared · CMS & AR Dept. of Health data

Bradford House Nursing and Rehabilitation
NH
RC
Bentonville
85
Facility 85
AR AVG 84
Rank #171 / 330
82.9% +16%4.76 -21%+2%$0153.8-76-
43
Facility 43
AR AVG 34
Rank #142 / 419
Quincy Dye$9.2M$4.2M45.3%45373
Apple Creek Health and Rehabilitation
NH
Centerton
114
Facility 114
AR AVG 84
Rank #86 / 330
64.9% -9%5.18 -74%+11%$8.4k112.8174-
14
Facility 14
AR AVG 34
Rank #321 / 419
Diane Gregg$12.2M$5.3M43.5%45465

Financial Assistance for
Nursing Home in Arkansas

Bradford House Nursing and Rehabilitation is located in Bentonville, Arkansas.
Here are the financial assistance programs available to residents in Arkansas.

Get Financial aid guidance

ARChoices

Arkansas Medicaid ARChoices

Age 65+ or 21+ with disability
General Arkansas resident, Medicaid- eligible, nursing home-level care need.
Income Limits (2025) ~$2,829/month 300% FBR, individual
Asset Limits $2,000 (individual), $3,000 (couple).
AR

Rural focus; possible waitlists.

Benefits
Personal care (5-7 hours/day) Meals ($7/meal) Respite care (240 hours/year) Adult day services ($60/day)

Choices in Living Resource Center

Arkansas Choices in Living

Age 60+
General Arkansas resident.
Income Limits No strict limit; prioritizes low-income.
Asset Limits Not applicable.
AR

Limited direct funding; mostly referral-based.

Benefits
Care coordination Limited respite (up to 5 days/year) Transportation assistance (~5 trips/month)

Living Choices Assisted Living Waiver

Arkansas Medicaid Living Choices Assisted Living Waiver

Age 65+
General Arkansas resident, requires nursing home-level care, lives in a Level II assisted living facility.
Income Limits (2025) ~$2,829/month 300% FBR, individual
Asset Limits $2,000 (individual), $3,000 (couple); spousal rules apply.
AR

Limited provider network; excludes Level I facilities (no nursing services).

Benefits
Personal care (~5 hours/day) Medication management Nursing Activities Transportation

Program of All-Inclusive Care for the Elderly (PACE)

Arkansas Medicaid PACE

Age 55+
General Arkansas resident, nursing home-level care, safe with PACE support.
Income Limits (2025) ~$2,829/month 300% FBR
Asset Limits $2,000 (individual), $3,000 (couple).
AR

Limited geographic availability.

Benefits
Primary/preventive care Personal care (5-7 hours/day) Meals Transportation Therapy

Arkansas State Plan Personal Care

Arkansas Medicaid Personal Care Program

Age
General Any age, Arkansas resident, needs ADL/IADL help, Medicaid-eligible.
Income Limits (2025) ~$1,004/month individual
Asset Limits $9,660 (individual), $14,470 (couple).
AR

No nursing home-level care requirement.

Benefits
Personal care (~4-6 hours/day) Homemaker services (e.g., meal prep)

Frequently Asked Questions about Bradford House Nursing and Rehabilitation

Who is the owner of Bradford House Nursing and Rehabilitation?

The legal owner and operator of Bradford House Nursing and Rehabilitation is Bradford House Nursing and Rehab, LLC.

Is Bradford House Nursing and Rehabilitation in a walkable area?

Bradford House Nursing and Rehabilitation has a walk score of 43. Somewhat walkable. A few nearby services may be reachable on foot, but most trips require transportation.

What is the occupancy rate at Bradford House Nursing and Rehabilitation?

Bradford House Nursing and Rehabilitation's occupancy is 83%.

Who is the administrator of Bradford House Nursing and Rehabilitation?

Devin Darnell is the administrator of Bradford House Nursing and Rehabilitation.

How many beds does Bradford House Nursing and Rehabilitation have?

Bradford House Nursing and Rehabilitation has 85 beds.

Are there photos of Bradford House Nursing and Rehabilitation?

Yes — there are 22 photos of Bradford House Nursing and Rehabilitation in the photo gallery on this page.

What is the address of Bradford House Nursing and Rehabilitation?

Bradford House Nursing and Rehabilitation is located at 1202 Se 30Th St, Bentonville, AR 72712.

Guides for Better Senior Living

Care Cost Calculator: See Prices in Your Area

Nursing Home Data Explorer

Don’t Wait Too Long: 7 Red Flag Signs Your Parent Needs Assisted Living Now

The True Cost of Assisted Living in 2025 – And How Families Are Paying For It

Understanding Senior Living Costs: Pricing Models, Discounts & Financial Assistance