


The Flats by Clark Lindsey (Expansion)
Nursing Home, Assisted Living, Independent Living & Memory Care · Illinois, IL


The Flats by Clark Lindsey (Expansion)
Nursing Home, Assisted Living, Independent Living & Memory Care · Illinois, IL
Overview of The Flats by Clark Lindsey (expansion)
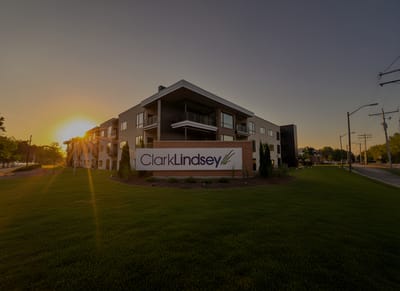
ClarkLindsey, East Central Illinois’ first and only nonprofit Life Plan Community, offers a retirement living experience on a stunning 27-acre campus bordering Urbana’s Meadowbrook Park and the University of Illinois at Champaign. The community’s extensive services and amenities make retirement living easy and carefree, allowing residents to spend their time doing the things they want to do, not the things they have to do. ClarkLindsey strives to foster a culture of excellence centered around well-being and encompassing its four core values: meaningful life, engaged staff, inclusive community, and excellence.
As a Life Plan Community, ClarkLindsey provides multiple levels of care on its campus, ensuring that residents have a place to live for the rest of their lives, even as their health needs change over time. The community offers assisted living, memory care, skilled nursing, and rehabilitation services, with the new MeadowLark expansion set to include catered assisted living and memory care assisted living apartments. Residents have access to many amenities, services, and activities on the ClarkLindsey campus, including social gatherings, fitness activities, award-winning gardens, and picturesque views of the prairie. The community is excited to expand the possibilities with a new building project, including a modern three-story apartment building with catered assisted living and memory care assisted living apartments, and another three-story apartment building with independent living apartments.
64-bed community Rank #237 / 426Bed count — State benchmarkedThis home is ranked 237th out of 426 homes in Illinois for bed count. Shows this facility's certified or reported bed count compared to other Illinois SNFs. Larger communities may offer more amenities, programs, and on-site services for residents and families.Click the rank badge to see the full State ranking.Click here to see the full State ranking.
A moderately sized community that may balance personal attention with shared amenities and social activities.
Walk Score: 10 / 100 Rank #595 / 648Walk Score — State benchmarkedThis home is ranked 595th out of 648 homes in Illinois for walk score. Shows how walkable this facility's neighborhood is compared to the average Walk Score across Illinois SNFs. Higher scores benefit residents, families, and staff.Click the rank badge to see the full State ranking.Click here to see the full State ranking.
Car-dependent. Most errands require a car, with limited nearby walkable options.
About this community
Facility TypeAssisted Living/shared Housing Establishment
StatusActive
IssuanceFebruary 26, 2026
ExpirationFebruary 25, 2027
CountyChampaign
License Number5108441
The Flats by Clark Lindsey (Expansion) is legally operated by Clark-lindsey Village, Inc..
Permanent Units
38 units
Alzheimer's Units
26 units
Total beds
64 units
Secured Perimeter
Emergency SystemsYes
Rehabilitation Services
Respite Care
24-Hour Staffing
Offers Alzheimer's Care
Home Care
Pets Allowed
Minimum Age62+
HousekeepingYes
Linen ServiceYes
Utilities IncludedYes
Gym
Library
Computer Lab
Salon
Spa
Dining Room
Restaurant
Bistro
Courtyard
Garden
Patio
Walking Paths
Putting Green
Billiards
Art Studio
Transportation
24-Hour Security
Housekeeping
Laundry
Private Dining
Guest Suites
Fire Pit
Wellness Center
Wellness ProgramWellness programs challenge residents to grow stronger.
Specific ProgramsAbout, Volunteer, Community Portal
Volunteer ProgramsYes
Food DescriptionClarkLindsey offers chef-prepared meals and flexible dining options, including formal dining and casual bistro meals.
Inspection History
In Illinois, the Department of Public Health, Office of Health Care Regulation conducts annual unannounced surveys to assess compliance with state and federal healthcare facility standards.
Since 2025 · 1 year of data
9 deficiencies
6 inspections
Inspection Scorecard
 This scorecard compares key inspection, citation, and complaint metrics at this facility against the Illinois state average. Metrics rated ≥15% worse than average are highlighted in red; those ≥15% better are highlighted in green.
Since 2025 vs. Illinois state average
Overall vs. IL average
3 Worse
Metrics worse than Illinois average:
• Total deficiencies (29% above)
• Deficiencies per year (29% above)
• Deficiencies per inspection (67% above) 1 Better Metrics better than Illinois average:
• Total inspections (25% below)
• Total deficiencies (29% above)
• Deficiencies per year (29% above)
• Deficiencies per inspection (67% above) 1 Better Metrics better than Illinois average:
• Total inspections (25% below)
Latest Inspection
January 29, 2026
Deficiencies
| This Facility | IL Average | vs. IL Avg |
|---|---|---|---|
|
Total deficiencies
| 9 | 7 | This facility has 29% more total deficiencies than a typical Illinois nursing home (9 vs. IL avg 7).↑ 29% worse |
|
Deficiencies per year
| 9 | 7 | This facility has 29% more deficiencies per year than a typical Illinois nursing home (9 vs. IL avg 7).↑ 29% worse |
|
Deficiencies per inspection
| 1.5 | 0.9 | This facility has 67% more deficiencies per inspection than a typical Illinois nursing home (1.5 vs. IL avg 0.9).↑ 67% worse |
Inspections
| This Facility | IL Average | vs. IL Avg |
|---|---|---|---|
|
Total inspections
| 6 | 8 | This facility has 25% fewer total inspections than a typical Illinois nursing home (6 vs. IL avg 8).↓ 25% better |
Inspection Reports Summary
An editor-reviewed summary of the themes and findings across this facility's recent inspection reports.
- October 21, 2025 inspection found the facility in compliance with assisted living regulations, with only one technical infraction for unsigned physician assessments and no violations imposed.
- September 15, 2025 complaint investigation substantiated failure to document fall risks and prevention plans for three residents, including one fatal fall resulting in severe harm and death.
- March 11, 2025 annual inspection cited six deficiencies, including missed fire and tornado drills, incomplete background checks, unsigned service plans, unreported injury, and missed tuberculosis testing.
What does this home offer?
Room Sizes: 827 / 993 - 1332 sq. ft.
Housing Options: 1 Bed / 2 Bed
Building Type: 3-story
Fitness and Recreation
Living Spaces & Floor Plans for The Flats by Clark Lindsey (Expansion)
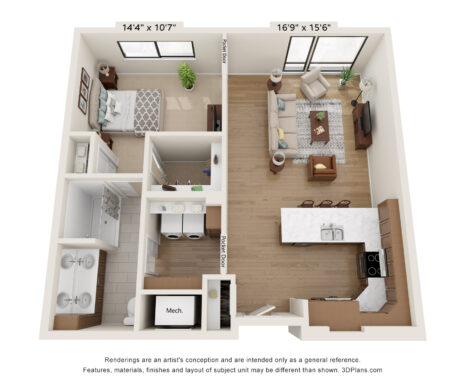
Clark Lindsey P1
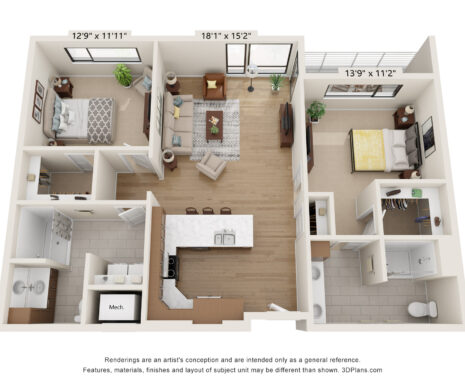
Clark Lindsey P3
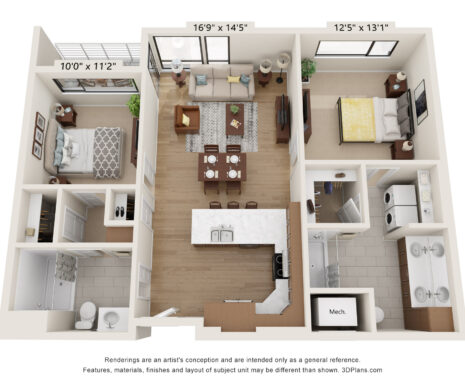
Clark Lindsey P2
Places of interest near The Flats by Clark Lindsey (Expansion)
![]() 2.2 miles from city center
2.2 miles from city center
![]() Estimated distance in miles from Urbana's city center to The Flats by Clark Lindsey (Expansion)'s address, calculated via Google Maps.
— 1.62 miles to nearest hospital (McKinley Health Center)
Estimated distance in miles from Urbana's city center to The Flats by Clark Lindsey (Expansion)'s address, calculated via Google Maps.
— 1.62 miles to nearest hospital (McKinley Health Center)
Calculate Travel Distance to The Flats by Clark Lindsey (Expansion)
Add your location
Financial Assistance for
Nursing Home in Illinois
The Flats by Clark Lindsey (Expansion) is located in Urbana, Illinois.
Here are the financial assistance programs available to residents in Illinois.
Frequently Asked Questions about The Flats by Clark Lindsey (Expansion)
What neighborhood is The Flats by Clark Lindsey (Expansion) in?
The Flats by Clark Lindsey (Expansion) is in the West Windsor Road neighborhood of Urbana.
Who is the owner of The Flats by Clark Lindsey (Expansion)?
The legal owner and operator of The Flats by Clark Lindsey (Expansion) is Clark-Lindsey Village, Inc..
Is The Flats by Clark Lindsey (Expansion) in a walkable area?
The Flats by Clark Lindsey (Expansion) has a walk score of 10. Car-dependent. Most errands require a car, with limited nearby walkable options.
What is the license number of The Flats by Clark Lindsey (Expansion)?
According to IL state health department records, The Flats by Clark Lindsey (Expansion)'s license number is 5108441.
When does The Flats by Clark Lindsey (Expansion)'s license expire?
According to IL state health department records, The Flats by Clark Lindsey (Expansion)'s license expires on February 25, 2027.
How many beds does The Flats by Clark Lindsey (Expansion) have?
The Flats by Clark Lindsey (Expansion) has 64 beds.
Are there photos of The Flats by Clark Lindsey (Expansion)?
Yes — there are 7 photos of The Flats by Clark Lindsey (Expansion) in the photo gallery on this page.
Guides for Better Senior Living
Care Cost Calculator: See Prices in Your Area
Nursing Home Data Explorer
Don’t Wait Too Long: 7 Red Flag Signs Your Parent Needs Assisted Living Now
The True Cost of Assisted Living in 2025 – And How Families Are Paying For It
Understanding Senior Living Costs: Pricing Models, Discounts & Financial Assistance
Contact Us

Published on
Updated on
Feedback
Write a review for The Flats by Clark Lindsey (Expansion)
Rate your overall experience with this community
Explore Open Rooms
1
Contact details
2
What type of senior care service are you looking for?
3
What budget do you have in mind for senior care?
4
How soon do you need to find care?
5
Additional details
Thank you for your interest!
Our team will be in touch shortly to help with next steps.
Need Help?
Let us help you or a loved one find the perfect senior home.
