Othello Care
Nursing Home · Othello, WA
CMS overall rating Info The Overall CMS Rating is scored from 1 to 5 stars and combines results from health inspections, staffing levels, and quality measures. Health inspections carry the most weight. Staffing and quality scores can increase or decrease the final rating based on performance compared to state and national standards.

Othello Care

Nursing Home · Othello, WA
CMS overall rating Info The Overall CMS Rating is scored from 1 to 5 stars and combines results from health inspections, staffing levels, and quality measures. Health inspections carry the most weight. Staffing and quality scores can increase or decrease the final rating based on performance compared to state and national standards.
Calculator: See prices in your area
Othello Care accepts Medicare, Medicaid, and private pay.

Overview of Othello Care

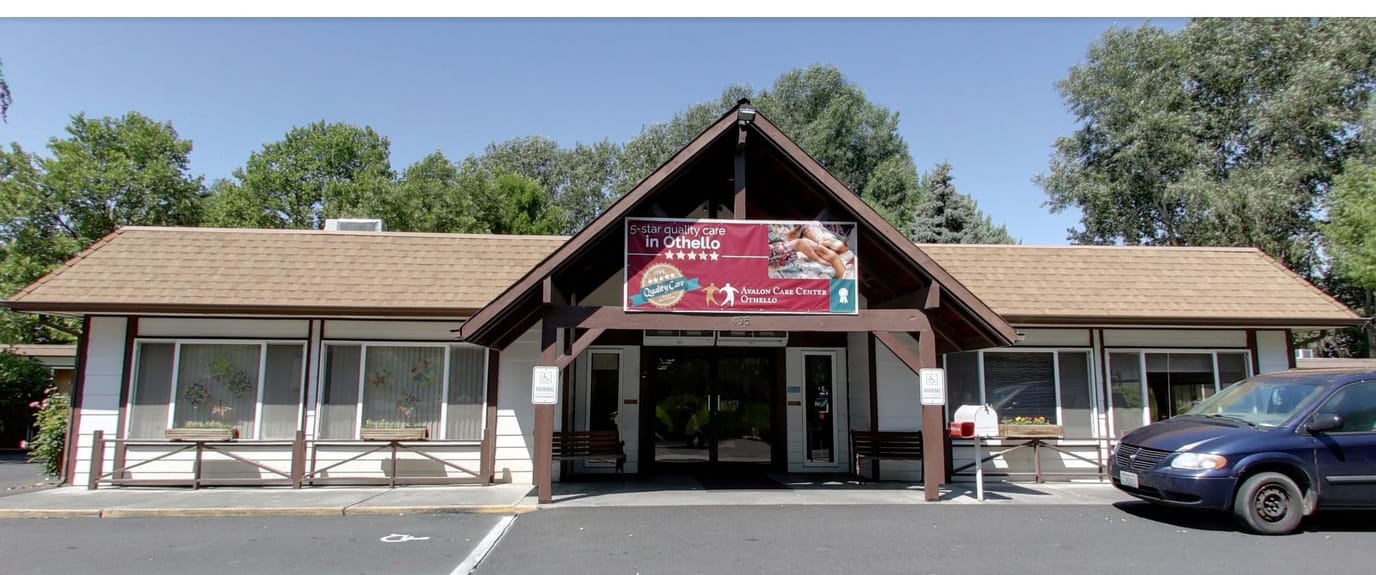
Othello Care has been caring for families in Othello since 1973, exceeding expectations through professional care, innovation, and a positive attitude. The care home’s passionate team consists of experts in long-term care and short-term rehabilitation, compassionately caring for residents and providing a full range of services to help them heal, regain strength, and live as independently as possible.

Othello Care’s staff, from the leadership team to the direct care staff, work to exceed expectations and provide round-the-clock care to meet every resident’s needs, including assistance with personal care, concierge services, and companionship. Othello Care makes residents feel at home by meeting their cultural and language needs, giving them a sense of ease and belonging. The care home’s Hispanic Cultural Program provides residents with authentic Hispanic meals, bilingual custom activities, and Spanish-speaking staff assistance. This program ensures that Hispanic residents can maintain their cultural identity and feel comfortable in their new home at Othello Care.

(509) 488-9609

Quality ratings

Measured by Centers for Medicare & Medicaid Services (CMS)

Overall rating Info The Overall CMS Rating combines results from health inspections, staffing levels and quality measures. Health inspections carry the most weight. Staffing and quality scores can increase or decrease the final rating based on performance compared to state and national standards.
▼ 7.0% Below WA avg. ▼ 7.0% Below WA avg.Click the badge to see the full State ranking.Click here to see the full State ranking.
Health Inspection Info Based on the results of the facility's three most recent standard inspections and any complaint investigations. CMS reviews the number, scope, and severity of deficiencies, with more recent findings weighted more heavily.
▲ 6.5% Above WA avg. ▲ 6.5% Above WA avg.Click the badge to see the full State ranking.Click here to see the full State ranking.
Staffing Info Measures average nursing staff hours per resident per day, including Registered Nurses (RNs) and total nursing staff. Ratings are adjusted based on the level of care residents require and are compared to state and national benchmarks.
▼ 12.4% Below WA avg. ▼ 12.4% Below WA avg.Click the badge to see the full State ranking.Click here to see the full State ranking.
Quality Measures Info Based on clinical and physical health indicators reported to CMS, such as hospital readmissions, falls, pressure ulcers, and improvements in mobility. These measures reflect how well residents' health needs are being managed.
▲ 1.7% Above WA avg. ▲ 1.7% Above WA avg.Click the badge to see the full State ranking.Click here to see the full State ranking.

Staffing hours breakdown

Info Daily nursing hours per resident by staff type, reported to CMS. Higher is generally better — compare this facility to state and national averages to see where staffing stands.

Hours per resident per day — compared to Washington state averages

Total nursing care / resident Info This home is ranked 61st out of 89 homes in Washington. Total adjusted nursing hours per resident per day, combining RN, LPN, and aide time. CMS adjusts this for case-mix so facilities can be fairly compared.
3h 50m per day
Rank #61 / 89Nurse hours — State benchmarkedThis home is ranked 61st out of 89 homes in Washington. Shows adjusted nurse hours per resident per day benchmarked to the Washington average, with a ranking across 89 Washington SNFs. More hours mean more direct care. The national average is about 3.5 hrs; below 3.0 is a red flag.Click the rank badge to see the full State ranking.Click here to see the full State ranking.
This facility Washington avg (4h 13m per day)
vs Washington avg
-9%

2 of 6 metrics below state avg

Standout metric Weekend RN is +13% above state avg
Staff typeHours / Day / Residentvs state avg
Registered Nurse (RN) Info RNs hold the highest nursing license and can assess residents, interpret test results, and direct care plans. More RN hours per day often signals stronger clinical oversight and faster response to health changes. 56m per day ▲ 6% State avg: 53m per day · National avg: 41m per day
LPN / LVN Info Licensed Practical Nurses (LPNs) or Licensed Vocational Nurses (LVNs) deliver routine hands-on care — medication administration, wound dressing, and monitoring vital signs. They work under RN supervision and make up a large share of daily bedside care. 14m per day ▼ 71% State avg: 49m per day · National avg: 52m per day
Nurse Aide Info Certified Nurse Aides (CNAs) provide the most direct day-to-day assistance: bathing, dressing, feeding, and mobility. Nurse aide hours are typically the largest staffing category and directly affect residents' quality of life. 2h 41m per day ■ Avg State avg: 2h 41m per day · National avg: 2h 21m per day
Weekend Total Nursing Info Combined nursing hours (RN + LPN + Nurse Aide) per resident per day on weekends. Staffing often drops on weekends — this figure reveals whether the facility maintains adequate coverage outside of weekday hours. 3h 44m per day ■ Avg State avg: 3h 47m per day · National avg: 3h 26m per day
Physical Therapist Info Hours per resident per day provided by licensed Physical Therapists (PTs) or PT Assistants. PT services help residents recover mobility after injury or illness and are especially important for post-acute (short-stay) rehabilitation. 2m per day ▼ 60% State avg: 5m per day · National avg: 4m per day
Weekend RN Info Registered nurse hours specifically on weekends. Facilities sometimes reduce RN presence on Saturdays and Sundays — a low weekend RN figure compared to weekday hours can indicate reduced clinical oversight when most administrative staff are absent. 43m per day ▲ 13% State avg: 38m per day · National avg: 29m per day

Types of Care at Othello Care

Nursing Home

Capacity and availability

This home usually has availability

Occupancy lower than 85% suggests more openings may be available.

Higher occupancy than the Washington average: 72.5%
Occupancy rate 77.5% Rank #135 / 310Occupancy rate — State benchmarkedThis home is ranked 135th out of 310 homes in Washington. Shows this facility's occupancy rate versus the Washington average, with its Statewide rank out of 310. Higher occupancy signals strong local demand and financial stability.Click the rank badge to see the full State ranking.Click here to see the full State ranking.
Avg. Length of Stay 152 days
Occupancy rate
77.5% Rank #135 / 310Occupancy rate — State benchmarkedThis home is ranked 135th out of 310 homes in Washington. Shows this facility's occupancy rate versus the Washington average, with its Statewide rank out of 310. Higher occupancy signals strong local demand and financial stability.Click the rank badge to see the full State ranking.Click here to see the full State ranking.
Avg. Length of Stay
152 days
Walk Score
Walk Score: 26 / 100 Rank #499 / 628Walk Score — State benchmarkedThis home is ranked 499th out of 628 homes in Washington. Shows how walkable this facility's neighborhood is compared to the average Walk Score across Washington SNFs. Higher scores benefit residents, families, and staff.Click the rank badge to see the full State ranking.Click here to see the full State ranking.
Somewhat walkable. A few nearby services may be reachable on foot, but most trips require transportation.

Contact Othello Care

Staffing Data

Reporting period: October 1 – December 31, 2025 (Q4 2025). Source: CMS Payroll-Based Journal report.

Total staff 93
Employees 46
Contractors 47
Staff to resident ratio 3.10:1
67% better than Washington average
Washington average ratio: 1.86:1 Washington average ratio: 1.86:1See full Washington ranking
Avg staff/day 24
Average shift 7.6 hours
6% worse than Washington average
Washington average: 8.1 hours Washington average shift: 8.1 hoursSee full Washington ranking
Total staff hours (quarter) 16,734

Nursing staff breakdown

Q4 2025 · Oct 1 – Dec 31 More info This data comes from the CMS Payroll-Based Journal report covering October 1 – December 31, 2025.
Registered Nurse

Manages medical care and health needs.

RN Staff 20
Average shift length Info Average shift length. Calculated as total hours divided by days worked and average staff per day. 9.1 hours

This role is partially covered by contractors.

Licensed Practical Nurse

Assists with medical care and medications.

LPN Staff 15
Average shift length Info Average shift length. Calculated as total hours divided by days worked and average staff per day. 6.7 hours

This role is partially covered by contractors.

Certified Nursing Assistant

Helps with daily care and mobility.

CNA Staff 35
Average shift length Info Average shift length. Calculated as total hours divided by days worked and average staff per day. 7.7 hours

This role is partially covered by contractors.

Contractor staffing

Q4 2025 · Oct 1 – Dec 31 More info This data comes from the CMS Payroll-Based Journal report covering October 1 – December 31, 2025.

Total hours from contractors

17.4%

2,915 contractor hours this quarter

Registered Nurse: 15 Licensed Practical Nurse: 15 Certified Nursing Assistant: 11 Physician Assistant: 2 Clinical Nurse Specialist: 1 Nurse Aide in Training: 1 Other Physician: 1 Medical Director: 1

Staff by category

Q4 2025 · Oct 1 – Dec 31 More info This data comes from the CMS Payroll-Based Journal report covering October 1 – December 31, 2025.
Certified Nursing Assistant2411359,55492100%7.7
Registered Nurse515201,84792100%9.1
Licensed Practical Nurse015151,2198693%6.7
Clinical Nurse Specialist1127816874%9.4
Mental Health Service Worker1015907177%8.3
Speech Language Pathologist1015046368%8
Administrator1014886166%8
Nurse Practitioner1014325459%8
Dietitian1014106267%6.6
Other Dietary Services Staff1012073336%6.3
Physician Assistant1231802628%6.9
Respiratory Therapy Technician1011302123%6.2
Physical Therapy Assistant101821112%7.5
Physical Therapy Aide101671314%5.2
Qualified Social Worker101652325%2.8
Medical Director0114489%5.5
Feeding Assistant30343910%4.8
Other Physician1123867%6.3
Nurse Aide in Training0113855%7.5
Dental Services Staff1011522%7.4
35 Certified Nursing Assistant
% of Days 100%
20 Registered Nurse
% of Days 100%
15 Licensed Practical Nurse
% of Days 93%
2 Clinical Nurse Specialist
% of Days 74%
1 Mental Health Service Worker
% of Days 77%
1 Speech Language Pathologist
% of Days 68%
1 Administrator
% of Days 66%
1 Nurse Practitioner
% of Days 59%
1 Dietitian
% of Days 67%
1 Other Dietary Services Staff
% of Days 36%
3 Physician Assistant
% of Days 28%
1 Respiratory Therapy Technician
% of Days 23%
1 Physical Therapy Assistant
% of Days 12%
1 Physical Therapy Aide
% of Days 14%
1 Qualified Social Worker
% of Days 25%
1 Medical Director
% of Days 9%
3 Feeding Assistant
% of Days 10%
2 Other Physician
% of Days 7%
1 Nurse Aide in Training
% of Days 5%
1 Dental Services Staff
% of Days 2%

Penalties and fines

Includes penalties issued in 2024

Federal penalties imposed by CMS for regulatory violations, including civil money penalties (fines) and denials of payment for new Medicare/Medicaid admissions.

Source: CMS Penalties Database (Data as of Jan 2026)

Total fines amount $9K Rank #34 / 91Federal fines — State benchmarkedThis home is ranked 34th out of 91 homes in Washington. Shows this facility's cumulative CMS federal fine dollars versus the Washington average among facilities with fines, and where it ranks among 91 skilled nursing facilities in the pool. Lower total dollars mean a better rank.Click the rank badge to see the full State ranking.Click here to see the full State ranking.
89% lower than Washington average

Washington average: $82K

Number of fines 1
46% fewer fines than Washington average

Washington average: 1.8

Payment Denials Info Serious action where Medicare and/or Medicaid temporarily stops payments for new residents until issues are fixed. 0
100% fewer payment denials than Washington average

Washington average: 0.3

Fines amount comparison
This facility $9K
Washington average $82K
Penalty History

Penalties are imposed by CMS for violations of federal nursing home regulations.

1 penalty in the past 3 years

May 21, 2024 · $9K

Civil Money Penalty Info Fines imposed for noncompliance, which can be assessed per day or per instance of violation. May 21, 2024
$9K

Last updated: Jan 2026

Quality of care over time

These measures show how residents usually do over time at this home, based on health outcomes and preventive care.

High-risk clinical events score Info A composite score based on pressure ulcers, falls with injury, weight loss, walking ability decline, and activities of daily living decline. 5.6
44% better than Washington average

Washington average: 10.0

Functional decline score Info A composite score based on activities of daily living decline, walking ability decline, and incontinence. 13.2
37% better than Washington average

Washington average: 20.9

Long-stay resident measures
Significantly above average Info CMS star rating based on long-stay quality measure performance. 5 stars = significantly above average, 1 star = significantly below average.
Need for Help with Daily Activities Increased Info Percent of long-stay residents whose need for help with daily activities has increased 14.3%
13% better than Washington average

Washington average: 16.4%

Low Risk Residents with Bowel/Bladder Incontinence Info Percent of low risk long-stay residents who lose control of their bowels or bladder 12.0%
51% better than Washington average

Washington average: 24.3%

Falls with Major Injury Info Percent of long-stay residents experiencing one or more falls with major injury 0.0%
100% better than Washington average

Washington average: 2.6%

High Risk Residents with Pressure Ulcers Info Percent of long-stay high risk residents with pressure ulcers 2.7%
45% better than Washington average

Washington average: 4.9%

Urinary Tract Infection Info Percent of long-stay residents with a urinary tract infection 0.0%
100% better than Washington average

Washington average: 1.7%

Lost Too Much Weight Info Percent of long-stay residents who lose too much weight 5.4%
7% better than Washington average

Washington average: 5.8%

Depressive Symptoms Info Percent of long-stay residents who have depressive symptoms 0.0%
100% better than Washington average

Washington average: 16.2%

Antipsychotic Use Info Percent of long-stay residents who received an antipsychotic medication 1.3%
91% better than Washington average

Washington average: 14.5%

Pneumococcal Vaccine Info Percent of long-stay residents assessed and appropriately given the pneumococcal vaccine 89.7%
7% worse than Washington average

Washington average: 96.2%

Influenza Vaccine Info Percent of long-stay residents assessed and appropriately given the seasonal influenza vaccine 90.5%
In line with Washington average

Washington average: 93.8%

Short-stay resident measures
Below average Info CMS star rating based on short-stay quality measure performance. 5 stars = much above average, 1 star = much below average.
Pneumococcal Vaccine Info Percent of short-stay residents assessed and appropriately given the pneumococcal vaccine 80.2%
9% worse than Washington average

Washington average: 88.1%

Antipsychotic medication increase Info Percent of short-stay residents who newly received an antipsychotic medication 3.2%
123% worse than Washington average

Washington average: 1.4%

Influenza Vaccine Info Percent of short-stay residents assessed and appropriately given the seasonal influenza vaccine 76.7%
7% worse than Washington average

Washington average: 82.0%

Re-hospitalized after SNF stay Info Percentage of short-stay residents who were re-hospitalized after their nursing home admission. 17.3%
13% better than Washington average

Washington average: 19.9%

Emergency department visits Info Percentage of short-stay residents who had an outpatient emergency department visit. 12.2%
8% better than Washington average

Washington average: 13.2%

Falls with major injury Info Percentage of SNF residents who experience falls with major injury during their stay. 0.0%
100% better than Washington average

Washington average: 0.8%

Ability to care for self at discharge Info Percentage of residents at or above expected ability to care for themselves at discharge. 29.0%
46% worse than Washington average

Washington average: 53.7%

Successful return to home or community Info Rate of successful return to home or community from a skilled nursing facility. 48.9%
In line with Washington average

Washington average: 50.6%

Breakdown by payment type

Medicare

45% of new residents, usually for short-term rehab.

Typical stay 24 days

Private pay

45% of new residents, often for short stays.

Typical stay 2 - 3 months

Medicaid

9% of new residents, often for long-term daily care.

Typical stay 2 - 3 years

Facility Characteristics

Source: CMS Long-Term Care Facility Characteristics (Data as of Jan 2026)

Total residents 30
Medicare
10
33.3% of residents
Medicaid
17
56.7% of residents
Private pay or other
3
10% of residents
Programs & Services
Residents Group

Residents meet regularly to discuss policies, care quality, and activities

Active Resident Council

Organized group of residents that meets regularly to discuss facility policies, quality of life, and activities.

Finances and operations

Privately-owned community
Operated by a business corporation.
Home revenue
$2.8M
Operating loss
-$265.5K
Privately-owned community Operated by a business corporation.
Home revenue
$2.8M Rank #91 / 93Revenue — State benchmarkedThis home is ranked 91st out of 93 homes in Washington. Shows this facility's annual revenue compared to the Washington SNF average. Higher revenue generally means more resources for staffing and capital — read alongside Payroll %.Click the rank badge to see the full State ranking.Click here to see the full State ranking.
Operating loss
-$265.5K
Payroll costs Info The portion of the home's budget spent on staff, including nurses, caregivers, and other employees who support care and operations. Rank #91 / 93Payroll — State benchmarkedThis home is ranked 91st out of 93 homes in Washington. Shows total annual staff payroll benchmarked to the Washington average. Higher payroll investment relative to peers often signals better staffing and less reliance on cheaper contract labor.Click the rank badge to see the full State ranking.Click here to see the full State ranking.
$1.6M
57.5% of revenue Rank #23 / 93Payroll % — State benchmarkedThis home is ranked 23rd out of 93 homes in Washington. Shows payroll as a percentage of revenue versus the Washington average. Well-run Washington SNFs typically land around 53–61% — the top third Statewide. Below 25% may signal understaffing or heavy agency use — read with Staffing ratings.Click the rank badge to see the full State ranking.Click here to see the full State ranking.
Other operating costs Info All remaining costs needed to run the home, such as food, utilities, building maintenance, supplies and administrative expenses.
$1.5M
Total costs $3.1M

What does this home offer?

Housing options icon

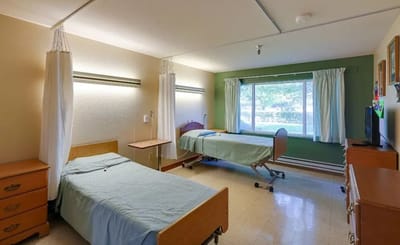
Housing Options: Private Rooms

Building type icon
Building type icon

Building Type: Single-story

Fitness and recreation icon

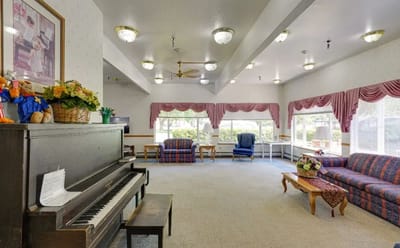
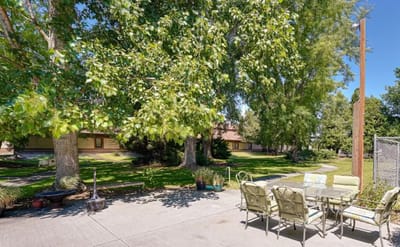
Fitness and Recreation

Who this home usually serves

TYPE OF STAY

Mix of rehab and long-term care

This home supports both short-term rehab and long-term care, with residents staying for a wide range of durations.

Places of interest near Othello Care

Address 1.3 miles from city center Info Estimated distance in miles from Othello's city center to Othello Care's address, calculated via Google Maps. — 0 miles to nearest hospital (Othello Post Acute (Formerly Othello Care))

Calculate Travel Distance to Othello Care

Add your location

Address

Financial Assistance for
Nursing Home in Washington

Othello Care is located in Othello, Washington.
Here are the financial assistance programs available to residents in Washington.

Get Financial aid guidance

Community Options Program Entry System (COPES)

WA Medicaid COPES

Age 65+ or disabled
General Washington resident, Medicaid-eligible, nursing home-level care need.
Income Limits (2025) ~$2,829/month 300% FBR, individual
Asset Limits $2,000 (individual), $3,000 (couple).
WA

High demand in urban areas (e.g., Seattle).

Benefits
Personal care (5-7 hours/day) Respite (240 hours/year) Adult day care ($70/day) Home modifications ($1,500 avg.)

Washington Family Caregiver Support Program

WA NFCSP

Age Caregiver of someone 60+ (or with dementia)
General Washington resident.
Income Limits No strict limit; prioritizes low-income.
Asset Limits Not applicable.
WA

High urban demand; rural outreach.

Benefits
In-home respite (4-6 hours/day) Adult day care (~$70/day) Short-term facility care (up to 5 days)

Community First Choice (CFC)

Washington Community First Choice

Age 65+ (or disabled 18+)
General WA resident, Medicaid-eligible, need help with 2+ ADLs/IADLs.
Income Limits (2025) ~$2,829/month; QIT optional.
Asset Limits $2,000 (individual), $3,000 (couple).
WA

Broader than COPES; serves ~20,000; self-directed option.

Benefits
Personal care (4-6 hours/day) Respite (~240 hours/year) Assistive devices Training Transportation

Older Americans Act (OAA) Services

Washington OAA Services

Age 60+
General WA resident; no income/asset limits.
Income Limits (2025) None; donations encouraged.
Asset Limits Not assessed.
WA

13 AAAs; includes Meals on Wheels; rural focus.

Benefits
Meals (~$5-$7/meal) Transportation Homemaker services (~4 hours/week) Respite (~5 days/year) Legal aid

Medicare Savings Program (MSP)

Washington Medicare Savings Program

Age 65+ or disabled
General WA resident, Medicare Part A/B.
Income Limits (2025) ~$2,510/month (QMB), ~$3,380/month (SLMB), ~$3,598/month (QI)—individual.
Asset Limits $9,430 (individual), $14,130 (couple).
WA

Includes Extra Help for Part D; no waitlist.

Benefits
Covers Part B premiums ($174.70/month) Deductibles ($240/year) Copays (~20%)

VA Aid and Attendance (A&A) and Housebound Benefits

Washington VA Aid and Attendance/Housebound

Age 65+ or disabled veteran/spouse
General WA resident, wartime service, ADL help (A&A) or homebound.
Income Limits (2025) Net income < ~$1,984/month (veteran with dependent, A&A); pension offsets income.
Asset Limits ~$155,356 net worth
WA

High veteran use; supports rural/urban needs.

Benefits
Cash (~$1,433-$2,642/month veteran, ~$951-$1,318 spouse) for care costs

Senior Citizens Property Tax Exemption

Washington Senior Property Tax Exemption

Age 61+ or disabled retiree
General WA resident, homeowner, income-based.
Income Limits (2025) ~$45,000-$70,000/year varies by county, e.g., King: $70,000
Asset Limits Not assessed; home value cap varies ~$250,000-$400,000
WA

Saves ~$500-$1,500/year; offered statewide.

Benefits
Tax exemption (~$500-$1,500/year depending on county)

Senior Farmers’ Market Nutrition Program (SFMNP)

Washington SFMNP

Age 60+
General WA resident, low-income.
Income Limits (2025) ~$2,322/month 185% FPL
Asset Limits Not assessed.
WA

Vouchers (~$80/season); serves ~20,000 via AAAs.

Benefits
Vouchers (~$80/season) for produce at farmers’ markets

Frequently Asked Questions about Othello Care

Is Othello Care in a walkable area?

Othello Care has a walk score of 26. Somewhat walkable. A few nearby services may be reachable on foot, but most trips require transportation.

What is the phone number of Othello Care?

(509) 488-9609 will put you in contact with the team at Othello Care.

Is Othello Care Medicare or Medicaid certified?

Yes — Othello Care is a CMS-certified provider of Medicare and Medicaid.

Guides for Better Senior Living

Care Cost Calculator: See Prices in Your Area

Nursing Home Data Explorer

Don’t Wait Too Long: 7 Red Flag Signs Your Parent Needs Assisted Living Now

The True Cost of Assisted Living in 2025 – And How Families Are Paying For It

Understanding Senior Living Costs: Pricing Models, Discounts & Financial Assistance

Explore Open Rooms
1 Contact details
2 What type of senior care service are you looking for?
3 What budget do you have in mind for senior care?
4 How soon do you need to find care?
5 Additional details

Thank you for your interest!

Our team will be in touch shortly to help with next steps.