

Total health inspections
3
Utah average 3.5
Last Health inspection on Apr 2024

We arrange tours, appointments, and even moving support so you don’t have to
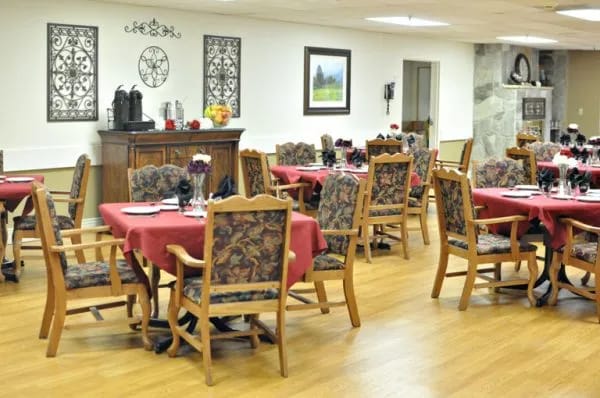
A community where quality care meets retirement living, Sandstone Brigham City is where life balances with style– creating an unparalleled level of senior living. As one of the city’s premier skilled nursing and rehabilitation centers, seniors will find endless possibilities vital for recovery. At Sandstone Brigham, seniors will feel relaxed and fulfilled during their healing journey toward a better version of themselves.
As a member of the Sandstone Health Care Group, the resident-centered community offers an array of services and amenities to ensure residents maintain an active day-to-day living supported by a vibrant lifestyle. Its medical services include comprehensive rehabilitation, orthopedic rehabilitation, ventilator care, wound care, post-operative care, and skilled nursing services delivered 24/7.
| Staff type | Hours / Day / Resident | vs state avg |
|---|---|---|
|
Registered Nurse (RN)
| 1h 23m per day | ▲ 17% State avg: 1h 11m per day · National avg: 41m per day |
|
LPN / LVN
| 10m per day | ▼ 66% State avg: 30m per day · National avg: 52m per day |
|
Nurse Aide
| 2h 12m per day | ▼ 7% State avg: 2h 22m per day · National avg: 2h 21m per day |
|
Weekend Total Nursing
| 3h 15m per day | ▼ 8% State avg: 3h 31m per day · National avg: 3h 26m per day |
|
Physical Therapist
| 0m per day | ▼ 98% State avg: 7m per day · National avg: 4m per day |
|
Weekend RN
| 58m per day | ▲ 16% State avg: 50m per day · National avg: 29m per day |
In Utah, the Department of Health and Human Services, Health Facility Licensing conducts regular onsite inspections to ensure compliance with state and federal healthcare standards.
Deficiencies
| This Facility | UT Average | vs. UT Avg |
|---|---|---|---|
|
Total deficiencies
| 22 | 14 | This facility has 57% more total deficiencies than a typical Utah nursing home (22 vs. UT avg 14).↑ 57% worse |
|
Deficiencies per year
| 3.7 | 2.3 | This facility has 61% more deficiencies per year than a typical Utah nursing home (3.7 vs. UT avg 2.3).↑ 61% worse |
Utah average 3.5
Last Health inspection on Apr 2024
Utah average 27.7
Utah average 7.62
Health citations are formal notices following inspections when they fail to comply with safety and care standards.
17 of 19 citations resulted from standard inspections; and 2 of 19 came from combined inspections (standard and complaint).
Utah average: 0.7
Utah average: 2.5
Reporting period: October 1 – December 31, 2025 (Q4 2025). Source: CMS Payroll-Based Journal report.
Manages medical care and health needs.
Assists with medical care and medications.
Helps with daily care and mobility.
Total hours from contractors
2,524 contractor hours this quarter
| Certified Nursing Assistant | 39 | 5 | 44 | 6,577 | 92 | 100% | 6.6 |
| Registered Nurse | 12 | 3 | 15 | 3,187 | 92 | 100% | 8.7 |
| Other Dietary Services Staff | 2 | 0 | 2 | 566 | 76 | 83% | 6.9 |
| Administrator | 2 | 0 | 2 | 560 | 64 | 70% | 8 |
| Clinical Nurse Specialist | 2 | 0 | 2 | 560 | 62 | 67% | 8 |
| Licensed Practical Nurse | 2 | 1 | 3 | 503 | 48 | 52% | 10.1 |
| Nurse Practitioner | 1 | 0 | 1 | 408 | 51 | 55% | 8 |
| Physical Therapy Aide | 0 | 2 | 2 | 353 | 67 | 73% | 5.2 |
| Dental Services Staff | 1 | 0 | 1 | 267 | 37 | 40% | 7.2 |
| Speech Language Pathologist | 0 | 3 | 3 | 160 | 64 | 70% | 2.5 |
| Qualified Social Worker | 0 | 2 | 2 | 121 | 37 | 40% | 3.3 |
| Physical Therapy Assistant | 0 | 2 | 2 | 39 | 21 | 23% | 1.9 |
| Respiratory Therapy Technician | 0 | 2 | 2 | 8 | 14 | 15% | 0.6 |
Federal penalties imposed by CMS for regulatory violations, including civil money penalties (fines) and denials of payment for new Medicare/Medicaid admissions.
Source: CMS Penalties Database
No penalties in the past 3 years
No civil money penalties or payment denials were reported in the last 3 years.
These measures show how residents usually do over time at this home, based on health outcomes and preventive care.
Utah average: 9.3
Utah average: 20.1
Utah average: 15.7%
Utah average: 21.3%
Utah average: 23.1%
Utah average: 2.6%
Utah average: 4.2%
Utah average: 2.1%
Utah average: 4.1%
Utah average: 16.5%
Utah average: 13.5%
Utah average: 97.1%
Utah average: 98.0%
Utah average: 92.9%
Utah average: 1.1%
Utah average: 50.6%
Quality measures are calculated from Minimum Data Set (MDS) assessments. For most measures, lower percentages indicate better care quality.
19% of new residents, usually for short-term rehab.
35% of new residents, often for short stays.
46% of new residents, often for long-term daily care.
Source: CMS Long-Term Care Facility Characteristics (Data as of Jan 2026)
Residents meet regularly to discuss policies, care quality, and activities
Organized group of residents that meets regularly to discuss facility policies, quality of life, and activities.
Data sourced from CMS Long-Term Care Facility Characteristics quarterly report. Payer mix reflects the current resident census by primary payment source.
Historical financial and operational data for Sandstone Brigham City based on CMS SNF Cost Reports.
Most residents stay for extended periods and receive ongoing daily care.
![]() 1.3 miles from city center
1.3 miles from city center
![]() Estimated distance in miles from Brigham City's city center to Sandstone Brigham City's address, calculated via Google Maps.
— 2.18 miles to nearest hospital (Advantage Medical Center)
Estimated distance in miles from Brigham City's city center to Sandstone Brigham City's address, calculated via Google Maps.
— 2.18 miles to nearest hospital (Advantage Medical Center)
Add your location
Sandstone Brigham City is located in Brigham City, Utah.
Here are the financial assistance programs available to residents in Utah.
The information below is reported by the Utah Department of Health and Human Services, Health Facility Licensing.
| Sandstone Pioneer Trail |
NH Nursing Home Licensed facility providing 24/7 skilled nursing care for residents with complex, ongoing medical needs. Staffed by RNs, LPNs, and CNAs. Inspected and star-rated annually by CMS. Accepts Medicare (short-term rehab) and Medicaid (long-term care).
AL Assisted Living A licensed, long-term care setting for seniors or individuals with disabilities who need help with daily activities — like bathing, dressing, and medication management — but not 24-hour skilled nursing. Offers housing, meals, and around-the-clock support while aiming to maximize resident independence. | Brigham City (South 200 West) | 72
Facility
72
UT AVG
84
Rank
#108 / 196 | - | - | 3.86
Facility
3.86
UT AVG
3.72
Rank
#18 / 66 | +38% | +4% | $19.7k
Facility
$19.7k
UT AVG
$52.4k
Rank
#44 / 66 | 16
Facility
16
UT AVG
27.7
Rank
#18 / 65 | 5.3
Facility
5.3
UT AVG
7.6
Rank
#22 / 65 | 2 | 35 |
52
Facility
52
UT AVG
47
Rank
#133 / 280 | Brigham City Nursing & Rehab LLC | $6.0M
Facility
$6.0M
UT AVG
$10.3M
Rank
#50 / 63 | $2.7M
Facility
$2.7M
UT AVG
$3.8M
Rank
#47 / 63 | 45.8%
Facility
45.8%
UT AVG
38%
Rank
#36 / 63 | 465020 | ||||
| Sandstone American Fork |
NH Nursing Home Licensed facility providing 24/7 skilled nursing care for residents with complex, ongoing medical needs. Staffed by RNs, LPNs, and CNAs. Inspected and star-rated annually by CMS. Accepts Medicare (short-term rehab) and Medicaid (long-term care).
AL Assisted Living A licensed, long-term care setting for seniors or individuals with disabilities who need help with daily activities — like bathing, dressing, and medication management — but not 24-hour skilled nursing. Offers housing, meals, and around-the-clock support while aiming to maximize resident independence. | American Fork | 106
Facility
106
UT AVG
84
Rank
#57 / 196 | - | - | 5.46
Facility
5.46
UT AVG
3.72
Rank
#4 / 66 | +21% | +47% | $35.4k
Facility
$35.4k
UT AVG
$52.4k
Rank
#52 / 66 | 66
Facility
66
UT AVG
27.7
Rank
#61 / 65 | 16.5
Facility
16.5
UT AVG
7.6
Rank
#61 / 65 | 6 | 19 |
49
Facility
49
UT AVG
47
Rank
#142 / 280 | American Fork Nursing & Rehabilitation LLC | $9.2M
Facility
$9.2M
UT AVG
$10.3M
Rank
#31 / 63 | $5.0M
Facility
$5.0M
UT AVG
$3.8M
Rank
#24 / 63 | 54.7%
Facility
54.7%
UT AVG
38%
Rank
#14 / 63 | 465097 | ||||
| Sandstone Brigham City |
NH Nursing Home Licensed facility providing 24/7 skilled nursing care for residents with complex, ongoing medical needs. Staffed by RNs, LPNs, and CNAs. Inspected and star-rated annually by CMS. Accepts Medicare (short-term rehab) and Medicaid (long-term care).
AL Assisted Living A licensed, long-term care setting for seniors or individuals with disabilities who need help with daily activities — like bathing, dressing, and medication management — but not 24-hour skilled nursing. Offers housing, meals, and around-the-clock support while aiming to maximize resident independence. | Brigham City (North 200 East) | 84
Facility
84
UT AVG
84
Rank
#85 / 196 | - | - | 3.67
Facility
3.67
UT AVG
3.72
Rank
#26 / 66 | +10% | -1% | $15.6k
Facility
$15.6k
UT AVG
$52.4k
Rank
#1 / 66 | 19
Facility
19
UT AVG
27.7
Rank
#25 / 65 | 6.3
Facility
6.3
UT AVG
7.6
Rank
#32 / 65 | 2 | 33 |
26
Facility
26
UT AVG
47
Rank
#213 / 280 | Willow Glen Nursing & Rehab LLC | $6.3M
Facility
$6.3M
UT AVG
$10.3M
Rank
#48 / 63 | $2.6M
Facility
$2.6M
UT AVG
$3.8M
Rank
#49 / 63 | 41.6%
Facility
41.6%
UT AVG
38%
Rank
#41 / 63 | 465093 |
Sandstone Brigham City is in the North 200 East neighborhood of Brigham City.
Sandstone Brigham City has a walk score of 26. Somewhat walkable. A few nearby services may be reachable on foot, but most trips require transportation.
According to UT state health department records, Sandstone Brigham City's license expires on July 31, 2027.
Sandstone Brigham City has 84 beds.
Yes — there is 1 photo of Sandstone Brigham City in the photo gallery on this page.
(435) 723-3228 will put you in contact with the team at Sandstone Brigham City.
Sandstone Brigham City is in Box Elder County.
Care Cost Calculator: See Prices in Your Area
Nursing Home Data Explorer
Don’t Wait Too Long: 7 Red Flag Signs Your Parent Needs Assisted Living Now
The True Cost of Assisted Living in 2025 – And How Families Are Paying For It
Understanding Senior Living Costs: Pricing Models, Discounts & Financial Assistance


Thank you for your interest!
Our team will be in touch shortly to help with next steps.
