


Total staff
154
Employees
114
Contractors
40
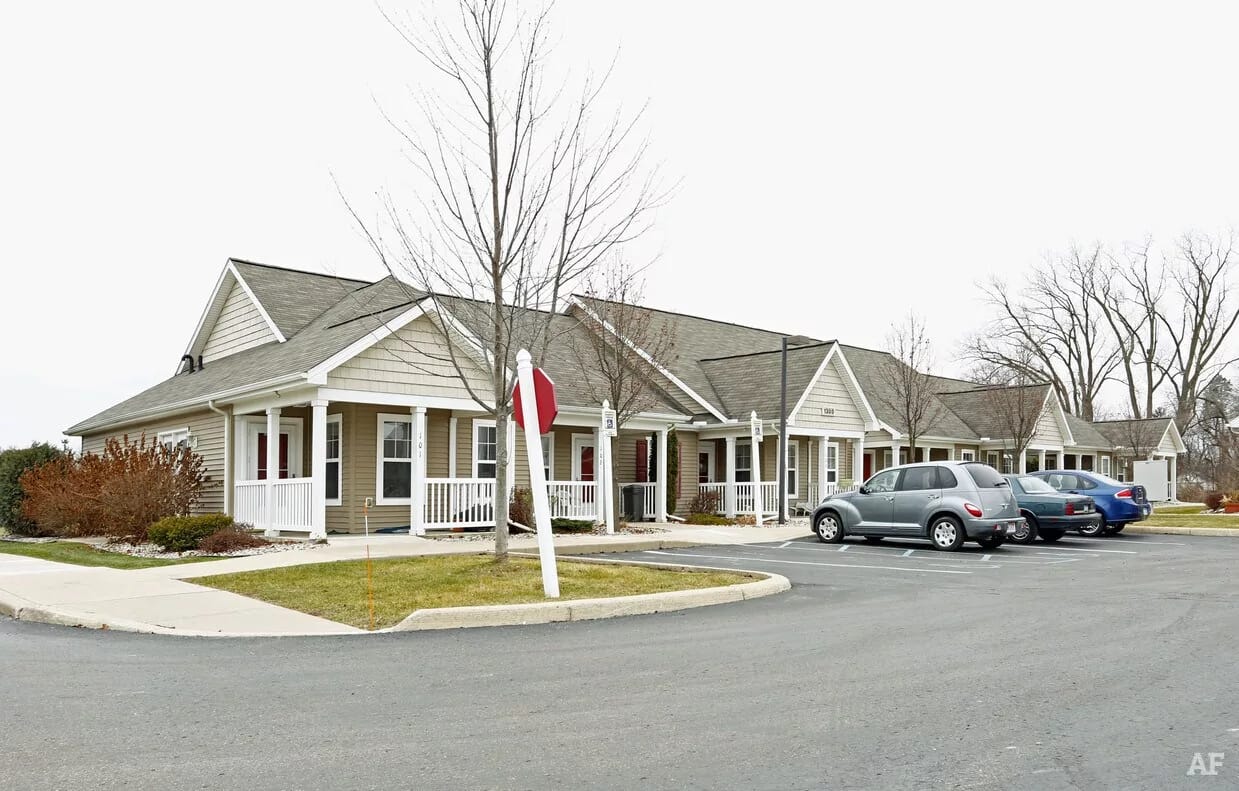
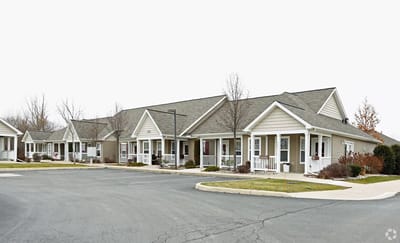
Offering nursing home and assisted living services, Lutheran Homes of Michigan is a senior living community in Monroe, Michigan. The community provides care in a Christian, faith-based environment. It also offers rehabilitation and physical therapy for residents recovering from an illness, injury, or hospital stay.
The 122-bed facility has an occupancy rate of about 61%, giving families a good chance of finding room availability. Residents stay for an average of about 92 days, which is a mix of short-term rehabilitation and longer-term nursing care. Nursing staff provide an average of about 4 hours and 20 minutes of care per resident each day. Registered nurses contribute about 20 minutes for clinical oversight and care planning.
Lutheran Homes of Michigan accepts Medicare, Medicaid, and private pay, giving families several ways to help cover the cost of short-term rehabilitation and long-term nursing care.
Residents can take part in an active Resident Council. Here, they meet regularly to discuss community policies, care quality, and daily activities. The community also operates a state-approved Nurse Aide Training and Competency Evaluation Program, helping train future caregiving staff. The facility is a little under a mile from downtown Monroe. The area has a Walk Score of 57 out of 100, which is considered moderately walkable. Some errands can be completed on foot, while most trips require a short drive.
| Staff type | Hours / Day / Resident | vs state avg |
|---|---|---|
|
Registered Nurse (RN)
| 20m per day | ▼ 57% State avg: 46m per day · National avg: 41m per day |
|
LPN / LVN
| 1h 16m per day | ▲ 44% State avg: 53m per day · National avg: 52m per day |
|
Nurse Aide
| 2h 8m per day | ▼ 10% State avg: 2h 23m per day · National avg: 2h 21m per day |
|
Weekend Total Nursing
| 3h 20m per day | ▼ 5% State avg: 3h 31m per day · National avg: 3h 26m per day |
|
Physical Therapist
| 4m per day | ▲ 8% State avg: 4m per day · National avg: 4m per day |
|
Weekend RN
| 14m per day | ▼ 50% State avg: 29m per day · National avg: 29m per day |
Reporting period: October 1 – December 31, 2025 (Q4 2025). Source: CMS Payroll-Based Journal report.
Manages medical care and health needs.
Assists with medical care and medications.
Helps with daily care and mobility.
Total hours from contractors
3,596 contractor hours this quarter
| Certified Nursing Assistant | 55 | 8 | 63 | 13,920 | 92 | 100% | 7.1 |
| Licensed Practical Nurse | 33 | 10 | 43 | 7,340 | 92 | 100% | 8.3 |
| Registered Nurse | 8 | 5 | 13 | 1,687 | 90 | 98% | 8.4 |
| RN Director of Nursing | 3 | 0 | 3 | 1,368 | 63 | 68% | 8 |
| Other Dietary Services Staff | 4 | 0 | 4 | 1,187 | 89 | 97% | 6.7 |
| Nurse Aide in Training | 5 | 0 | 5 | 776 | 80 | 87% | 7.2 |
| Physical Therapy Aide | 0 | 4 | 4 | 679 | 76 | 83% | 5.8 |
| Administrator | 1 | 1 | 2 | 550 | 61 | 66% | 8.3 |
| Respiratory Therapy Technician | 0 | 1 | 1 | 496 | 63 | 68% | 7.9 |
| Nurse Practitioner | 1 | 1 | 2 | 445 | 50 | 54% | 8.1 |
| Dietitian | 1 | 0 | 1 | 440 | 55 | 60% | 8 |
| Mental Health Service Worker | 1 | 0 | 1 | 440 | 55 | 60% | 8 |
| Speech Language Pathologist | 0 | 2 | 2 | 410 | 61 | 66% | 6.6 |
| Dental Services Staff | 1 | 0 | 1 | 320 | 43 | 47% | 7.4 |
| Occupational Therapy Aide | 0 | 1 | 1 | 176 | 22 | 24% | 8 |
| Clinical Nurse Specialist | 1 | 0 | 1 | 113 | 15 | 16% | 7.5 |
| Physical Therapy Assistant | 0 | 4 | 4 | 103 | 24 | 26% | 3.7 |
| Qualified Social Worker | 0 | 1 | 1 | 98 | 34 | 37% | 2.9 |
| Medical Director | 0 | 1 | 1 | 40 | 24 | 26% | 1.7 |
| Occupational Therapy Assistant | 0 | 1 | 1 | 26 | 5 | 5% | 5.2 |
Federal penalties imposed by CMS for regulatory violations, including civil money penalties (fines) and denials of payment for new Medicare/Medicaid admissions.
Source: CMS Penalties Database
No penalties in the past 3 years
No civil money penalties or payment denials were reported in the last 3 years.
These measures show how residents usually do over time at this home, based on health outcomes and preventive care.
Michigan average: 8.4
Michigan average: 16.3
Michigan average: 12.5%
Michigan average: 15.3%
Michigan average: 21.0%
Michigan average: 3.2%
Michigan average: 5.7%
Michigan average: 1.7%
Michigan average: 5.7%
Michigan average: 3.9%
Michigan average: 15.0%
Michigan average: 94.9%
Michigan average: 95.0%
Michigan average: 1.74
Michigan average: 1.54
Michigan average: 82.5%
Michigan average: 1.4%
Michigan average: 79.5%
Michigan average: 24.2%
Michigan average: 11.5%
Michigan average: 0.8%
Michigan average: 53.7%
Michigan average: 50.6%
Quality measures are calculated from Minimum Data Set (MDS) assessments. For most measures, lower percentages indicate better care quality.
35% of new residents, usually for short-term rehab.
58% of new residents, often for short stays.
6% of new residents, often for long-term daily care.
Source: CMS Long-Term Care Facility Characteristics (Data as of Jan 2026)
Residents meet regularly to discuss policies, care quality, and activities
State-approved Nurse Aide Training and Competency Evaluation Program on-site
Organized group of residents that meets regularly to discuss facility policies, quality of life, and activities.
Data sourced from CMS Long-Term Care Facility Characteristics quarterly report. Payer mix reflects the current resident census by primary payment source.
Historical financial and operational data for Lutheran Homes of Michigan from 2013–2023, based on CMS SNF Cost Reports.
Key figures below are for fiscal year ending in 12/2023.
Based on CMS SNF Cost Report for fiscal year ending in 12/2023.
This home supports both short-term rehab and long-term care, with residents staying for a wide range of durations.
Most new residents arrive under private pay (58% of admissions), and a typical private pay stay runs around 1 - 2 months.
Coverage residents most often arrive under.
Coverage residents most often leave under.
![]() 0.9 miles from city center
0.9 miles from city center
![]() Estimated distance in miles from Monroe's city center to Lutheran Homes of Michigan's address, calculated via Google Maps.
— 17.7 miles to nearest hospital (Oakwood Southshore Medical Center Pth)
Estimated distance in miles from Monroe's city center to Lutheran Homes of Michigan's address, calculated via Google Maps.
— 17.7 miles to nearest hospital (Oakwood Southshore Medical Center Pth)
Add your location
Lutheran Homes of Michigan is located in Monroe, Michigan.
Here are the financial assistance programs available to residents in Michigan.
Lutheran Homes of Michigan is in the South Monroe neighborhood.
Lutheran Homes of Michigan has a walk score of 57. Moderately walkable. Some errands can be accomplished on foot, with a mix of nearby amenities.
Lutheran Homes of Michigan's occupancy is 62.8%.
No, Lutheran Homes of Michigan has a no-pet policy.
Lutheran Homes of Michigan is registered as a non-profit.
Yes — there are 2 photos of Lutheran Homes of Michigan in the photo gallery on this page.
Lutheran Homes of Michigan is located at 1450 S Monroe St, Monroe, MI 48161.
Care Cost Calculator: See Prices in Your Area
Nursing Home Data Explorer
Don’t Wait Too Long: 7 Red Flag Signs Your Parent Needs Assisted Living Now
The True Cost of Assisted Living in 2025 – And How Families Are Paying For It
Understanding Senior Living Costs: Pricing Models, Discounts & Financial Assistance


