


ProMedica Assisted Living Lafayette
Assisted Living & Nursing Home · Lafayette, CO


ProMedica Assisted Living Lafayette
Assisted Living & Nursing Home · Lafayette, CO
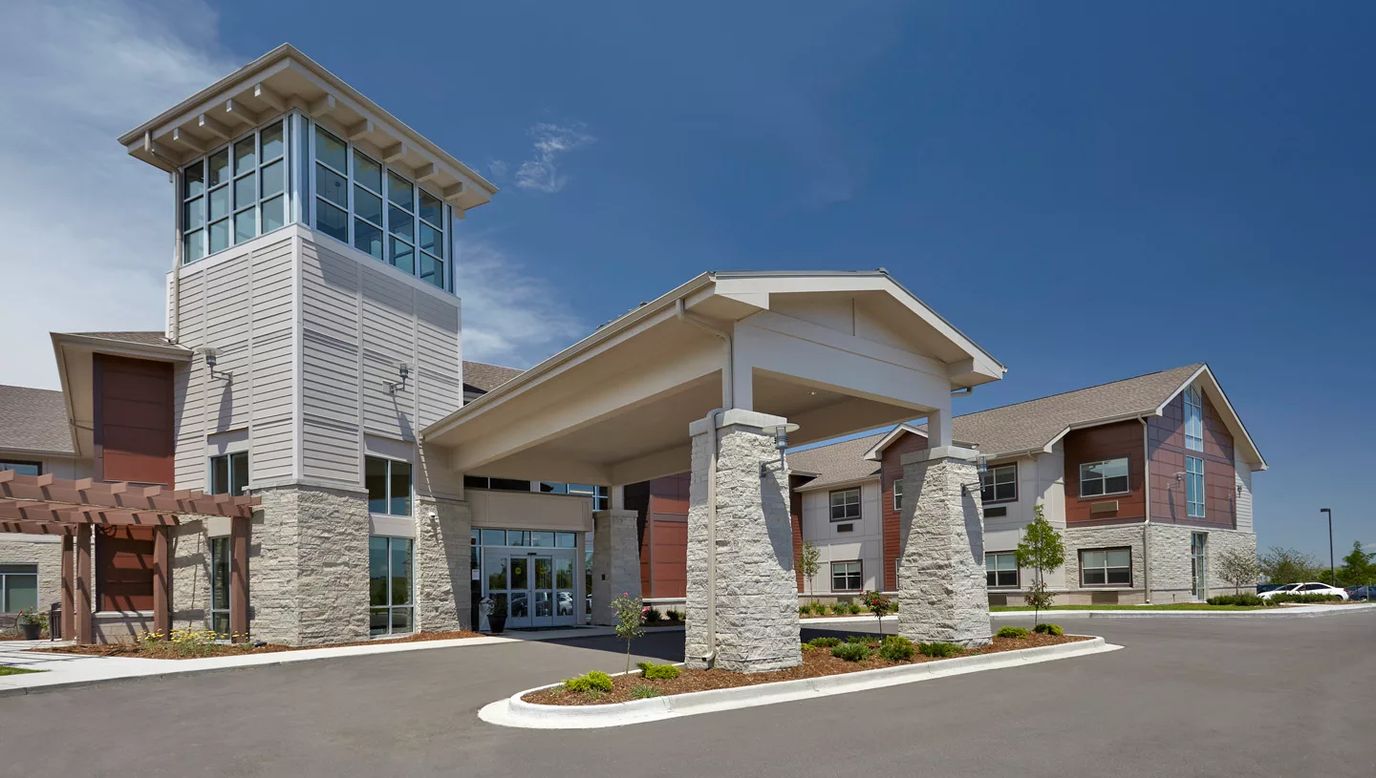
Located at 329 Exempla Circle in Lafayette, Colorado, ProMedica Assisted Living Lafayette is a two-story assisted living community. It’s about 2 miles from the city center and approximately 4 miles from AdventHealth Avista. Hospital care is within easy reach when needed. Residents can choose from private and semi-private rooms, giving families flexibility based on their budget and living preferences.
Care focuses on daily support rather than intensive clinical services. Residents receive 24-hour supervision, medication management, and mobility assistance. There are also structured activities that encourage engagement throughout the day. Outside rehabilitative care and physical therapy are available for residents who need them. Staff provide reassurance and guidance for residents adjusting to community living.
Transportation services and fitness and recreation programs help residents stay active and maintain routines beyond the community. Pets are welcome in the community, which can make the transition easier for residents who want to keep a companion animal.
The area has a Walk Score of 28, which is somewhat walkable. A few nearby errands and short outings may be possible on foot, but most trips require a car. Families planning regular visits or outings may want to keep that tradeoff in mind. Families considering the home should ask about current room availability and pricing.
Walk Score: 28 / 100 Rank #700 / 869Walk Score — State benchmarkedThis home is ranked 700th out of 869 homes in Colorado for Walk Score. Shows how walkable this facility's neighborhood is compared to the average Walk Score across Colorado facilities. Higher scores benefit residents, families, and staff.Facilities with the same value for a metric share the same rank. Rankings are based only on facilities in Colorado that report data for that category. Facilities without available data are excluded from the ranking.Click the rank badge to see the full State ranking.Click here to see the full State ranking.
Somewhat walkable. A few nearby services may be reachable on foot, but most trips require transportation.
What does this home offer?
Pets Allowed
Housing Options: Private Rooms / Semi-Private Rooms
Building Type: Two-story
Transportation Services
Fitness and Recreation
Places of interest near ProMedica Assisted Living Lafayette
![]() 1.8 miles from city center
1.8 miles from city center
![]() Estimated distance in miles from Lafayette's city center to ProMedica Assisted Living Lafayette's address, calculated via Google Maps.
— 3.79 miles to nearest hospital (AdventHealth Avista)
Estimated distance in miles from Lafayette's city center to ProMedica Assisted Living Lafayette's address, calculated via Google Maps.
— 3.79 miles to nearest hospital (AdventHealth Avista)
Calculate Travel Distance to ProMedica Assisted Living Lafayette
Add your location
Financial Assistance for
Assisted Living in Colorado
ProMedica Assisted Living Lafayette is located in Lafayette, Colorado.
Here are the financial assistance programs available to residents in Colorado.
Frequently Asked Questions about ProMedica Assisted Living Lafayette
Is ProMedica Assisted Living Lafayette in a walkable area?
ProMedica Assisted Living Lafayette has a walk score of 28. Somewhat walkable. A few nearby services may be reachable on foot, but most trips require transportation.
Are there photos of ProMedica Assisted Living Lafayette?
Yes — there are 4 photos of ProMedica Assisted Living Lafayette in the photo gallery on this page.
What is the address of ProMedica Assisted Living Lafayette?
ProMedica Assisted Living Lafayette is located at 329 Exempla Cir, Lafayette, CO 80026.
What is the phone number of ProMedica Assisted Living Lafayette?
(720) 639-2200 will put you in contact with the team at ProMedica Assisted Living Lafayette.
Is ProMedica Assisted Living Lafayette Medicare or Medicaid certified?
ProMedica Assisted Living Lafayette is not currently listed as a CMS-certified provider of Medicare or Medicaid.
Guides for Better Senior Living
Care Cost Calculator: See Prices in Your Area
Nursing Home Data Explorer
Don’t Wait Too Long: 7 Red Flag Signs Your Parent Needs Assisted Living Now
The True Cost of Assisted Living in 2025 – And How Families Are Paying For It
Understanding Senior Living Costs: Pricing Models, Discounts & Financial Assistance
Updated on
