


Total health inspections
10
Vermont average 6.5
Last Health inspection on Aug 2025
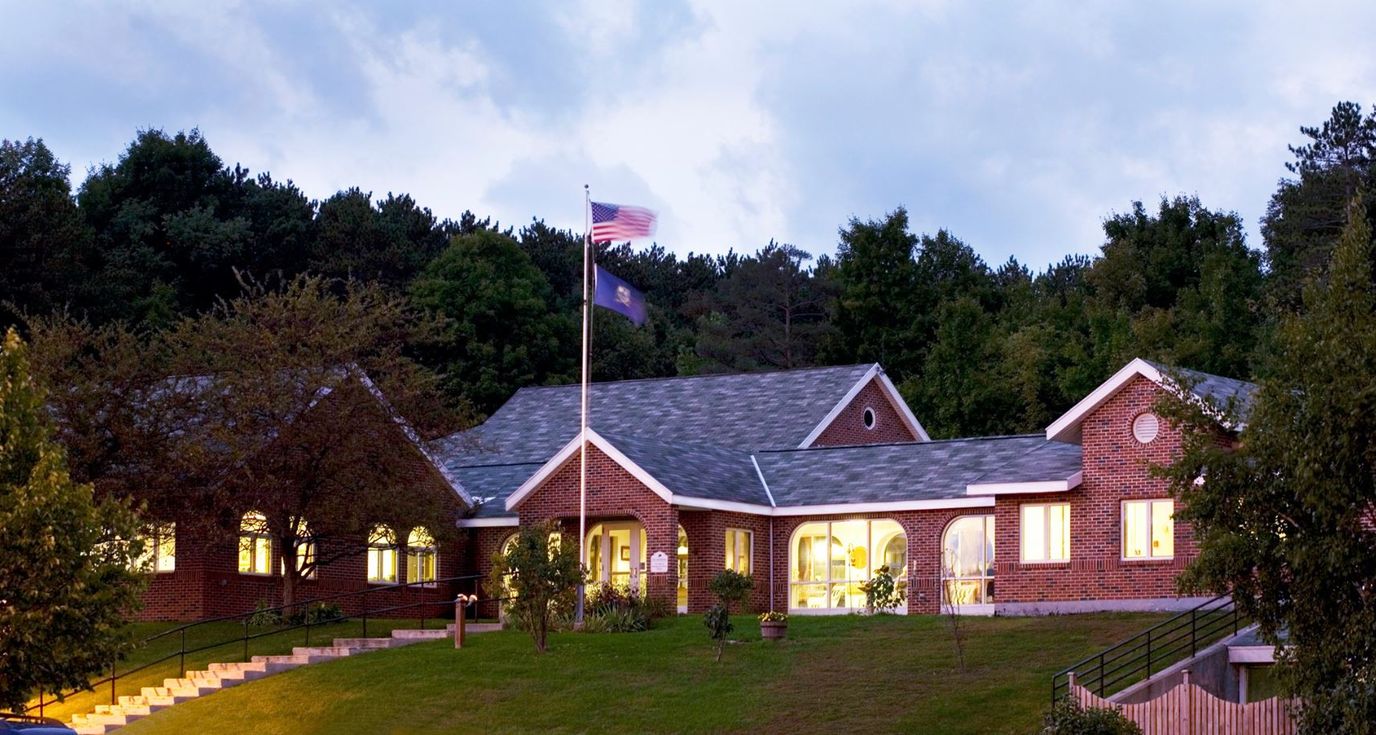
Situated in the vibrant and lush surroundings of Bennington, VT, The Center for Living and Rehabilitation is a trusted senior living community providing various care options including subacute rehabilitation, orthopedic, infectious disease, long-term, palliative, memory, and respite care. The community strives to provide the highest quality of care for seniors so they can jump back into their lives as soon as possible. A kind and compassionate team lends extra care and support around the clock to ensure residents thrive and reach their full potential.
Utilizing an innovative approach, the community ensures seniors receive the utmost medical assistance and unmatched comfort. Create unforgettable moments with friends and cherish personal time within the tranquil and stunning spaces of the community. With healthy and tasty meals, seniors can rest assured of meeting their dietary needs and tastes. The Center for Living and Rehabilitation is a safe place for seniors to spend their healing journey without worries.
| Staff type | Hours / Day / Resident | vs state avg |
|---|---|---|
|
Registered Nurse (RN)
| 42m per day | ▼ 13% State avg: 49m per day · National avg: 41m per day |
|
LPN / LVN
| 1h 9m per day | ▲ 30% State avg: 53m per day · National avg: 52m per day |
|
Nurse Aide
| 2h 21m per day | ▼ 9% State avg: 2h 35m per day · National avg: 2h 21m per day |
|
Weekend Total Nursing
| 3h 23m per day | ▼ 8% State avg: 3h 41m per day · National avg: 3h 26m per day |
|
Physical Therapist
| 8m per day | ▲ 33% State avg: 6m per day · National avg: 4m per day |
|
Weekend RN
| 21m per day | ▼ 34% State avg: 32m per day · National avg: 29m per day |
In Vermont, the Department of Disabilities, Aging and Independent Living is the authority responsible for inspecting facilities and investigating complaints to protect resident well-being.
Deficiencies
| This Facility | VT Average | vs. VT Avg |
|---|---|---|---|
|
Total deficiencies
| 51 | 41 | This facility has 24% more total deficiencies than a typical Vermont nursing home (51 vs. VT avg 41).↑ 24% worse |
|
Deficiencies per year
| 17 | 13.7 | This facility has 24% more deficiencies per year than a typical Vermont nursing home (17 vs. VT avg 13.7).↑ 24% worse |
Vermont average 6.5
Last Health inspection on Aug 2025
Vermont average 28.9
Vermont average 4.31
Health citations are formal notices following inspections when they fail to comply with safety and care standards.
24 of 39 citations resulted from standard inspections; 14 of 39 resulted from complaint investigations; and 1 of 39 came from combined inspections (standard and complaint).
Vermont average: 0.7
Vermont average: 1.9
Reporting period: October 1 – December 31, 2025 (Q4 2025). Source: CMS Payroll-Based Journal report.
Manages medical care and health needs.
Assists with medical care and medications.
Helps with daily care and mobility.
Total hours from contractors
13,973 contractor hours this quarter
| Certified Nursing Assistant | 71 | 20 | 91 | 26,559 | 92 | 100% | 8.7 |
| Licensed Practical Nurse | 17 | 22 | 39 | 12,563 | 92 | 100% | 8.7 |
| Registered Nurse | 17 | 2 | 19 | 5,537 | 92 | 100% | 7.9 |
| Clinical Nurse Specialist | 5 | 0 | 5 | 2,013 | 72 | 78% | 7.6 |
| Physical Therapy Assistant | 5 | 0 | 5 | 1,895 | 81 | 88% | 7.4 |
| Other Dietary Services Staff | 10 | 0 | 10 | 1,892 | 92 | 100% | 4.9 |
| Respiratory Therapy Technician | 8 | 0 | 8 | 1,496 | 80 | 87% | 6.1 |
| Speech Language Pathologist | 6 | 0 | 6 | 1,099 | 80 | 87% | 7.9 |
| Administrator | 2 | 0 | 2 | 908 | 62 | 67% | 7.6 |
| Physical Therapy Aide | 2 | 0 | 2 | 907 | 69 | 75% | 7.6 |
| Mental Health Service Worker | 2 | 0 | 2 | 796 | 62 | 67% | 7.6 |
| Occupational Therapy Aide | 1 | 0 | 1 | 502 | 65 | 71% | 7.7 |
| Qualified Social Worker | 2 | 0 | 2 | 454 | 61 | 66% | 7 |
| Nurse Practitioner | 1 | 0 | 1 | 431 | 59 | 64% | 7.3 |
| RN Director of Nursing | 1 | 0 | 1 | 356 | 50 | 54% | 7.1 |
Federal penalties imposed by CMS for regulatory violations, including civil money penalties (fines) and denials of payment for new Medicare/Medicaid admissions.
Source: CMS Penalties Database
No penalties in the past 3 years
No civil money penalties or payment denials were reported in the last 3 years.
These measures show how residents usually do over time at this home, based on health outcomes and preventive care.
Vermont average: 11.6
Vermont average: 22.7
Vermont average: 20.4%
Vermont average: 20.1%
Vermont average: 27.6%
Vermont average: 5.8%
Vermont average: 6.4%
Vermont average: 2.5%
Vermont average: 5.5%
Vermont average: 10.0%
Vermont average: 19.4%
Vermont average: 95.6%
Vermont average: 97.6%
Vermont average: 1.44
Vermont average: 2.48
Vermont average: 86.3%
Vermont average: 1.7%
Vermont average: 78.9%
Vermont average: 21.5%
Vermont average: 17.6%
Vermont average: 0.8%
Vermont average: 53.7%
Vermont average: 50.6%
Quality measures are calculated from Minimum Data Set (MDS) assessments. For most measures, lower percentages indicate better care quality.
57% of new residents, usually for short-term rehab.
43% of new residents, often for short stays.
Source: CMS Long-Term Care Facility Characteristics (Data as of Jan 2026)
Residents meet regularly to discuss policies, care quality, and activities
State-approved Nurse Aide Training and Competency Evaluation Program on-site
Organized group of residents that meets regularly to discuss facility policies, quality of life, and activities.
Data sourced from CMS Long-Term Care Facility Characteristics quarterly report. Payer mix reflects the current resident census by primary payment source.
Historical financial and operational data for The Center for Living and Rehabilitation from 2012–2023, based on CMS SNF Cost Reports.
Based on CMS SNF Cost Report for fiscal year ending in 12/2023.
Housing Options: Private Rooms / Semi-Private Rooms
Building Type: Single-story
Most residents typically stay for a few weeks or months before returning home or moving on.
Most new residents arrive under Medicare (57% of admissions), and a typical Medicare stay runs around 28 days.
Coverage residents most often arrive under.
Coverage residents most often leave under.
![]() 1.3 miles from city center
1.3 miles from city center
![]() Estimated distance in miles from Bennington's city center to The Center for Living and Rehabilitation's address, calculated via Google Maps.
Estimated distance in miles from Bennington's city center to The Center for Living and Rehabilitation's address, calculated via Google Maps.
Add your location
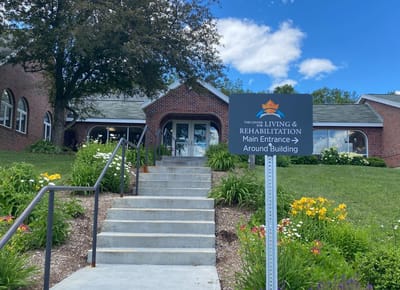
The Center for Living and Rehabilitation is located in Bennington, Vermont.
Here are the financial assistance programs available to residents in Vermont.
The Center for Living and Rehabilitation has a walk score of 13. Car-dependent. Most errands require a car, with limited nearby walkable options.
The Center for Living and Rehabilitation's occupancy is 100.1%.
The Center for Living and Rehabilitation is registered as a for-profit in VT.
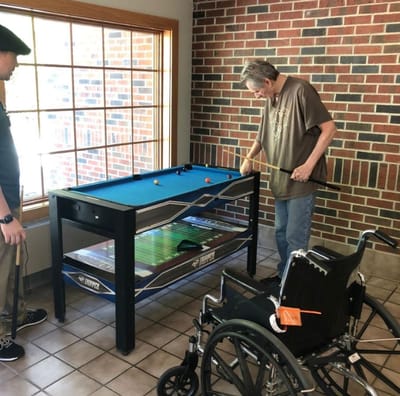
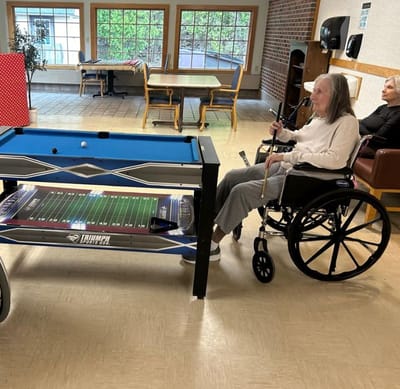
Yes — there are 4 photos of The Center for Living and Rehabilitation in the photo gallery on this page.
The Center for Living and Rehabilitation is located at 160 Hospital Dr, Bennington, VT 05201.
(802) 447-1547 will put you in contact with the team at The Center for Living and Rehabilitation.
The Center for Living and Rehabilitation is in Bennington County.
Care Cost Calculator: See Prices in Your Area
Nursing Home Data Explorer
Don’t Wait Too Long: 7 Red Flag Signs Your Parent Needs Assisted Living Now
The True Cost of Assisted Living in 2025 – And How Families Are Paying For It
Understanding Senior Living Costs: Pricing Models, Discounts & Financial Assistance


