


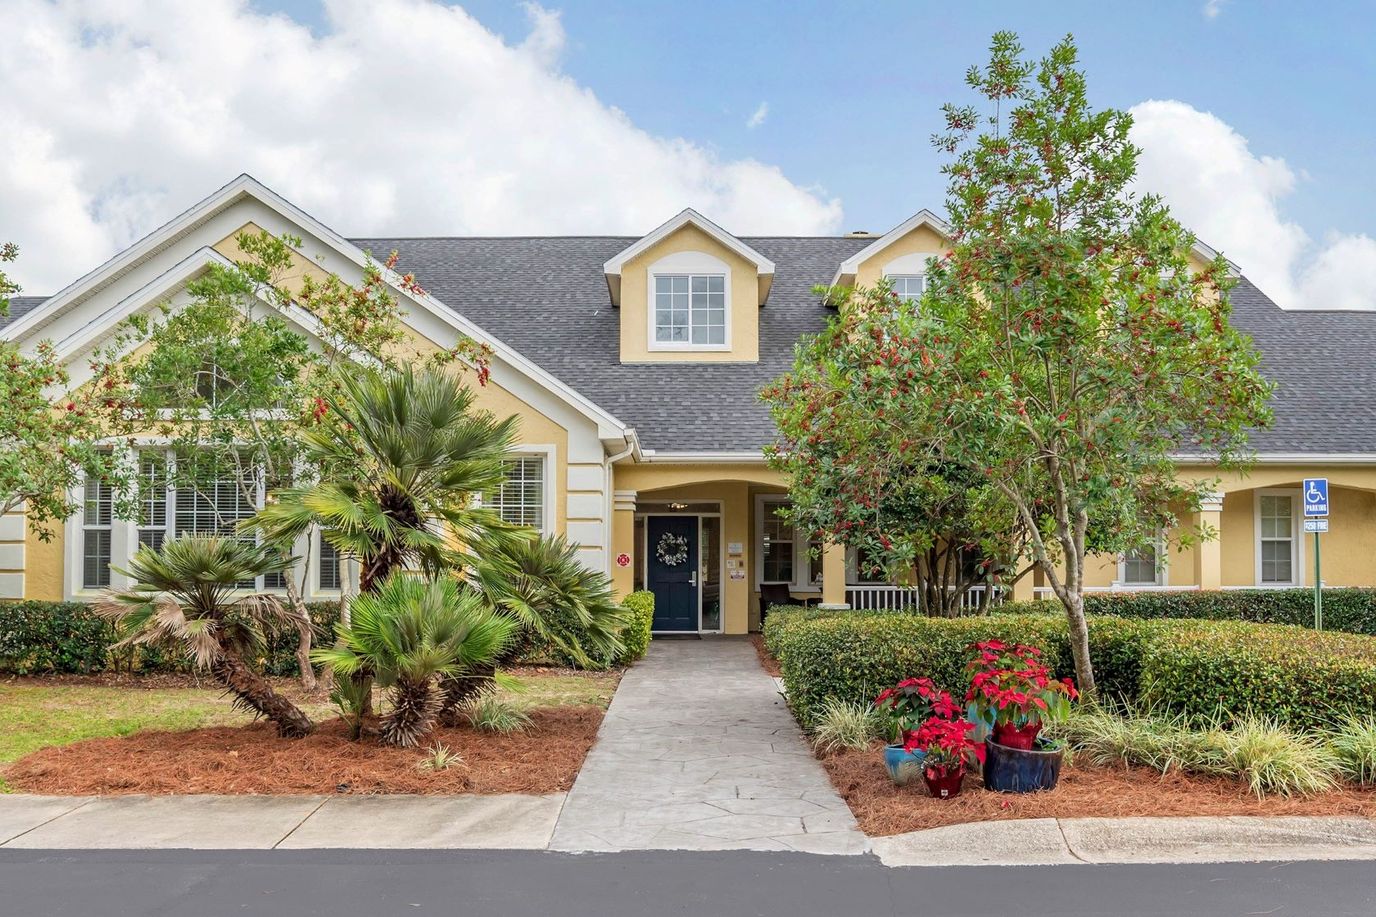
The Opal at Bluewater Bay
Assisted Living & Nursing Home · Niceville, FL
The Opal at Bluewater Bay
Assisted Living & Nursing Home · Niceville, FL
The Opal at Bluewater Bay accepts Insurance and/or HMO and Veteran Affairs Benefits.
Settled in the vibrant neighborhood of Niceville, FL, The Opal at Bluewater Bay is a peculiar senior living community that provides assisted living services. A variety of luxurious accommodations are available for its residents. This community offers round-the-clock personalized care and support for its residents through its highly equipped and dedicated team.
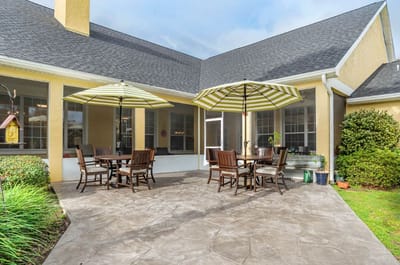
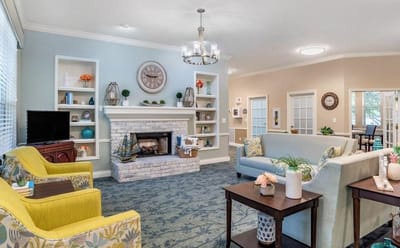
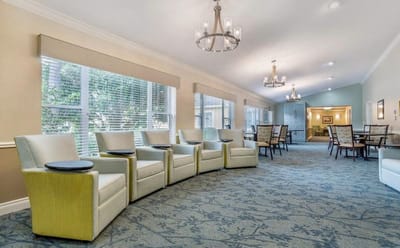
Enjoy its wide array of top-tier amenities and services including personalized care to meet individual needs, medical assistance and preferred pharmacy, on-site physician, and specialty providers, physical, occupational, and speech therapy, and mobile lab and diagnostic services. With its mantra, “Enjoy Every Moment”, indulge in its nutritious and home-cooked meals and engage with interactive social events. At The Opal at Bluewater Bay, seniors are assured of a fantastic living experience.
65-bed community Rank #659 / 1058Bed count — State benchmarkedThis home is ranked 659th out of 1058 homes in Florida for bed count. Shows this facility's certified or reported bed count compared to other Florida facilities. Larger communities may offer more amenities, programs, and on-site services for residents and families.Facilities with the same value for a metric share the same rank. Rankings are based only on facilities in Florida that report data for that category. Facilities without available data are excluded from the ranking.Click the rank badge to see the full State ranking.Click here to see the full State ranking.
A moderately sized community that may balance personal attention with shared amenities and social activities.
Walk Score: 55 / 100 Rank #426 / 1487Walk Score — State benchmarkedThis home is ranked 426th out of 1487 homes in Florida for walk score. Shows how walkable this facility's neighborhood is compared to the average walk score across Florida facilities. Higher scores benefit residents, families, and staff.Facilities with the same value for a metric share the same rank. Rankings are based only on facilities in Florida that report data for that category. Facilities without available data are excluded from the ranking.Click the rank badge to see the full State ranking.Click here to see the full State ranking.
Moderately walkable. Some errands can be accomplished on foot, with a mix of nearby amenities.
About this community
Facility TypeAssisted Living Facility
IssuanceJune 28, 2024
CountyOkaloosa
License Number9189
The Opal at Bluewater Bay is legally operated by Niceville OSL Property, LLC, and administered by Barbara Scheurer.
Profit StatusFor-profit
Private
65 units
Total beds
65 units
Staffing
Key information about the people who lead and staff this community.
Inspection History
In Florida, the Agency for Health Care Administration (AHCA) is the primary authority that conducts unannounced inspections and completes official health quality reports for all healthcare facilities.
Since 2013 · 13 years of data
25 citations
29 inspections
6 fines
$3.8K fined
Inspection Score
 A composite 0–100 score combining this facility's inspections, citations, complaints, and enforcement actions relative to the Florida state average. The score below shows how many points this facility sits above or below the typical Florida nursing home score (the benchmark); higher is better.This is a proprietary Assisted Living Magazine score.
1 point above the Florida average for nursing homes (83/100)
Rank #474 / 876 in Florida Inspection Score — State benchmarked This home is ranked 474th out of 876 homes in Florida for inspection score. Shows this facility's inspection score compared to the Florida average among 876 comparable communities in the ranking pool. Facilities with the same value for a metric share the same rank. Rankings are based only on facilities in Florida that report data for that category. Facilities without available data are excluded from the ranking. This is a proprietary Assisted Living Magazine score. Inspection score: 84 out of 100. Letter grade B. 1 point above the Florida average for nursing homes (83/100)Legal Actions
Formal stipulations and orders filed by Florida regulators against this facility, including fines and total monetary penalties.
This Facility
FL Average
vs. FL Avg-
6vs 5 avg↑ 20% higher than FL avg
-
$3.8kvs $11.6k↓ 68% lower than FL avg
Data reflects the most recent 13 years (since 2013).
Inspection Scorecard
This scorecard compares key inspection, citation, and complaint metrics at this facility against the Florida state average. Metrics rated ≥15% worse than average are highlighted in red; those ≥15% better are highlighted in green.
Since 2013 vs. Florida state average
Overall vs. FL average
0 Worse
No metrics in this bucket.
1 At Avg
Metrics at Florida average:
• Inspections with citations (at FL avg) 3 Better Metrics better than Florida average:
• Total citations (24% below)
• Citations per inspection (31% below)
• Inspection citation rate (11% below)
• Inspections with citations (at FL avg) 3 Better Metrics better than Florida average:
• Total citations (24% below)
• Citations per inspection (31% below)
• Inspection citation rate (11% below)
Citations
| This Facility | FL Average | vs. FL Avg |
|---|---|---|---|
|
Total citations
| 25 | 33 | This facility has 24% fewer total citations than a typical Florida nursing home (25 vs. FL avg 33).↓ 24% better Rank #391 / 907 Total citations — State benchmarked This home is ranked 391st out of 907 homes in Florida for total citations. Shows this facility's total citations compared to the Florida average among 907 comparable communities in the ranking pool. Facilities with the same value for a metric share the same rank. Rankings are based only on facilities in Florida that report data for that category. Facilities without available data are excluded from the ranking. |
|
Citations per inspection
| 0.9 | 1.3 | This facility has 31% fewer citations per inspection than a typical Florida nursing home (0.9 vs. FL avg 1.3).↓ 31% better Rank #55 / 907 Citations per inspection — State benchmarked This home is ranked 55th out of 907 homes in Florida for citations per inspection. Shows this facility's citations per inspection compared to the Florida average among 907 comparable communities in the ranking pool. Facilities with the same value for a metric share the same rank. Rankings are based only on facilities in Florida that report data for that category. Facilities without available data are excluded from the ranking. |
Inspections
| This Facility | FL Average | vs. FL Avg |
|---|---|---|---|
|
Total inspections
| 29 | 26 | This facility has had 12% more total inspections than the Florida average (29 vs. FL avg 26). More inspections can mean more regulatory scrutiny rather than worse care.↑ 12% more |
|
Inspections with citations
| 16 | 16 | This facility has inspections with citations in line with the Florida average (16 vs. FL avg 16).— At avg |
|
Inspection citation rate
| 55% | 62% | This facility has 7 percentage points lower inspection citation rate than a typical Florida nursing home (55% vs. FL avg 62%).↓ 7% better Rank #432 / 907 Inspection citation rate — State benchmarked This home is ranked 432nd out of 907 homes in Florida for % of inspections with citations. Shows this facility's % of inspections with citations compared to the Florida average among 907 comparable communities in the ranking pool. Facilities with the same value for a metric share the same rank. Rankings are based only on facilities in Florida that report data for that category. Facilities without available data are excluded from the ranking. |
Inspection Reports Summary
An editor-reviewed summary of the themes and findings across this facility's recent inspection reports.
- The most recent inspections on August 26, July 25, and June 5, 2024, reported no deficiencies or complaints.
- Past deficiencies mostly involved background screening issues and food service or staff training, with no recent recurrence since 2019.
- The facility had several Class 3 and Class 4 deficiencies from 2013 to 2019 related to resident care, medication storage, and admissions standards.
What does this home offer?
No pets allowed
Building Type: Single-story
Fitness and Recreation
Activities in this home
- Arts and Crafts
- Exercise Classes
- Games & Cards
- Shopping
- Social Events & Outings
- Theater & Movies
Places of interest near The Opal at Bluewater Bay
![]() 5.1 miles from city center
5.1 miles from city center
![]() Estimated distance in miles from Niceville's city center to The Opal at Bluewater Bay's address, calculated via Google Maps.
Estimated distance in miles from Niceville's city center to The Opal at Bluewater Bay's address, calculated via Google Maps.
Calculate Travel Distance to The Opal at Bluewater Bay
Add your location
Financial Assistance for
Assisted Living in Florida
The Opal at Bluewater Bay is located in Niceville, Florida.
Here are the financial assistance programs available to residents in Florida.
Frequently Asked Questions about The Opal at Bluewater Bay
What neighborhood is The Opal at Bluewater Bay in?
The Opal at Bluewater Bay is in the Bluewater Bay neighborhood of Niceville.
What languages are spoken at The Opal at Bluewater Bay?
The team at The Opal at Bluewater Bay speaks English.
Who is the owner of The Opal at Bluewater Bay?
The Opal at Bluewater Bay is legally operated by Niceville OSL Property, LLC, and administered by Barbara Scheurer.
Is The Opal at Bluewater Bay in a walkable area?
The Opal at Bluewater Bay has a walk score of 55. Moderately walkable. Some errands can be accomplished on foot, with a mix of nearby amenities.
What is the license number of The Opal at Bluewater Bay?
According to FL state health department records, The Opal at Bluewater Bay's license number is 9189.
Are pets allowed at The Opal at Bluewater Bay?
No, The Opal at Bluewater Bay has a no-pet policy.
What payment types does The Opal at Bluewater Bay accept?
The Opal at Bluewater Bay accepts Insurance and/or HMO, Other, and VA.
Guides for Better Senior Living
Care Cost Calculator: See Prices in Your Area
Nursing Home Data Explorer
Don’t Wait Too Long: 7 Red Flag Signs Your Parent Needs Assisted Living Now
The True Cost of Assisted Living in 2025 – And How Families Are Paying For It
Understanding Senior Living Costs: Pricing Models, Discounts & Financial Assistance
Updated on
