


Compare Independent Living around Silver Spring
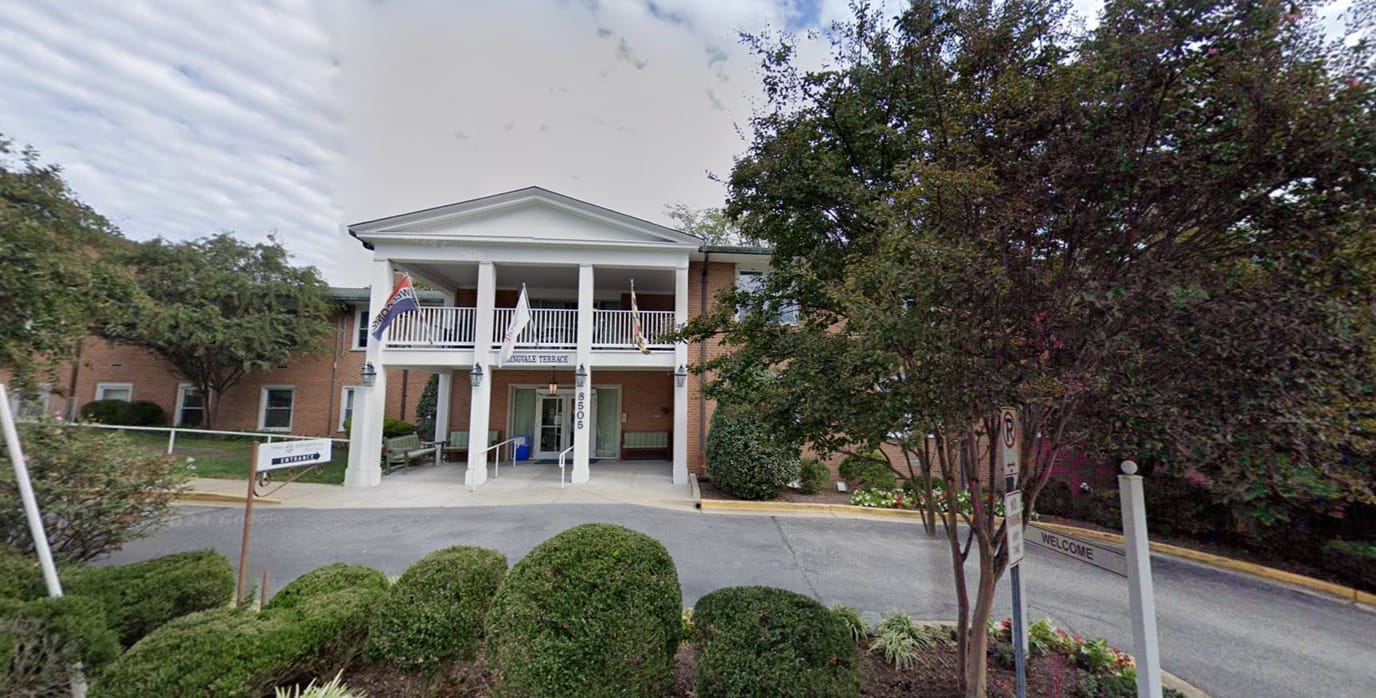
| Bedford Court, a CCRC | IL AL HOS MC NH RC SNF | Silver Spring (International Drive) | 76
Facility
76
MD AVG
43
Rank
#179 / 690 | Yes |
64
Facility
64
MD AVG
43
Rank
#261 / 985 | Studio / 1 Bed | 34
Facility
34
MD AVG
21
Rank
#22 / 210 |
15% Male Residents — State Benchmarked 15% of residents are male, compared to the Maryland average of 31%. This facility caters to a majority female resident pool (85% female), consistent with the broader assisted living trend where women significantly outnumber men. |
85% Female Residents — State Benchmarked 85% of residents are female, compared to the Maryland average of 69%. Women comprise the large majority, consistent with national assisted living demographics where women live longer and enter care facilities at higher rates. |
95% White Residents — State Benchmarked 95% of residents are reported as White, compared to the Maryland average of 81%. A higher White share than is typical for assisted living in Maryland in this dataset — compare with peer facilities for local context. |
3% African American Residents — State Benchmarked 3% of residents are reported as African American or Black, compared to the Maryland average of 13%. A lower African American share than is typical in Maryland; local markets still vary widely. |
2% Other Ethnicity Residents — State Benchmarked 2% of residents fall into categories other than White or African American (combined), compared to the Maryland average of 6%. This column aggregates Hispanic, Asian, multiracial, and any other labeled groups that are not classified as White or African American. Reported subgroups in this total: Asian (2%). |
2% Residents Age 65–74 — State Benchmarked 2% of residents are 65–74, compared to the Maryland average of 13%. Fewer younger seniors suggests the resident population skews older, likely requiring higher acuity care and more hands-on support. |
8% Residents Age 75–84 — State Benchmarked 8% of residents are 75–84, compared to the Maryland average of 31%. Below the state norm — the resident mix may skew either younger or older than this typical middle bracket. |
65% Residents Age 85–94 — State Benchmarked 65% of residents are 85–94, compared to the Maryland average of 44%. A high concentration of very elderly residents signals a higher-acuity facility with experience caring for advanced age-related needs. |
26% Residents Age 95+ — State Benchmarked 26% of residents are 95 or older, compared to the Maryland average of 16%. A high proportion of the oldest-old suggests strong end-of-life care experience and very-high-acuity capabilities. |
| Bedford Court | IL AL HOS MC NH RC SNF | Silver Spring (International Drive) | 76
Facility
76
MD AVG
43
Rank
#179 / 690 | Yes |
66
Facility
66
MD AVG
43
Rank
#240 / 985 | Studio / 1 Bed / 2 Bed | 34
Facility
34
MD AVG
21
Rank
#22 / 210 |
15% Male Residents — State Benchmarked 15% of residents are male, compared to the Maryland average of 31%. This facility caters to a majority female resident pool (85% female), consistent with the broader assisted living trend where women significantly outnumber men. |
85% Female Residents — State Benchmarked 85% of residents are female, compared to the Maryland average of 69%. Women comprise the large majority, consistent with national assisted living demographics where women live longer and enter care facilities at higher rates. |
95% White Residents — State Benchmarked 95% of residents are reported as White, compared to the Maryland average of 81%. A higher White share than is typical for assisted living in Maryland in this dataset — compare with peer facilities for local context. |
3% African American Residents — State Benchmarked 3% of residents are reported as African American or Black, compared to the Maryland average of 13%. A lower African American share than is typical in Maryland; local markets still vary widely. |
2% Other Ethnicity Residents — State Benchmarked 2% of residents fall into categories other than White or African American (combined), compared to the Maryland average of 6%. This column aggregates Hispanic, Asian, multiracial, and any other labeled groups that are not classified as White or African American. Reported subgroups in this total: Asian (2%). |
2% Residents Age 65–74 — State Benchmarked 2% of residents are 65–74, compared to the Maryland average of 13%. Fewer younger seniors suggests the resident population skews older, likely requiring higher acuity care and more hands-on support. |
8% Residents Age 75–84 — State Benchmarked 8% of residents are 75–84, compared to the Maryland average of 31%. Below the state norm — the resident mix may skew either younger or older than this typical middle bracket. |
65% Residents Age 85–94 — State Benchmarked 65% of residents are 85–94, compared to the Maryland average of 44%. A high concentration of very elderly residents signals a higher-acuity facility with experience caring for advanced age-related needs. |
26% Residents Age 95+ — State Benchmarked 26% of residents are 95 or older, compared to the Maryland average of 16%. A high proportion of the oldest-old suggests strong end-of-life care experience and very-high-acuity capabilities. |
| Riderwood Village | IL AL MC | Silver Spring | 275
Facility
275
MD AVG
43
Rank
#3 / 690 | No |
33
Facility
33
MD AVG
43
Rank
#597 / 985 | - | 23
Facility
23
MD AVG
21
Rank
#101 / 210 |
29% Male Residents — State Benchmarked 29% of residents are male, compared to the Maryland average of 31%. This facility caters to a majority female resident pool (71% female), consistent with the broader assisted living trend where women significantly outnumber men. |
71% Female Residents — State Benchmarked 71% of residents are female, compared to the Maryland average of 69%. Women comprise the large majority, consistent with national assisted living demographics where women live longer and enter care facilities at higher rates. |
89% White Residents — State Benchmarked 89% of residents are reported as White, compared to the Maryland average of 81%. Close to the average for this category among assisted living facilities in Maryland with reported race/ethnicity data. |
7% African American Residents — State Benchmarked 7% of residents are reported as African American or Black, compared to the Maryland average of 13%. In line with the Maryland average for African American residents among facilities reporting this breakdown. |
4% Other Ethnicity Residents — State Benchmarked 4% of residents fall into categories other than White or African American (combined), compared to the Maryland average of 6%. This column aggregates Hispanic, Asian, multiracial, and any other labeled groups that are not classified as White or African American. Reported subgroups in this total: Asian (3%), Hispanic (0%). |
2% Residents Age 65–74 — State Benchmarked 2% of residents are 65–74, compared to the Maryland average of 13%. Fewer younger seniors suggests the resident population skews older, likely requiring higher acuity care and more hands-on support. |
23% Residents Age 75–84 — State Benchmarked 23% of residents are 75–84, compared to the Maryland average of 31%. Below the state norm — the resident mix may skew either younger or older than this typical middle bracket. |
52% Residents Age 85–94 — State Benchmarked 52% of residents are 85–94, compared to the Maryland average of 44%. A high concentration of very elderly residents signals a higher-acuity facility with experience caring for advanced age-related needs. |
23% Residents Age 95+ — State Benchmarked 23% of residents are 95 or older, compared to the Maryland average of 16%. A high proportion of the oldest-old suggests strong end-of-life care experience and very-high-acuity capabilities. |
| The Bonifant at Silver Spring | IL | Silver Spring (Downtown Silver Spring) | - | Yes |
100
Facility
100
MD AVG
43
Rank
#1 / 985 | Studio / 1 Bed / 2 Bed | - | - | - | - | - | - | - | - | - | - |
| Brightview Crofton Riverwalk | IL AL MC | Crofton | 92
Facility
92
MD AVG
43
Rank
#151 / 690 | Yes |
45
Facility
45
MD AVG
43
Rank
#475 / 985 | Studio / 1 Bed / 2 Bed | 6
Facility
6
MD AVG
21
Rank
#178 / 210 |
27% Male Residents — State Benchmarked 27% of residents are male, compared to the Maryland average of 31%. This facility caters to a majority female resident pool (73% female), consistent with the broader assisted living trend where women significantly outnumber men. |
73% Female Residents — State Benchmarked 73% of residents are female, compared to the Maryland average of 69%. Women comprise the large majority, consistent with national assisted living demographics where women live longer and enter care facilities at higher rates. |
0% White Residents — State Benchmarked 0% of residents are reported as White, compared to the Maryland average of 81%. A lower White share than the Maryland average — the community may draw a more diverse resident mix relative to other facilities in Maryland. |
0% African American Residents — State Benchmarked 0% of residents are reported as African American or Black, compared to the Maryland average of 13%. A lower African American share than is typical in Maryland; local markets still vary widely. |
100% Other Ethnicity Residents — State Benchmarked 100% of residents fall into categories other than White or African American (combined), compared to the Maryland average of 6%. This column aggregates Hispanic, Asian, multiracial, and any other labeled groups that are not classified as White or African American. Reported subgroups in this total: Other (100%). | - | - | - | - |
| Seaton Silver Spring | IL AL | Silver Spring (Homecrest Road) | 55
Facility
55
MD AVG
43
Rank
#213 / 690 | Yes |
33
Facility
33
MD AVG
43
Rank
#597 / 985 | 1 Bed / 2 Bed | 36
Facility
36
MD AVG
21
Rank
#16 / 210 |
15% Male Residents — State Benchmarked 15% of residents are male, compared to the Maryland average of 31%. This facility caters to a majority female resident pool (85% female), consistent with the broader assisted living trend where women significantly outnumber men. |
85% Female Residents — State Benchmarked 85% of residents are female, compared to the Maryland average of 69%. Women comprise the large majority, consistent with national assisted living demographics where women live longer and enter care facilities at higher rates. |
79% White Residents — State Benchmarked 79% of residents are reported as White, compared to the Maryland average of 81%. Close to the average for this category among assisted living facilities in Maryland with reported race/ethnicity data. |
21% African American Residents — State Benchmarked 21% of residents are reported as African American or Black, compared to the Maryland average of 13%. A higher African American share than the typical Maryland average — useful context when comparing cultural fit and community composition. |
0% Other Ethnicity Residents — State Benchmarked 0% of residents fall into categories other than White or African American (combined), compared to the Maryland average of 6%. This column aggregates Hispanic, Asian, multiracial, and any other labeled groups that are not classified as White or African American. |
9% Residents Age 65–74 — State Benchmarked 9% of residents are 65–74, compared to the Maryland average of 13%. Fewer younger seniors suggests the resident population skews older, likely requiring higher acuity care and more hands-on support. |
21% Residents Age 75–84 — State Benchmarked 21% of residents are 75–84, compared to the Maryland average of 31%. Below the state norm — the resident mix may skew either younger or older than this typical middle bracket. |
38% Residents Age 85–94 — State Benchmarked 38% of residents are 85–94, compared to the Maryland average of 44%. The population here skews younger than the statewide norm, which may indicate a more active, lower-acuity community. |
32% Residents Age 95+ — State Benchmarked 32% of residents are 95 or older, compared to the Maryland average of 16%. A high proportion of the oldest-old suggests strong end-of-life care experience and very-high-acuity capabilities. |
| The Leggett | IL | Silver Spring (Downtown Silver Spring) | - | Yes |
82
Facility
82
MD AVG
43
Rank
#78 / 985 | 1 Bed | - | - | - | - | - | - | - | - | - | - |
| Kensington Park | IL AL MC | Kensington (Littledale Road) | - | Yes |
49
Facility
49
MD AVG
43
Rank
#431 / 985 | Private Rooms / Semi-Private Rooms | - | - | - | - | - | - | - | - | - | - |
| Wilshire Estates Gracious Retirement Community | IL | Silver Spring | - | Yes |
47
Facility
47
MD AVG
43
Rank
#459 / 985 | Studio / 1 Bed / 2 Bed | - | - | - | - | - | - | - | - | - | - |
| Hampshire Village | IL | Silver Spring | - | Yes |
24
Facility
24
MD AVG
43
Rank
#693 / 985 | 1 Bed / 2 Bed | - | - | - | - | - | - | - | - | - | - |
| Homecrest House | IL | Silver Spring | - | Yes |
8
Facility
8
MD AVG
43
Rank
#868 / 985 | Studio / 1 Bed | - | - | - | - | - | - | - | - | - | - |
| Seabury at Springvale Terrace | IL AL | Silver Spring (Springvale Road) | - | Yes |
92
Facility
92
MD AVG
43
Rank
#17 / 985 | Private Rooms | - | - | - | - | - | - | - | - | - | - |
| Arbor Crest of Silver Spring | IL | Silver Spring | - | Yes |
33
Facility
33
MD AVG
43
Rank
#597 / 985 | 1 Bed / 2 Bed | - | - | - | - | - | - | - | - | - | - |
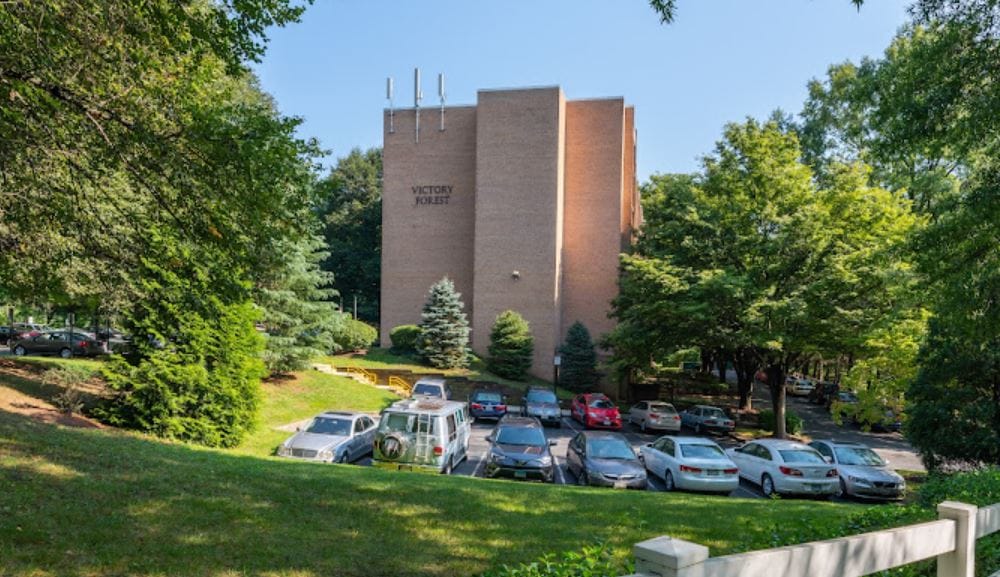
| Victory Forest | IL AL | Silver Spring (Forest Glen) | - | Yes |
33
Facility
33
MD AVG
43
Rank
#597 / 985 | 1 Bed | - | - | - | - | - | - | - | - | - | - |
| Serene Haven Care & Assisted Living | IL AL HOS RC | Silver Spring | - | No |
28
Facility
28
MD AVG
43
Rank
#659 / 985 | Studio, 1 Bed, Shared Room, 2 Beds, One Bedroom Suite | - | - | - | - | - | - | - | - | - | - |
| 3 RN's Supported LifeCare | — | Silver Spring | 4 | — | — | — | — | — | — | — | — | — | — | — | — | — |
| A Wellshire Manor Serenity Gardens Home - Arcola | — | Silver Spring | 5 | — | — | — | — | — | — | — | — | — | — | — | — | — |
| Abesha Home Care | — | Silver Spring | 2 | — | — | — | — | — | — | — | — | — | — | — | — | — |
| Acumen Care | — | Silver Spring | 5 | — | — | — | — | — | — | — | — | — | — | — | — | — |
| Advantage | — | Silver Spring | 8 | — | — | — | — | — | — | — | — | — | — | — | — | — |
| Adventist Behavioral Health Manor | — | Silver Spring | 16 | — | — | — | 25 | — | — | — | — | — | — | — | — | — |
| Allset Carevilla I | — | Silver Spring | 5 | — | — | — | — | — | — | — | — | — | — | — | — | — |
| An An Assisted Living | — | Silver Spring | 5 | — | — | — | — | — | — | — | — | — | — | — | — | — |
| Angels Garden II | — | Silver Spring | 8 | — | — | — | — | — | — | — | — | — | — | — | — | — |
| Angels Garden III | — | Silver Spring | 8 | — | — | — | — | — | — | — | — | — | — | — | — | — |
| Apple Blossoms II | — | Silver Spring | 5 | — | — | — | — | — | — | — | — | — | — | — | — | — |
| Arbor View Caring Home | — | Silver Spring | 5 | — | — | — | — | — | — | — | — | — | — | — | — | — |
| Assisted Living of Silver Spring | — | Silver Spring | 8 | — | — | — | — | — | — | — | — | — | — | — | — | — |
| Atrium Active Home | — | Silver Spring | 8 | — | — | — | — | — | — | — | — | — | — | — | — | — |
| Atrium Stonecrest Home | — | Silver Spring | 8 | — | — | — | — | — | — | — | — | — | — | — | — | — |
| Avonlea Ridge II | — | Silver Spring | 5 | — | — | — | — | — | — | — | — | — | — | — | — | — |
| Bliss Villa Elder Care II | — | Silver Spring | 5 | — | — | — | — | — | — | — | — | — | — | — | — | — |
| Blossom Haven | — | Silver Spring | 5 | — | — | — | — | — | — | — | — | — | — | — | — | — |
| Care For Me Home | — | Silver Spring | 5 | — | — | — | — | — | — | — | — | — | — | — | — | — |
| Care Personnel Healthcare | — | Silver Spring | 8 | — | — | — | — | — | — | — | — | — | — | — | — | — |
| Cedar Creek - Clifton Woods | — | Silver Spring | 8 | — | — | — | — | — | — | — | — | — | — | — | — | — |
| Cresthaven | — | Silver Spring | 8 | — | — | — | — | — | — | — | — | — | — | — | — | — |
| Elder Companion Home of Maryland II | — | Silver Spring | 8 | — | — | — | — | — | — | — | — | — | — | — | — | — |
| Embrasse Moi | — | Silver Spring | 5 | — | — | — | — | — | — | — | — | — | — | — | — | — |
| Fair Heart at Bainbridge | — | Silver Spring | 5 | — | — | — | — | — | — | — | — | — | — | — | — | — |
| Fair Heart at Cabinwood | — | Silver Spring | 5 | — | — | — | — | — | — | — | — | — | — | — | — | — |
| Fair Heart at Foxhall | — | Silver Spring | 5 | — | — | — | — | — | — | — | — | — | — | — | — | — |
| Good Hope Home Care | — | Silver Spring | 5 | — | — | — | — | — | — | — | — | — | — | — | — | — |
| Good Hope Home Care II | — | Silver Spring | 5 | — | — | — | — | — | — | — | — | — | — | — | — | — |
| Goshen Caring Hands | — | Silver Spring | 5 | — | — | — | — | — | — | — | — | — | — | — | — | — |
| Hands & Heart 2 | — | Silver Spring | 5 | — | — | — | — | — | — | — | — | — | — | — | — | — |
| Heart 2 Heart | — | Silver Spring | 5 | — | — | — | — | — | — | — | — | — | — | — | — | — |
| Hibiscus House | — | Silver Spring | 5 | — | — | — | — | — | — | — | — | — | — | — | — | — |
| Himalayan Elderly Care I | — | Silver Spring | 5 | — | — | — | — | — | — | — | — | — | — | — | — | — |
| Himalayan Elderly Care II | — | Silver Spring | 14 | — | — | — | 24 | — | — | — | — | — | — | — | — | — |
| Homecrest Assisted Living | — | Silver Spring | 8 | — | — | — | — | — | — | — | — | — | — | — | — | — |
| J'Rose II | — | Silver Spring | 5 | — | — | — | — | — | — | — | — | — | — | — | — | — |
| Jeya's | — | Silver Spring | 7 | — | — | — | — | — | — | — | — | — | — | — | — | — |
| JK House of Grace II | — | Silver Spring | 8 | — | — | — | — | — | — | — | — | — | — | — | — | — |
| JK House of Grace III | — | Silver Spring | 8 | — | — | — | — | — | — | — | — | — | — | — | — | — |
| Joseph Home | — | Silver Spring | 8 | — | — | — | — | — | — | — | — | — | — | — | — | — |
| La Familia III | — | Silver Spring | 8 | — | — | — | — | — | — | — | — | — | — | — | — | — |
| Magnolia House | — | Silver Spring | 8 | — | — | — | — | — | — | — | — | — | — | — | — | — |
| Maryland Seniors | — | Silver Spring | 5 | — | — | — | — | — | — | — | — | — | — | — | — | — |
| Montgomery Eldercare III | — | Silver Spring | 5 | — | — | — | — | — | — | — | — | — | — | — | — | — |
| Montgomery Eldercare IV | — | Silver Spring | 5 | — | — | — | — | — | — | — | — | — | — | — | — | — |
| Necitas 2 - Eldrid | — | Silver Spring | 8 | — | — | — | — | — | — | — | — | — | — | — | — | — |
| Necitas 3 - Shaw | — | Silver Spring | 8 | — | — | — | — | — | — | — | — | — | — | — | — | — |
| Necitas 5 - Priscilla | — | Silver Spring | 5 | — | — | — | — | — | — | — | — | — | — | — | — | — |
| Necitas Home - Overton | — | Silver Spring | 8 | — | — | — | — | — | — | — | — | — | — | — | — | — |
| New Haven | — | Silver Spring | 8 | — | — | — | — | — | — | — | — | — | — | — | — | — |
| Nu-Life - Davan | — | Silver Spring | 5 | — | — | — | — | — | — | — | — | — | — | — | — | — |
| Nu-Life - Partridge | — | Silver Spring | 5 | — | — | — | — | — | — | — | — | — | — | — | — | — |
| Quality Spring | — | Silver Spring | 8 | — | — | — | — | — | — | — | — | — | — | — | — | — |
| Quality Spring 2 | — | Silver Spring | 5 | — | — | — | — | — | — | — | — | — | — | — | — | — |
| Rejuvenation I | — | Silver Spring | 8 | — | — | — | — | — | — | — | — | — | — | — | — | — |
| Rose Garden Residence | — | Silver Spring | 8 | — | — | — | — | — | — | — | — | — | — | — | — | — |
| Royals Assisted Living | — | Silver Spring | 5 | — | — | — | — | — | — | — | — | — | — | — | — | — |
| Serene Haven Care at Vintage Place | — | Silver Spring | 5 | — | — | — | — | — | — | — | — | — | — | — | — | — |
| Serenity Gardens - Silver Spring | — | Silver Spring | 8 | — | — | — | — | — | — | — | — | — | — | — | — | — |
| Shanandale | — | Silver Spring | 5 | — | — | — | — | — | — | — | — | — | — | — | — | — |
| Silver Spring | — | Silver Spring | 8 | — | — | — | — | — | — | — | — | — | — | — | — | — |
| Summerwood Garden | — | Silver Spring | 8 | — | — | — | — | — | — | — | — | — | — | — | — | — |
| Sunnyside Manor - Silver Spring | — | Silver Spring | 5 | — | — | — | — | — | — | — | — | — | — | — | — | — |
| Surehealth of Silver Spring II | — | Silver Spring | 5 | — | — | — | — | — | — | — | — | — | — | — | — | — |
| Sweetbriar Hills Home | — | Silver Spring | 5 | — | — | — | — | — | — | — | — | — | — | — | — | — |
| Veeceen Place | — | Silver Spring | 5 | — | — | — | — | — | — | — | — | — | — | — | — | — |
| Woodridge Place | — | Silver Spring | 2 | — | — | — | — | — | — | — | — | — | — | — | — | — |
Rows per page:

View all Nearby Homes
Live a blissful retirement at Homecrest House-Stein & Moskowitz, a distinct community in Silver Spring, MD, offering independent living. With cozy and well-thought-out accommodations, the nhunity ensures residents are comfortable and safe. A hassle-free living is also guaranteed, with plenty of convenient apartment features and maintenance services.
A jam-packed calendar of exciting events and fun recreational programs is conducted, encouraging residents to live actively and maintain social connections. Residents also enjoy delightful and healthy meals with various dining options available to meet their dietary needs and preferences. The community is equipped with a beauty salon, a computer lab, a library, a fitness center, an arts room, scenic gardens, and serene walking paths, creating the ideal setting for residents to thrive in their golden years.
Since 1924, Seabury at Springvale Terrace has been part of the Springvale Road neighborhood in Silver Spring, Maryland, giving it a longer history than most senior living communities in the area. The two-story building is among the most walkable pockets of Silver Spring, with a Walk Score of 92 that puts daily errands within easy reach on foot. It’s also close to the town center, less than a mile away, so it’s convenient for visiting families.
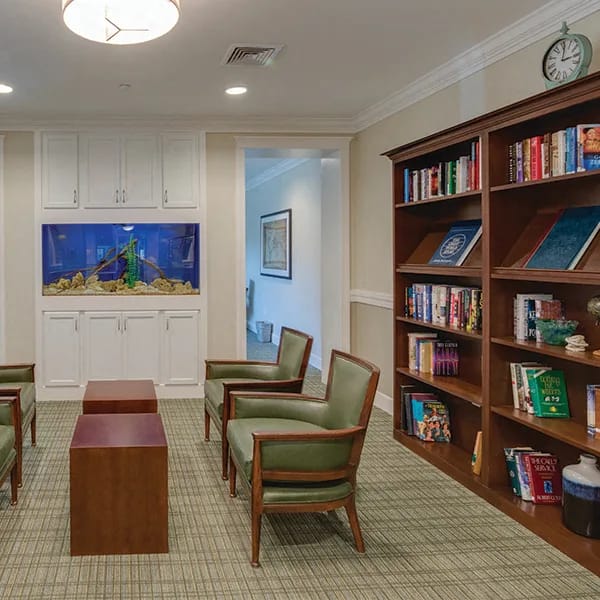
Occupants live in private rooms and can access a library, a TV lounge, a hair salon, and a wellness center. The community offers transportation services along with fitness and recreation space, and it welcomes pets. Dining is built to handle an array of dietary needs, so residents with specific requirements have options at mealtime. The home is set apart by its programming for specific communities: it offers explicit programming for LGBTQIA+ occupants and older adults with visual impairments. Many senior living communities don’t formally address either group, worth noting for families where that kind of tailored support is prioritized.
Families should confirm directly with Seabury at Springvale Terrace what level of everyday support is available.
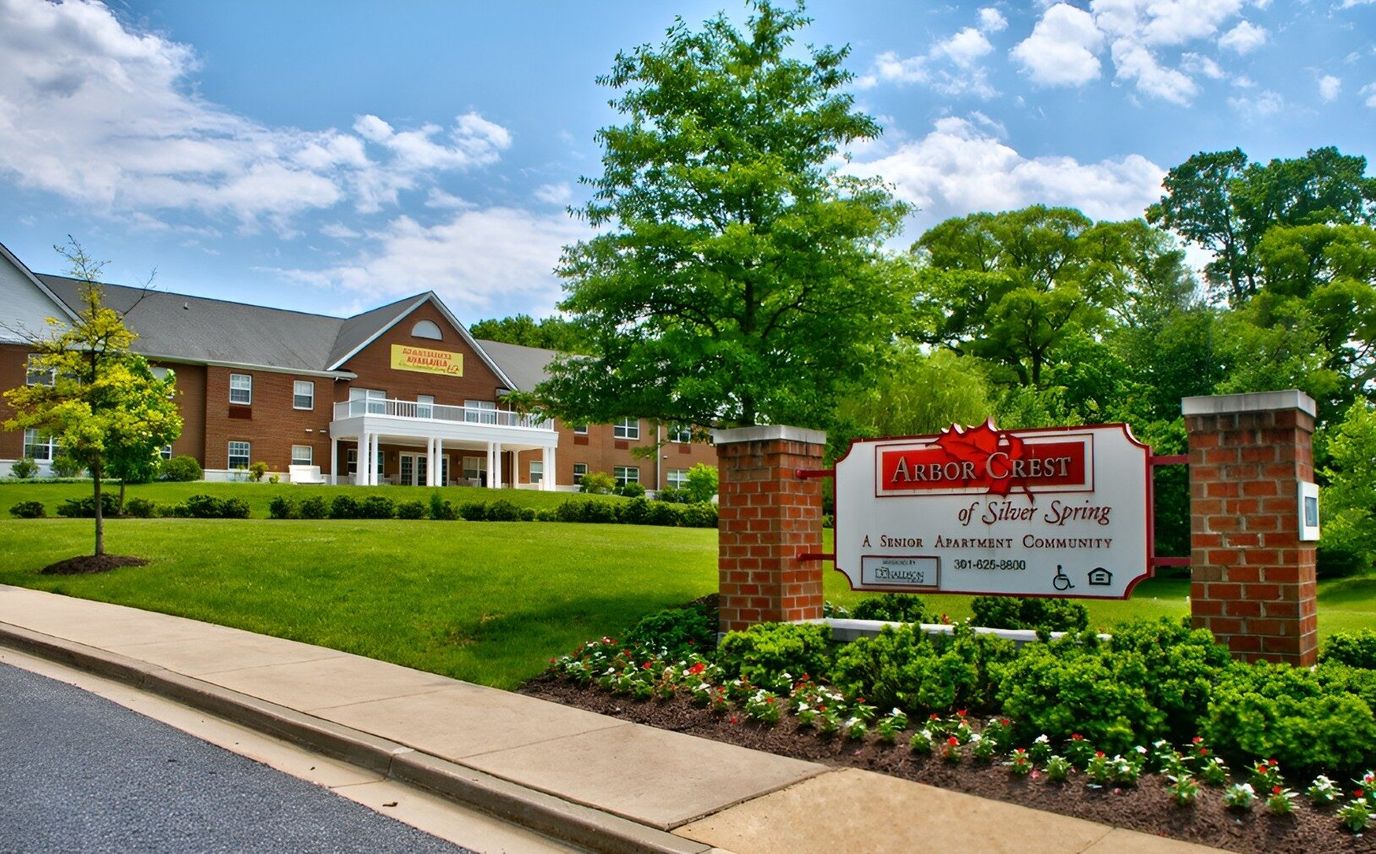
Overview of Arbor Crest of Silver Spring


Make every moment of your retirement count at Arbor Crest of Silver Spring, a distinct community in Silver Spring, MD, offering independent living. With cozy and thoughtfully designed one- and two-bedroom floor plans, those 62+ can rest assured of finding the accommodation that best matches their preferences. Residents enjoy a hassle-free living with plenty of convenient apartment features.
Thriving local shops and recreational spaces surround the area, providing endless leisure and wellness opportunities. Residents also enjoy various dining options with delightful restaurants nearby. A fitness center and a spacious courtyard are also available on-site, ensuring residents can interact with their surroundings. The community’s vibrant and welcoming environment makes it an enticing option, especially for those looking to downsize in retirement.
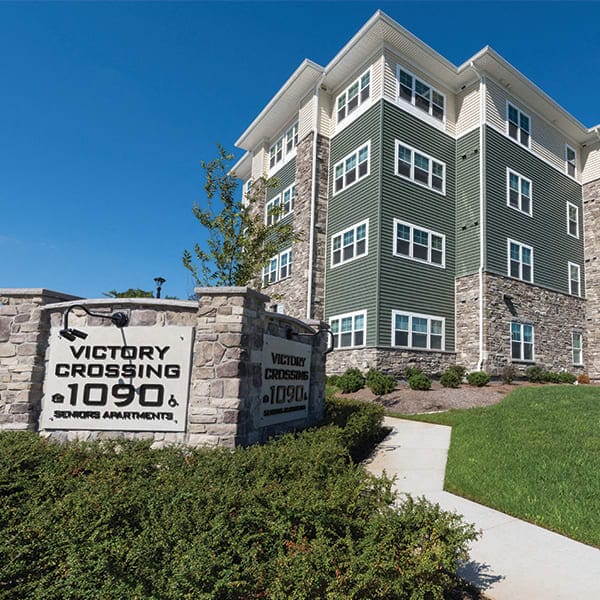
Victory Forest is a budget-friendly senior living community conveniently situated amidst the picturesque landscapes of Silver Spring, Maryland. Nestled within the Capital View neighborhood, Victory Forest presents a haven for those aged 62 and above, offering an array of engaging social events and activities that cater to diverse interests, ensuring an enriching and vibrant lifestyle. Victory Forest’s strategic location brings convenience to the doorstep, with shopping, dining, and entertainment options nearby, coupled with effortless access to major roadways and public transportation. Beyond affordable senior apartments, Victory Forest offers a superior way of life that doesn’t compromise quality.
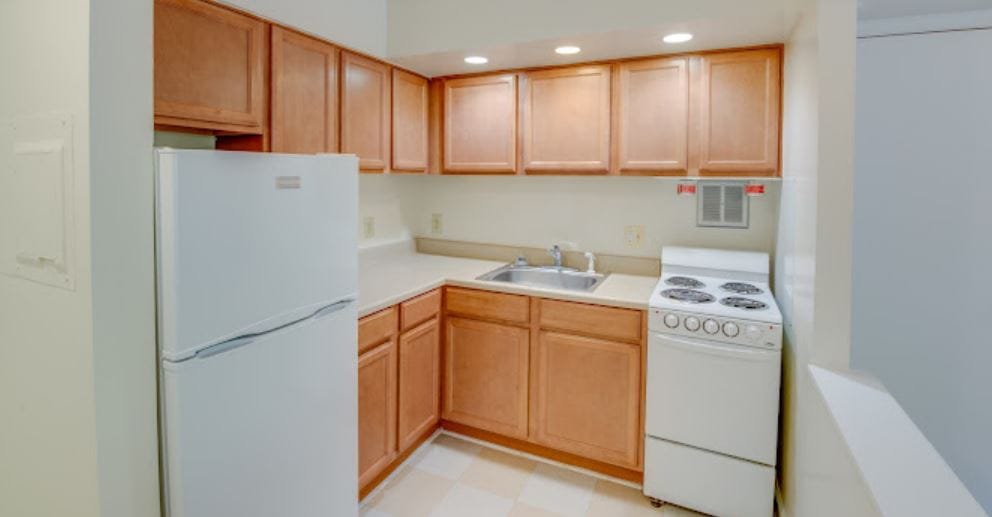
This assisted living community offers spacious apartment homes thoughtfully designed to accommodate every senior resident’s needs, complete with modern amenities. From fully-equipped kitchens to inviting living rooms featuring Juliet balconies, every detail has been considered to provide utmost comfort. Generously appointed with wall-to-wall carpeting, ample closet space, and medical emergency pull cords, these one-bedroom homes offer both convenience and peace of mind. The landscaped surroundings of Victory Forest blend seamlessly with the residential ambiance, featuring a terrace where residents can unwind, barbecue, and soak in the serene atmosphere. Wheelchair accessibility further ensures inclusivity and convenience for all. Experience a high-caliber lifestyle that fits within the budget at Victory Forest.
Overview of Serene Haven Care & Assisted Living

Located in Silver Spring, Maryland, Serene Haven Care & Assisted Living is a warm and cozy 5-bed assisted living home. This facility is dedicated to providing residents with a loving, secure, and homelike environment. They aim to ensure seniors and their loved ones receive the highest quality care and service. Senior residents also find spacious, tastefully decorated rooms and inviting public areas, creating a comfortable and welcoming atmosphere.
At Serene Haven, the dedicated team empowers residents to maintain their independence while offering compassionate support. The management team, led by Elsie Geffrard (RN, MSN, Delegating Nurse), Nathalie Felix (RN, BSN, Delegating Nurse), and Giles Charleston (Assisted Living Manager), brings decades of clinical and operational experience to ensure excellent care and service delivery. With seasoned nurses like Elsie and Nathalie, who have extensive experience in bedside and hospital care, community health, case management, and patient home care, complemented by Giles’ operational management expertise, Serene Haven Care & Assisted Living provides a haven where seniors can thrive and find comfort in their golden years.
Sunny Side Manor Communities II is an assisted living community in Silver Spring, MD, offering personal care. With a comfortable, home-like setting, the community ensures older adults experience the utmost comfort and safety. Residents can also maintain their independence with exceptional services, including housekeeping, nutritious meals, and recreational activities. The community also works closely with residents to provide the best possible care for their unique needs and habits.
Games, social events, and fitness programs ensure residents can explore hobbies and have fun. Residents can also rest and move around comfortably in cozy communal areas and spacious rooms. With a seamless combination of urban convenience and suburban charm, residents have quick access to necessities and leisure. This assisted living community is a great choice for senior living in Maryland, especially with its commitment to helping older adults thrive in their later years.
Ranking Methodology
How we rank these independent living communities
Every community above is evaluated across six weighted categories using public data including state inspection records, review platforms, BBB profiles, and operator-published materials.
Weighting overview
- 35%Resident Experience
- 25%Regulatory
- 15%Visual Media
- 10%Website
- 10%Stability
- 5%Environment
01
Resident & Family Experience 35%
The single largest share of every ranking. Aggregated review sentiment and volume from major platforms — the closest signal to real resident experience.
- Includes
- Review Sentiment
- Review Volume
02
Regulatory & Safety Record 25%
State inspection records, citations, and complaint visits. We weight per-inspection rates more heavily than raw counts.
- Includes
- State Inspections
- Citations/Inspection
- % Inspections w/ Citations
- Complaint Visits
- Accreditations
- BBB Rating
03
Visual Media & Transparency 15%
Communities that publish high-quality visuals give families a real preview. No photos or tours = a negative transparency signal.
- Includes
- Video Tours
- Virtual Walkthroughs
- Photo Quantity
- Photo Quality
04
Website & Operator Transparency 10%
Site quality and whether the operator publishes basic accountability information — staff names, contact details, ownership.
- Includes
- Website Content
- Mobile Usability
- Staff Info Available
- Owner Info Available
05
Community Stability 10%
Operational signals indicating whether a community is well-run and meeting demand.
- Includes
- Occupancy Rate
- Bed Options
06
Environment & Pricing 5%
Walkability and pricing transparency. Walk Score is weighted higher for Independent Living than for Memory Care, where most residents do not leave unaccompanied.
- Includes
- Walk Score
- Pricing Transparency
Who we are
Your Senior Care Partner, Every Step of the Way
We help families find affordable senior communities and unlock same day discounts, Medicaid, and Medicare options tailored to your needs.
Contact us Today
Frequently Asked Questions about Independent Living in Silver Spring, MD
What is the average cost of independent living in Silver Spring, MD?
The average monthly cost of independent living in Silver Spring, MD is approximately $1,870. Actual rates vary by community, level of care, and floorplan.
What is the price range for independent living in Silver Spring, MD?
Independent living in Silver Spring, MD typically ranges from $495 - $4,840 per month, depending on the community, room type, and care needs.
What is independent living?
Independent living communities are residential settings for active older adults — typically with private apartments or cottages, shared amenities (dining, fitness, activities), and no built-in medical care.
How many independent living communities are listed on this page?
This page features 16 independent living communities in Silver Spring, MD. Use the filters and comparison tools above to compare ratings, amenities, and pricing.
How do I choose the right independent living community in Silver Spring, MD?
Start by matching the level of care offered to the resident's current and anticipated needs, then compare licensing status, staff-to-resident ratios, recent inspection results, and pricing. Tour at least two or three communities in Silver Spring, MD, talk to current residents and families, and confirm what is included in the base rate versus billed as add-on services.
What should I look for when visiting independent living communities in Silver Spring, MD?
Pay attention to staff interactions with residents, cleanliness and odor, food quality at meal times, the activity calendar, and how questions about pricing and care plans are answered. Ask to see the most recent state inspection report, the move-out / level-of-care-change policy, and a sample monthly bill that lists every fee.
Updated on
