


Compare Independent Living around Silver Spring
| Bedford Court, a CCRC | IL AL HOS MC NH RC SNF | Silver Spring (International Drive) | 76
Facility
76
MD AVG
43
Rank
#179 / 690 | Yes |
64
Facility
64
MD AVG
43
Rank
#261 / 985 | Studio / 1 Bed | 34
Facility
34
MD AVG
21
Rank
#22 / 210 |
15% Male Residents — State Benchmarked 15% of residents are male, compared to the Maryland average of 31%. This facility caters to a majority female resident pool (85% female), consistent with the broader assisted living trend where women significantly outnumber men. |
85% Female Residents — State Benchmarked 85% of residents are female, compared to the Maryland average of 69%. Women comprise the large majority, consistent with national assisted living demographics where women live longer and enter care facilities at higher rates. |
95% White Residents — State Benchmarked 95% of residents are reported as White, compared to the Maryland average of 81%. A higher White share than is typical for assisted living in Maryland in this dataset — compare with peer facilities for local context. |
3% African American Residents — State Benchmarked 3% of residents are reported as African American or Black, compared to the Maryland average of 13%. A lower African American share than is typical in Maryland; local markets still vary widely. |
2% Other Ethnicity Residents — State Benchmarked 2% of residents fall into categories other than White or African American (combined), compared to the Maryland average of 6%. This column aggregates Hispanic, Asian, multiracial, and any other labeled groups that are not classified as White or African American. Reported subgroups in this total: Asian (2%). |
2% Residents Age 65–74 — State Benchmarked 2% of residents are 65–74, compared to the Maryland average of 13%. Fewer younger seniors suggests the resident population skews older, likely requiring higher acuity care and more hands-on support. |
8% Residents Age 75–84 — State Benchmarked 8% of residents are 75–84, compared to the Maryland average of 31%. Below the state norm — the resident mix may skew either younger or older than this typical middle bracket. |
65% Residents Age 85–94 — State Benchmarked 65% of residents are 85–94, compared to the Maryland average of 44%. A high concentration of very elderly residents signals a higher-acuity facility with experience caring for advanced age-related needs. |
26% Residents Age 95+ — State Benchmarked 26% of residents are 95 or older, compared to the Maryland average of 16%. A high proportion of the oldest-old suggests strong end-of-life care experience and very-high-acuity capabilities. |
| Bedford Court | IL AL HOS MC NH RC SNF | Silver Spring (International Drive) | 76
Facility
76
MD AVG
43
Rank
#179 / 690 | Yes |
66
Facility
66
MD AVG
43
Rank
#240 / 985 | Studio / 1 Bed / 2 Bed | 34
Facility
34
MD AVG
21
Rank
#22 / 210 |
15% Male Residents — State Benchmarked 15% of residents are male, compared to the Maryland average of 31%. This facility caters to a majority female resident pool (85% female), consistent with the broader assisted living trend where women significantly outnumber men. |
85% Female Residents — State Benchmarked 85% of residents are female, compared to the Maryland average of 69%. Women comprise the large majority, consistent with national assisted living demographics where women live longer and enter care facilities at higher rates. |
95% White Residents — State Benchmarked 95% of residents are reported as White, compared to the Maryland average of 81%. A higher White share than is typical for assisted living in Maryland in this dataset — compare with peer facilities for local context. |
3% African American Residents — State Benchmarked 3% of residents are reported as African American or Black, compared to the Maryland average of 13%. A lower African American share than is typical in Maryland; local markets still vary widely. |
2% Other Ethnicity Residents — State Benchmarked 2% of residents fall into categories other than White or African American (combined), compared to the Maryland average of 6%. This column aggregates Hispanic, Asian, multiracial, and any other labeled groups that are not classified as White or African American. Reported subgroups in this total: Asian (2%). |
2% Residents Age 65–74 — State Benchmarked 2% of residents are 65–74, compared to the Maryland average of 13%. Fewer younger seniors suggests the resident population skews older, likely requiring higher acuity care and more hands-on support. |
8% Residents Age 75–84 — State Benchmarked 8% of residents are 75–84, compared to the Maryland average of 31%. Below the state norm — the resident mix may skew either younger or older than this typical middle bracket. |
65% Residents Age 85–94 — State Benchmarked 65% of residents are 85–94, compared to the Maryland average of 44%. A high concentration of very elderly residents signals a higher-acuity facility with experience caring for advanced age-related needs. |
26% Residents Age 95+ — State Benchmarked 26% of residents are 95 or older, compared to the Maryland average of 16%. A high proportion of the oldest-old suggests strong end-of-life care experience and very-high-acuity capabilities. |
| Riderwood Village | IL AL MC | Silver Spring | 275
Facility
275
MD AVG
43
Rank
#3 / 690 | No |
33
Facility
33
MD AVG
43
Rank
#597 / 985 | - | 23
Facility
23
MD AVG
21
Rank
#101 / 210 |
29% Male Residents — State Benchmarked 29% of residents are male, compared to the Maryland average of 31%. This facility caters to a majority female resident pool (71% female), consistent with the broader assisted living trend where women significantly outnumber men. |
71% Female Residents — State Benchmarked 71% of residents are female, compared to the Maryland average of 69%. Women comprise the large majority, consistent with national assisted living demographics where women live longer and enter care facilities at higher rates. |
89% White Residents — State Benchmarked 89% of residents are reported as White, compared to the Maryland average of 81%. Close to the average for this category among assisted living facilities in Maryland with reported race/ethnicity data. |
7% African American Residents — State Benchmarked 7% of residents are reported as African American or Black, compared to the Maryland average of 13%. In line with the Maryland average for African American residents among facilities reporting this breakdown. |
4% Other Ethnicity Residents — State Benchmarked 4% of residents fall into categories other than White or African American (combined), compared to the Maryland average of 6%. This column aggregates Hispanic, Asian, multiracial, and any other labeled groups that are not classified as White or African American. Reported subgroups in this total: Asian (3%), Hispanic (0%). |
2% Residents Age 65–74 — State Benchmarked 2% of residents are 65–74, compared to the Maryland average of 13%. Fewer younger seniors suggests the resident population skews older, likely requiring higher acuity care and more hands-on support. |
23% Residents Age 75–84 — State Benchmarked 23% of residents are 75–84, compared to the Maryland average of 31%. Below the state norm — the resident mix may skew either younger or older than this typical middle bracket. |
52% Residents Age 85–94 — State Benchmarked 52% of residents are 85–94, compared to the Maryland average of 44%. A high concentration of very elderly residents signals a higher-acuity facility with experience caring for advanced age-related needs. |
23% Residents Age 95+ — State Benchmarked 23% of residents are 95 or older, compared to the Maryland average of 16%. A high proportion of the oldest-old suggests strong end-of-life care experience and very-high-acuity capabilities. |
| The Bonifant at Silver Spring | IL | Silver Spring (Downtown Silver Spring) | - | Yes |
100
Facility
100
MD AVG
43
Rank
#1 / 985 | Studio / 1 Bed / 2 Bed | - | - | - | - | - | - | - | - | - | - |
| Brightview Crofton Riverwalk | IL AL MC | Crofton | 92
Facility
92
MD AVG
43
Rank
#151 / 690 | Yes |
45
Facility
45
MD AVG
43
Rank
#475 / 985 | Studio / 1 Bed / 2 Bed | 6
Facility
6
MD AVG
21
Rank
#178 / 210 |
27% Male Residents — State Benchmarked 27% of residents are male, compared to the Maryland average of 31%. This facility caters to a majority female resident pool (73% female), consistent with the broader assisted living trend where women significantly outnumber men. |
73% Female Residents — State Benchmarked 73% of residents are female, compared to the Maryland average of 69%. Women comprise the large majority, consistent with national assisted living demographics where women live longer and enter care facilities at higher rates. |
0% White Residents — State Benchmarked 0% of residents are reported as White, compared to the Maryland average of 81%. A lower White share than the Maryland average — the community may draw a more diverse resident mix relative to other facilities in Maryland. |
0% African American Residents — State Benchmarked 0% of residents are reported as African American or Black, compared to the Maryland average of 13%. A lower African American share than is typical in Maryland; local markets still vary widely. |
100% Other Ethnicity Residents — State Benchmarked 100% of residents fall into categories other than White or African American (combined), compared to the Maryland average of 6%. This column aggregates Hispanic, Asian, multiracial, and any other labeled groups that are not classified as White or African American. Reported subgroups in this total: Other (100%). | - | - | - | - |
| Seaton Silver Spring | IL AL | Silver Spring (Homecrest Road) | 55
Facility
55
MD AVG
43
Rank
#213 / 690 | Yes |
33
Facility
33
MD AVG
43
Rank
#597 / 985 | 1 Bed / 2 Bed | 36
Facility
36
MD AVG
21
Rank
#16 / 210 |
15% Male Residents — State Benchmarked 15% of residents are male, compared to the Maryland average of 31%. This facility caters to a majority female resident pool (85% female), consistent with the broader assisted living trend where women significantly outnumber men. |
85% Female Residents — State Benchmarked 85% of residents are female, compared to the Maryland average of 69%. Women comprise the large majority, consistent with national assisted living demographics where women live longer and enter care facilities at higher rates. |
79% White Residents — State Benchmarked 79% of residents are reported as White, compared to the Maryland average of 81%. Close to the average for this category among assisted living facilities in Maryland with reported race/ethnicity data. |
21% African American Residents — State Benchmarked 21% of residents are reported as African American or Black, compared to the Maryland average of 13%. A higher African American share than the typical Maryland average — useful context when comparing cultural fit and community composition. |
0% Other Ethnicity Residents — State Benchmarked 0% of residents fall into categories other than White or African American (combined), compared to the Maryland average of 6%. This column aggregates Hispanic, Asian, multiracial, and any other labeled groups that are not classified as White or African American. |
9% Residents Age 65–74 — State Benchmarked 9% of residents are 65–74, compared to the Maryland average of 13%. Fewer younger seniors suggests the resident population skews older, likely requiring higher acuity care and more hands-on support. |
21% Residents Age 75–84 — State Benchmarked 21% of residents are 75–84, compared to the Maryland average of 31%. Below the state norm — the resident mix may skew either younger or older than this typical middle bracket. |
38% Residents Age 85–94 — State Benchmarked 38% of residents are 85–94, compared to the Maryland average of 44%. The population here skews younger than the statewide norm, which may indicate a more active, lower-acuity community. |
32% Residents Age 95+ — State Benchmarked 32% of residents are 95 or older, compared to the Maryland average of 16%. A high proportion of the oldest-old suggests strong end-of-life care experience and very-high-acuity capabilities. |
| The Leggett | IL | Silver Spring (Downtown Silver Spring) | - | Yes |
82
Facility
82
MD AVG
43
Rank
#78 / 985 | 1 Bed | - | - | - | - | - | - | - | - | - | - |
| Kensington Park | IL AL MC | Kensington (Littledale Road) | - | Yes |
49
Facility
49
MD AVG
43
Rank
#431 / 985 | Private Rooms / Semi-Private Rooms | - | - | - | - | - | - | - | - | - | - |
| Wilshire Estates Gracious Retirement Community | IL | Silver Spring | - | Yes |
47
Facility
47
MD AVG
43
Rank
#459 / 985 | Studio / 1 Bed / 2 Bed | - | - | - | - | - | - | - | - | - | - |
| Hampshire Village | IL | Silver Spring | - | Yes |
24
Facility
24
MD AVG
43
Rank
#693 / 985 | 1 Bed / 2 Bed | - | - | - | - | - | - | - | - | - | - |
| Homecrest House | IL | Silver Spring | - | Yes |
8
Facility
8
MD AVG
43
Rank
#868 / 985 | Studio / 1 Bed | - | - | - | - | - | - | - | - | - | - |
| Seabury at Springvale Terrace | IL AL | Silver Spring (Springvale Road) | - | Yes |
92
Facility
92
MD AVG
43
Rank
#17 / 985 | Private Rooms | - | - | - | - | - | - | - | - | - | - |
| Arbor Crest of Silver Spring | IL | Silver Spring | - | Yes |
33
Facility
33
MD AVG
43
Rank
#597 / 985 | 1 Bed / 2 Bed | - | - | - | - | - | - | - | - | - | - |
| Victory Forest | IL AL | Silver Spring (Forest Glen) | - | Yes |
33
Facility
33
MD AVG
43
Rank
#597 / 985 | 1 Bed | - | - | - | - | - | - | - | - | - | - |
| Serene Haven Care & Assisted Living | IL AL HOS RC | Silver Spring | - | No |
28
Facility
28
MD AVG
43
Rank
#659 / 985 | Studio, 1 Bed, Shared Room, 2 Beds, One Bedroom Suite | - | - | - | - | - | - | - | - | - | - |
| 3 RN's Supported LifeCare | — | Silver Spring | 4 | — | — | — | — | — | — | — | — | — | — | — | — | — |
| A Wellshire Manor Serenity Gardens Home - Arcola | — | Silver Spring | 5 | — | — | — | — | — | — | — | — | — | — | — | — | — |
| Abesha Home Care | — | Silver Spring | 2 | — | — | — | — | — | — | — | — | — | — | — | — | — |
| Acumen Care | — | Silver Spring | 5 | — | — | — | — | — | — | — | — | — | — | — | — | — |
| Advantage | — | Silver Spring | 8 | — | — | — | — | — | — | — | — | — | — | — | — | — |
| Adventist Behavioral Health Manor | — | Silver Spring | 16 | — | — | — | 25 | — | — | — | — | — | — | — | — | — |
| Allset Carevilla I | — | Silver Spring | 5 | — | — | — | — | — | — | — | — | — | — | — | — | — |
| An An Assisted Living | — | Silver Spring | 5 | — | — | — | — | — | — | — | — | — | — | — | — | — |
| Angels Garden II | — | Silver Spring | 8 | — | — | — | — | — | — | — | — | — | — | — | — | — |
| Angels Garden III | — | Silver Spring | 8 | — | — | — | — | — | — | — | — | — | — | — | — | — |
| Apple Blossoms II | — | Silver Spring | 5 | — | — | — | — | — | — | — | — | — | — | — | — | — |
| Arbor View Caring Home | — | Silver Spring | 5 | — | — | — | — | — | — | — | — | — | — | — | — | — |
| Assisted Living of Silver Spring | — | Silver Spring | 8 | — | — | — | — | — | — | — | — | — | — | — | — | — |
| Atrium Active Home | — | Silver Spring | 8 | — | — | — | — | — | — | — | — | — | — | — | — | — |
| Atrium Stonecrest Home | — | Silver Spring | 8 | — | — | — | — | — | — | — | — | — | — | — | — | — |
| Avonlea Ridge II | — | Silver Spring | 5 | — | — | — | — | — | — | — | — | — | — | — | — | — |
| Bliss Villa Elder Care II | — | Silver Spring | 5 | — | — | — | — | — | — | — | — | — | — | — | — | — |
| Blossom Haven | — | Silver Spring | 5 | — | — | — | — | — | — | — | — | — | — | — | — | — |
| Care For Me Home | — | Silver Spring | 5 | — | — | — | — | — | — | — | — | — | — | — | — | — |
| Care Personnel Healthcare | — | Silver Spring | 8 | — | — | — | — | — | — | — | — | — | — | — | — | — |
| Cedar Creek - Clifton Woods | — | Silver Spring | 8 | — | — | — | — | — | — | — | — | — | — | — | — | — |
| Cresthaven | — | Silver Spring | 8 | — | — | — | — | — | — | — | — | — | — | — | — | — |
| Elder Companion Home of Maryland II | — | Silver Spring | 8 | — | — | — | — | — | — | — | — | — | — | — | — | — |
| Embrasse Moi | — | Silver Spring | 5 | — | — | — | — | — | — | — | — | — | — | — | — | — |
| Fair Heart at Bainbridge | — | Silver Spring | 5 | — | — | — | — | — | — | — | — | — | — | — | — | — |
| Fair Heart at Cabinwood | — | Silver Spring | 5 | — | — | — | — | — | — | — | — | — | — | — | — | — |
| Fair Heart at Foxhall | — | Silver Spring | 5 | — | — | — | — | — | — | — | — | — | — | — | — | — |
| Good Hope Home Care | — | Silver Spring | 5 | — | — | — | — | — | — | — | — | — | — | — | — | — |
| Good Hope Home Care II | — | Silver Spring | 5 | — | — | — | — | — | — | — | — | — | — | — | — | — |
| Goshen Caring Hands | — | Silver Spring | 5 | — | — | — | — | — | — | — | — | — | — | — | — | — |
| Hands & Heart 2 | — | Silver Spring | 5 | — | — | — | — | — | — | — | — | — | — | — | — | — |
| Heart 2 Heart | — | Silver Spring | 5 | — | — | — | — | — | — | — | — | — | — | — | — | — |
| Hibiscus House | — | Silver Spring | 5 | — | — | — | — | — | — | — | — | — | — | — | — | — |
| Himalayan Elderly Care I | — | Silver Spring | 5 | — | — | — | — | — | — | — | — | — | — | — | — | — |
| Himalayan Elderly Care II | — | Silver Spring | 14 | — | — | — | 24 | — | — | — | — | — | — | — | — | — |
| Homecrest Assisted Living | — | Silver Spring | 8 | — | — | — | — | — | — | — | — | — | — | — | — | — |
| J'Rose II | — | Silver Spring | 5 | — | — | — | — | — | — | — | — | — | — | — | — | — |
| Jeya's | — | Silver Spring | 7 | — | — | — | — | — | — | — | — | — | — | — | — | — |
| JK House of Grace II | — | Silver Spring | 8 | — | — | — | — | — | — | — | — | — | — | — | — | — |
| JK House of Grace III | — | Silver Spring | 8 | — | — | — | — | — | — | — | — | — | — | — | — | — |
| Joseph Home | — | Silver Spring | 8 | — | — | — | — | — | — | — | — | — | — | — | — | — |
| La Familia III | — | Silver Spring | 8 | — | — | — | — | — | — | — | — | — | — | — | — | — |
| Magnolia House | — | Silver Spring | 8 | — | — | — | — | — | — | — | — | — | — | — | — | — |
| Maryland Seniors | — | Silver Spring | 5 | — | — | — | — | — | — | — | — | — | — | — | — | — |
| Montgomery Eldercare III | — | Silver Spring | 5 | — | — | — | — | — | — | — | — | — | — | — | — | — |
| Montgomery Eldercare IV | — | Silver Spring | 5 | — | — | — | — | — | — | — | — | — | — | — | — | — |
| Necitas 2 - Eldrid | — | Silver Spring | 8 | — | — | — | — | — | — | — | — | — | — | — | — | — |
| Necitas 3 - Shaw | — | Silver Spring | 8 | — | — | — | — | — | — | — | — | — | — | — | — | — |
| Necitas 5 - Priscilla | — | Silver Spring | 5 | — | — | — | — | — | — | — | — | — | — | — | — | — |
| Necitas Home - Overton | — | Silver Spring | 8 | — | — | — | — | — | — | — | — | — | — | — | — | — |
| New Haven | — | Silver Spring | 8 | — | — | — | — | — | — | — | — | — | — | — | — | — |
| Nu-Life - Davan | — | Silver Spring | 5 | — | — | — | — | — | — | — | — | — | — | — | — | — |
| Nu-Life - Partridge | — | Silver Spring | 5 | — | — | — | — | — | — | — | — | — | — | — | — | — |
| Quality Spring | — | Silver Spring | 8 | — | — | — | — | — | — | — | — | — | — | — | — | — |
| Quality Spring 2 | — | Silver Spring | 5 | — | — | — | — | — | — | — | — | — | — | — | — | — |
| Rejuvenation I | — | Silver Spring | 8 | — | — | — | — | — | — | — | — | — | — | — | — | — |
| Rose Garden Residence | — | Silver Spring | 8 | — | — | — | — | — | — | — | — | — | — | — | — | — |
| Royals Assisted Living | — | Silver Spring | 5 | — | — | — | — | — | — | — | — | — | — | — | — | — |
| Serene Haven Care at Vintage Place | — | Silver Spring | 5 | — | — | — | — | — | — | — | — | — | — | — | — | — |
| Serenity Gardens - Silver Spring | — | Silver Spring | 8 | — | — | — | — | — | — | — | — | — | — | — | — | — |
| Shanandale | — | Silver Spring | 5 | — | — | — | — | — | — | — | — | — | — | — | — | — |
| Silver Spring | — | Silver Spring | 8 | — | — | — | — | — | — | — | — | — | — | — | — | — |
| Summerwood Garden | — | Silver Spring | 8 | — | — | — | — | — | — | — | — | — | — | — | — | — |
| Sunnyside Manor - Silver Spring | — | Silver Spring | 5 | — | — | — | — | — | — | — | — | — | — | — | — | — |
| Surehealth of Silver Spring II | — | Silver Spring | 5 | — | — | — | — | — | — | — | — | — | — | — | — | — |
| Sweetbriar Hills Home | — | Silver Spring | 5 | — | — | — | — | — | — | — | — | — | — | — | — | — |
| Veeceen Place | — | Silver Spring | 5 | — | — | — | — | — | — | — | — | — | — | — | — | — |
| Woodridge Place | — | Silver Spring | 2 | — | — | — | — | — | — | — | — | — | — | — | — | — |
Rows per page:

View all Nearby Homes
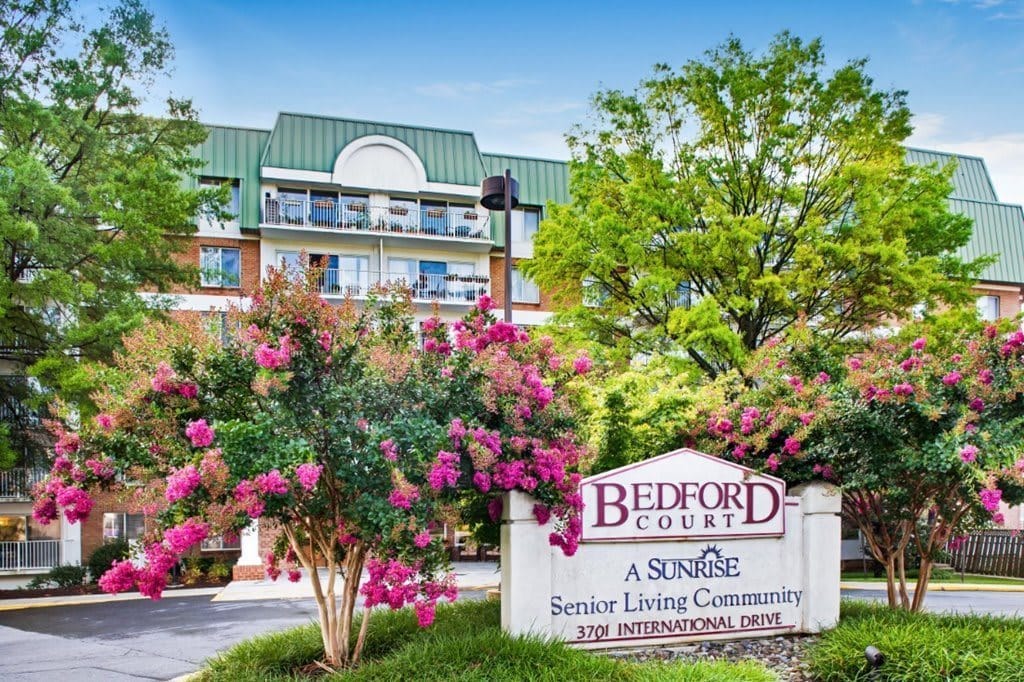
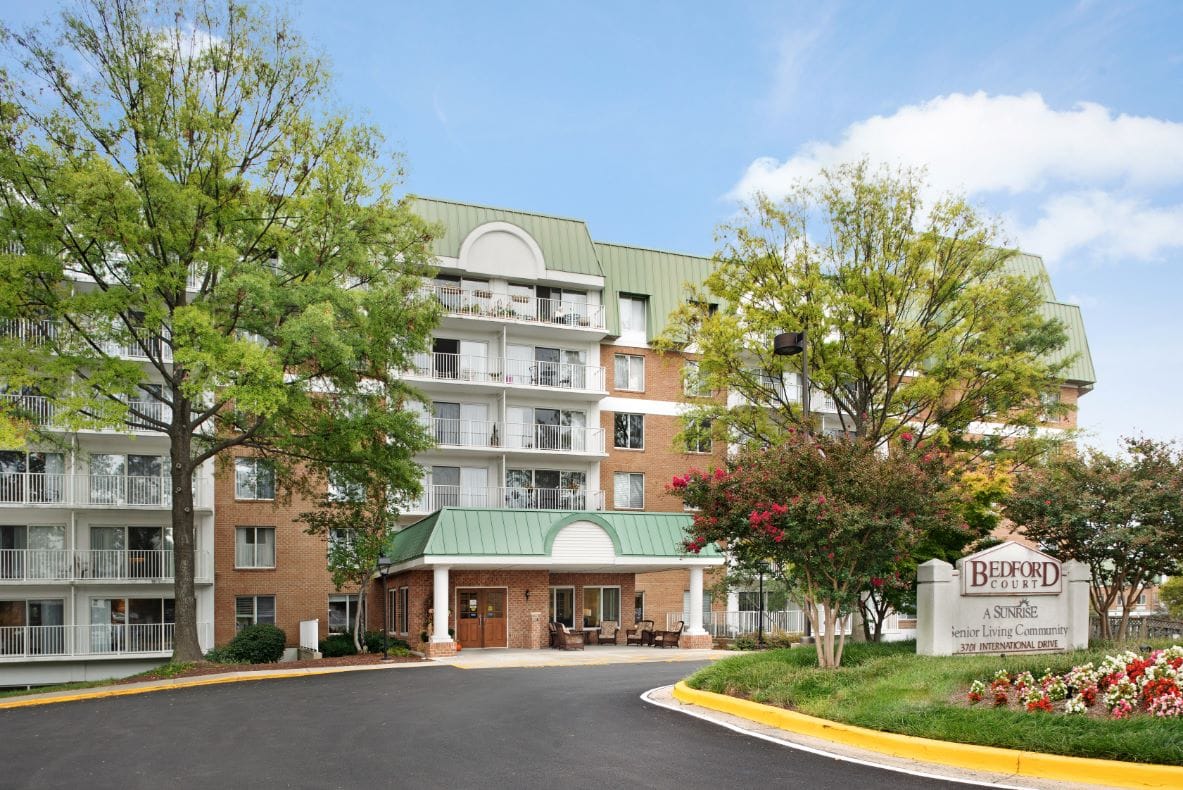
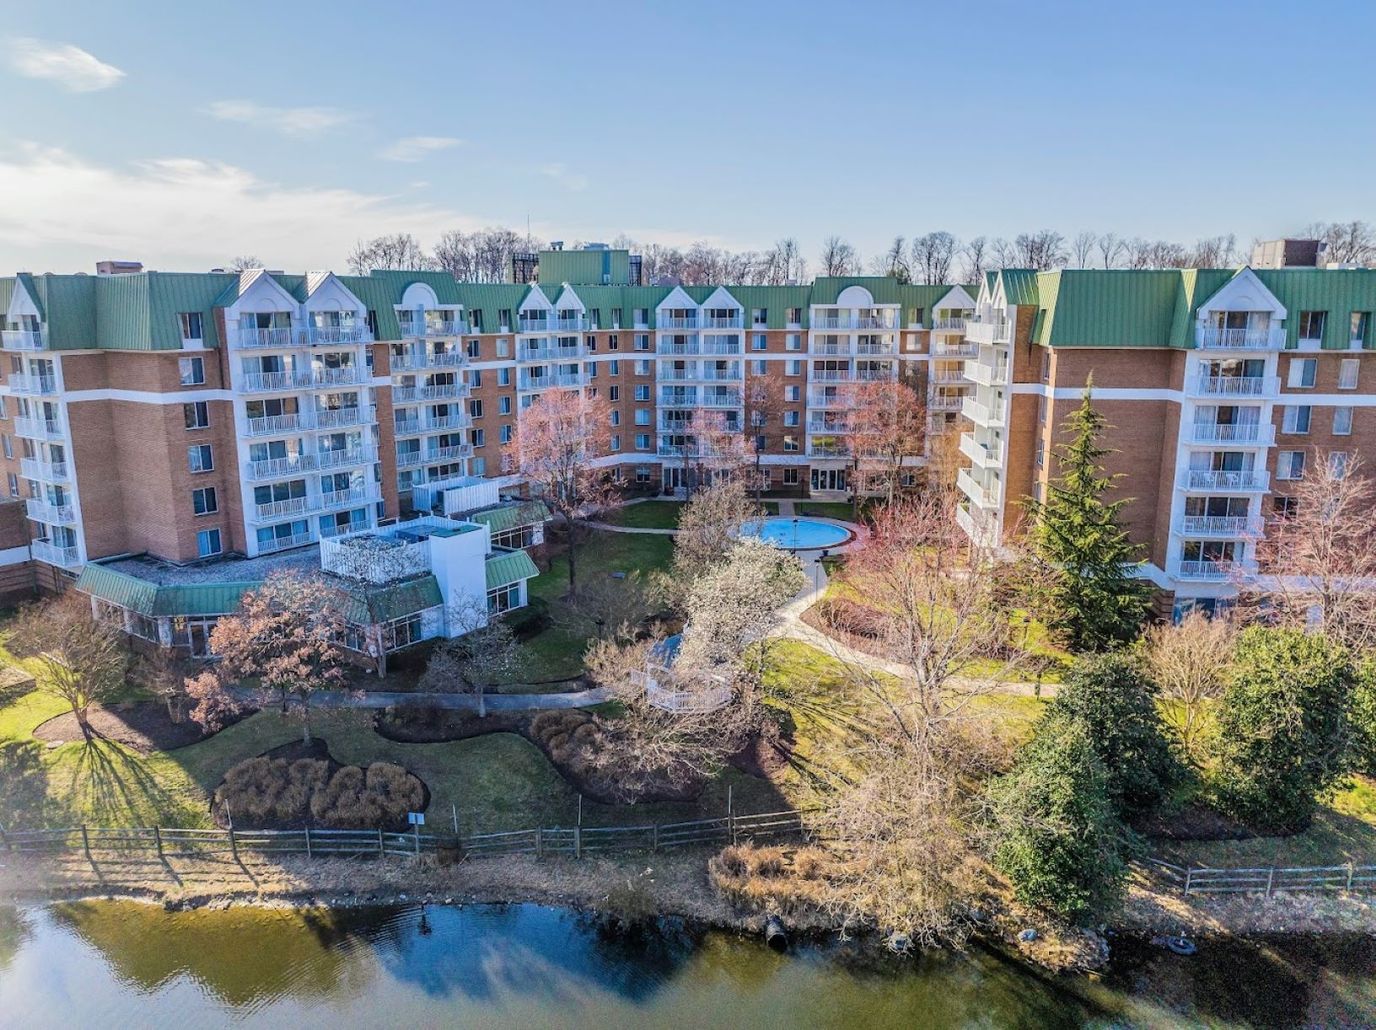
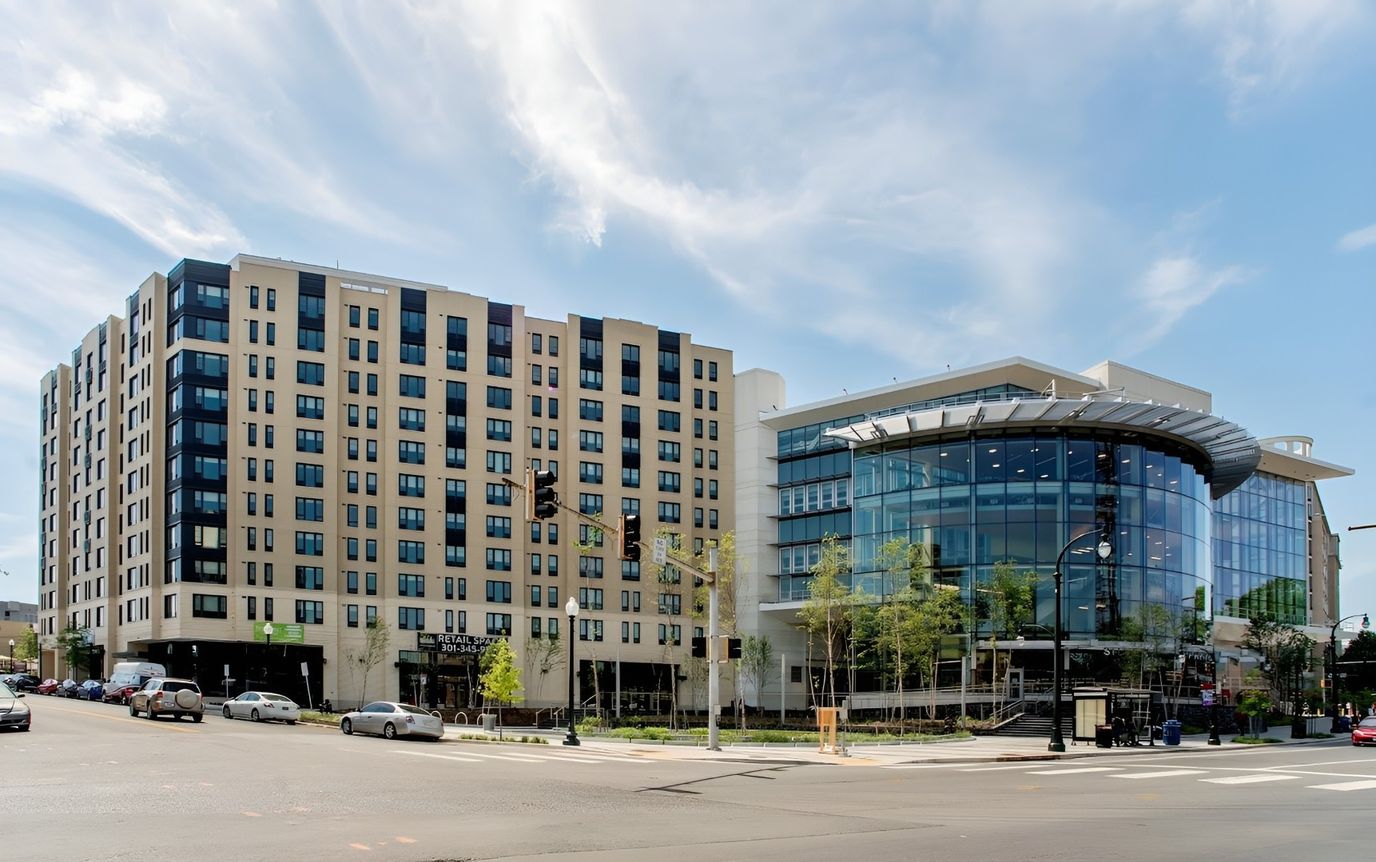
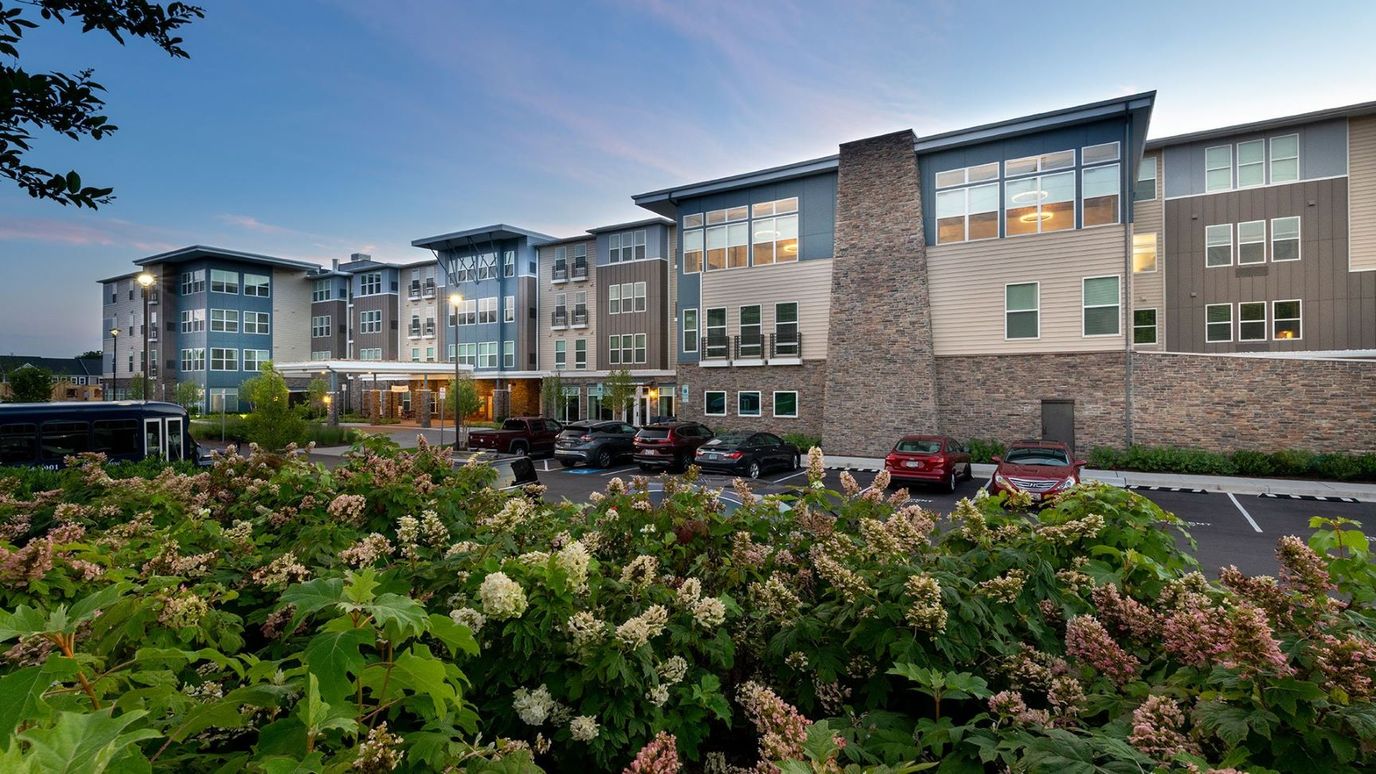
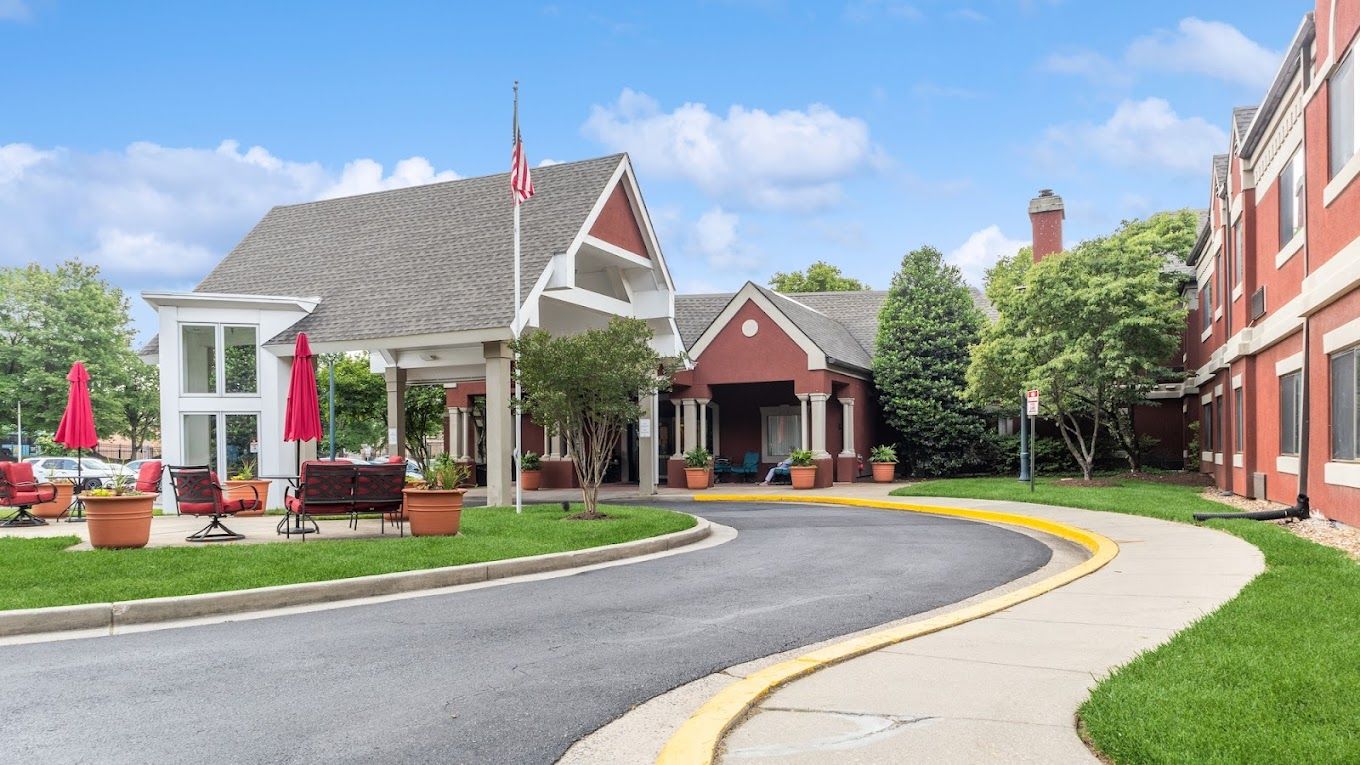
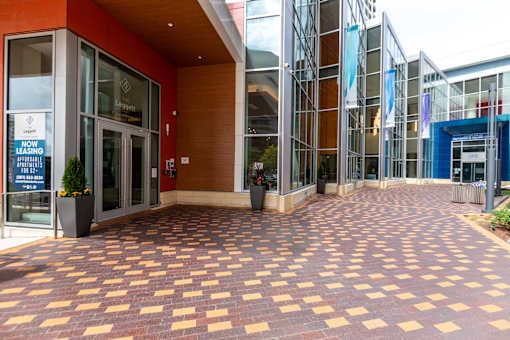
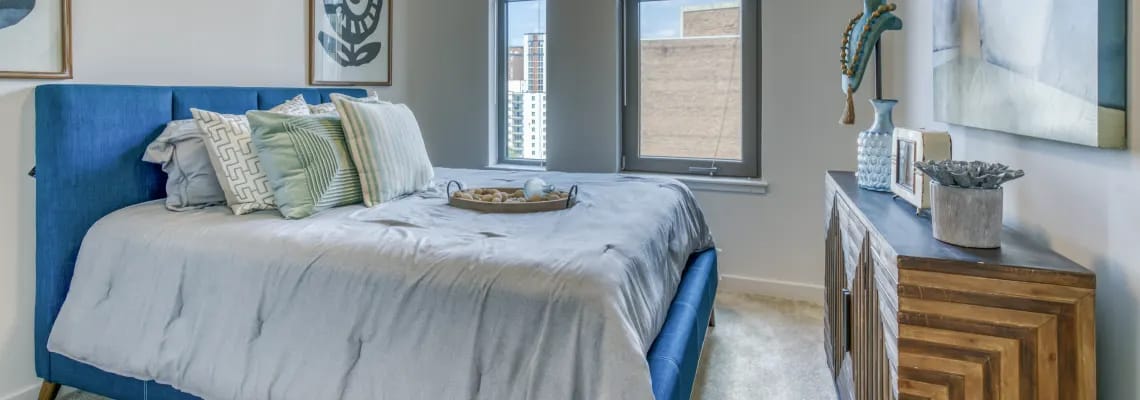
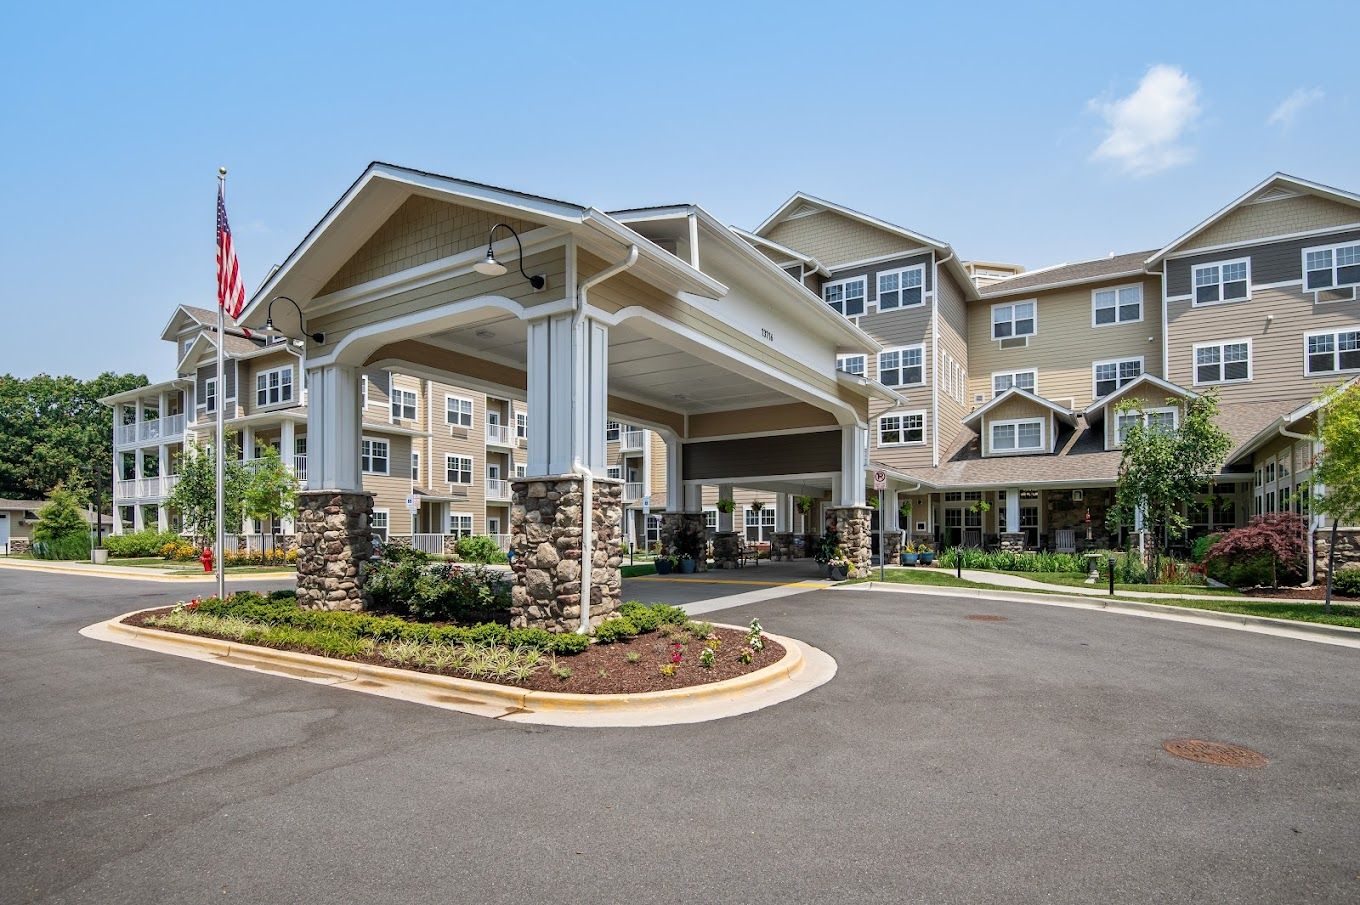
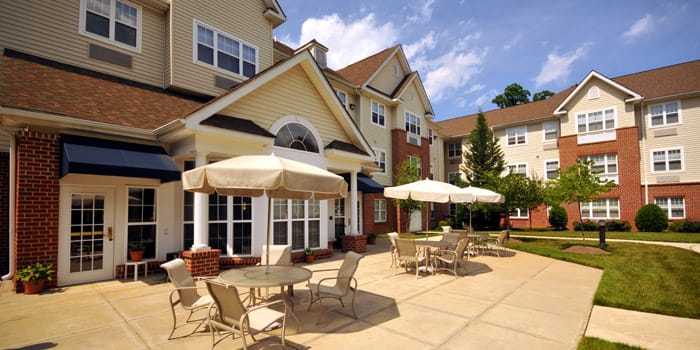
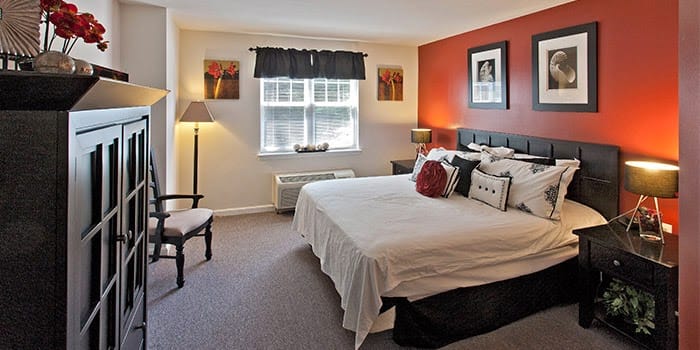
Bedford Court has been running in Silver Spring, Maryland for 34 years now, and it’s built around a simple idea: one community, several kinds of care. Independent living, assisted living, memory care, hospice, skilled nursing, rehab, it’s all under the same roof at 3701 International Dr.
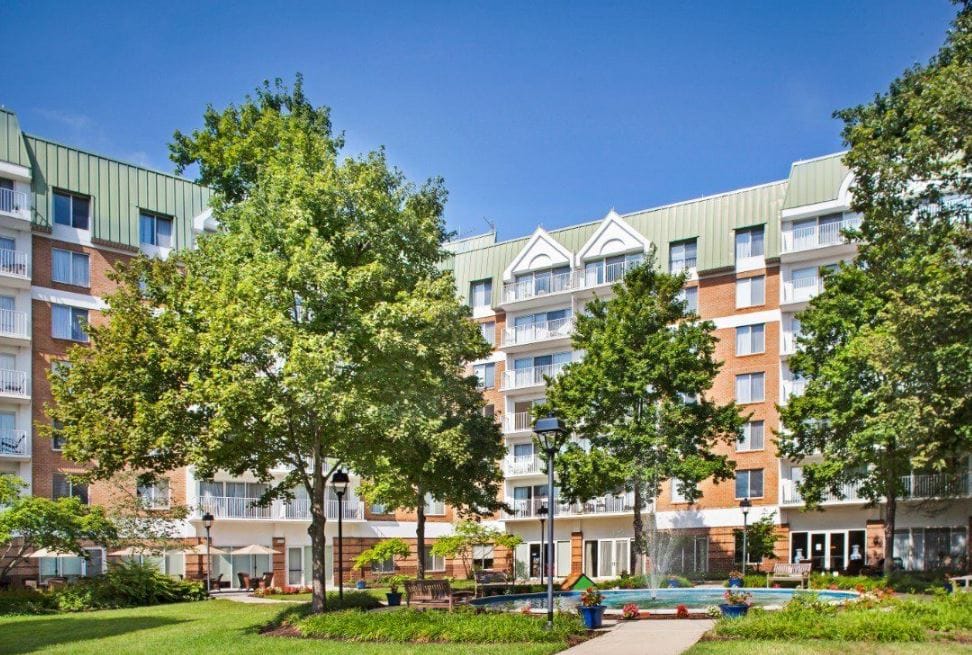
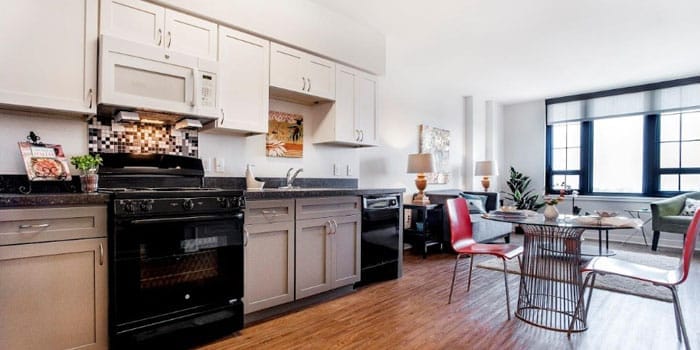
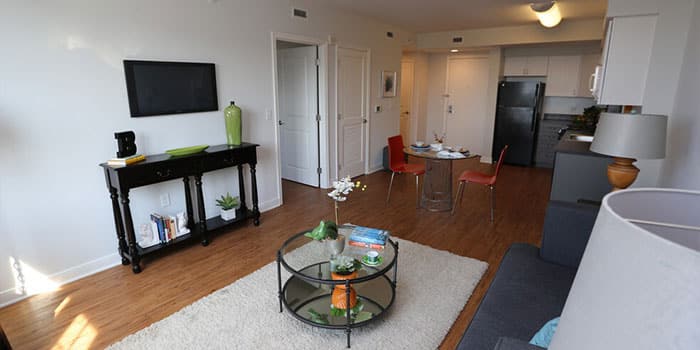
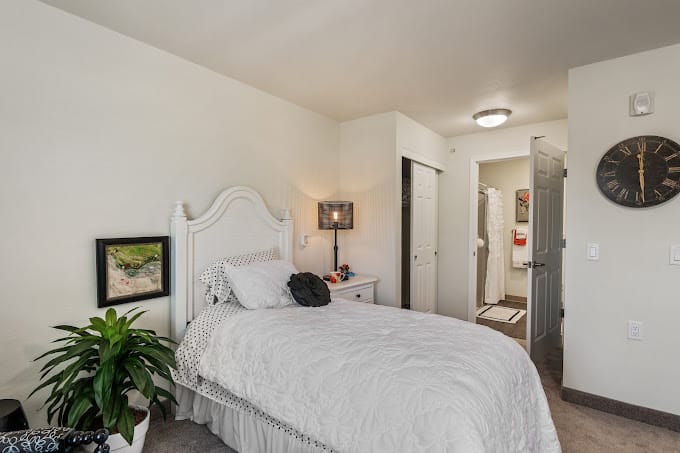
The place itself has 76 beds spread across studios, one-bedrooms, and two-bedrooms in a mid-rise building, and right now it’s sitting at 77% occupancy, 58 beds filled. The average stay runs about 64 days, and the starting price is $3,893 a month.
Most people land here through Medicare, 90% of new admissions, usually for short-term rehab after something like a surgery or a fall. The typical Medicare stay is 27 days, so this is a community that does a lot of short, focused recovery work, not just long-term placement.
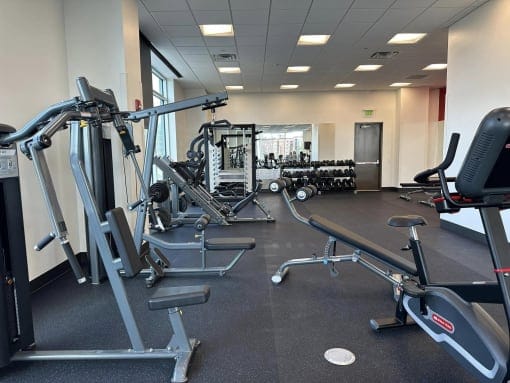
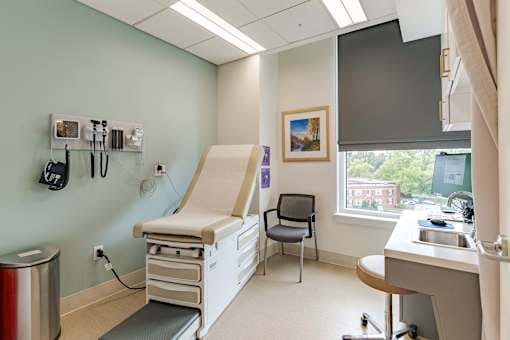
On staffing: residents get 32 minutes of RN time a day, 1 hour and 24 minutes from LPNs, and almost 3 hours from nurse aides, adding up to 4 hours and 48 minutes of total nursing care per resident, per day. That’s on top of rehab services, respite care, and round-the-clock staffing.
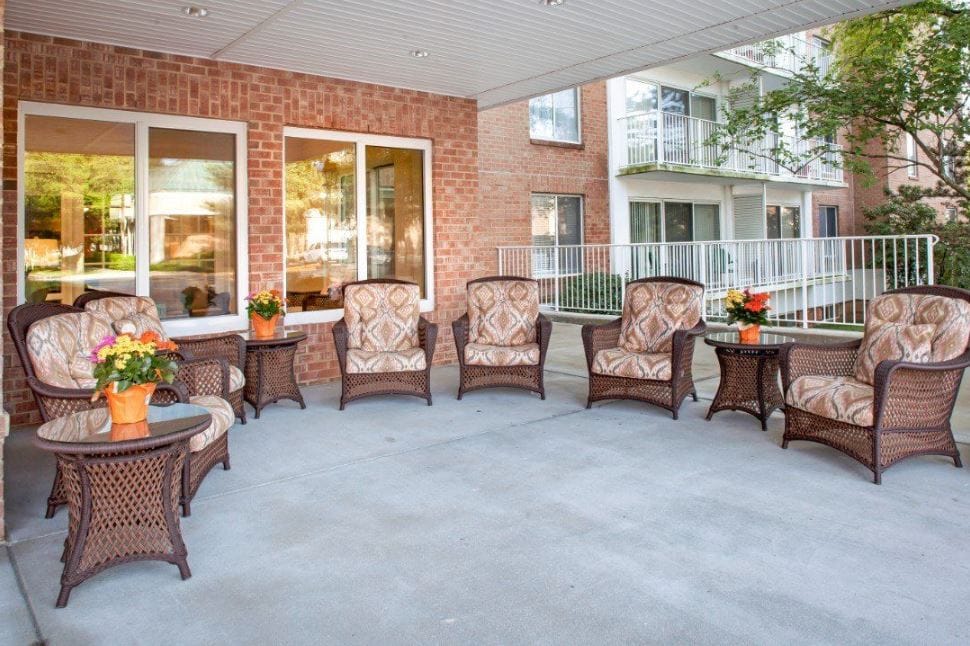
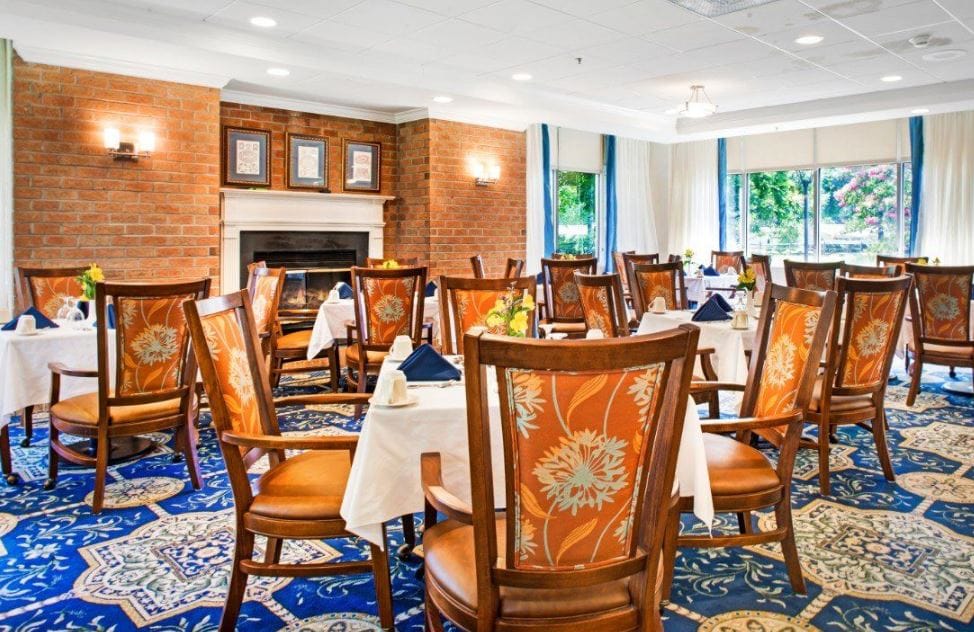
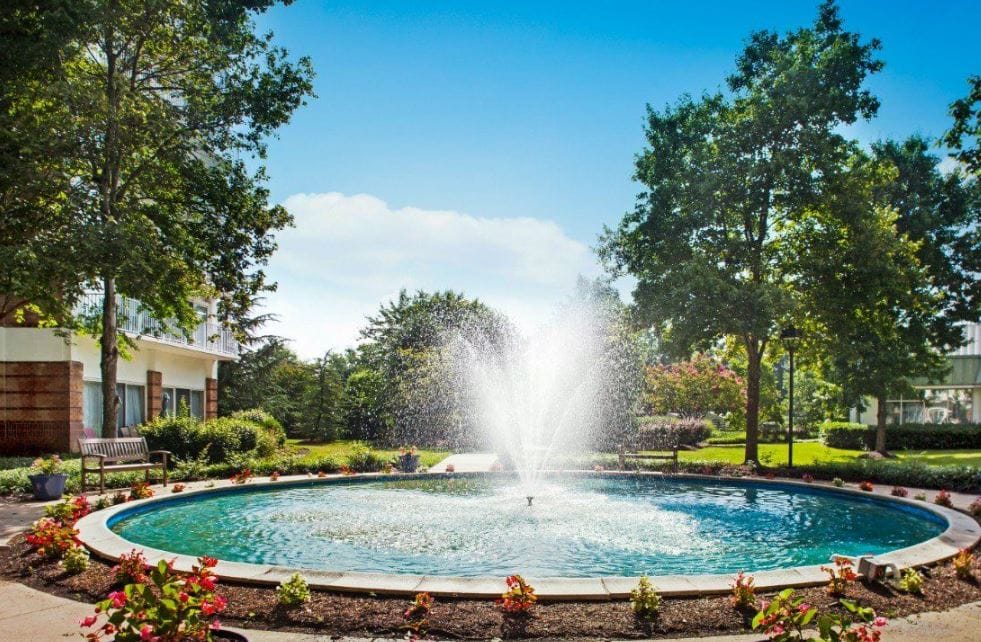
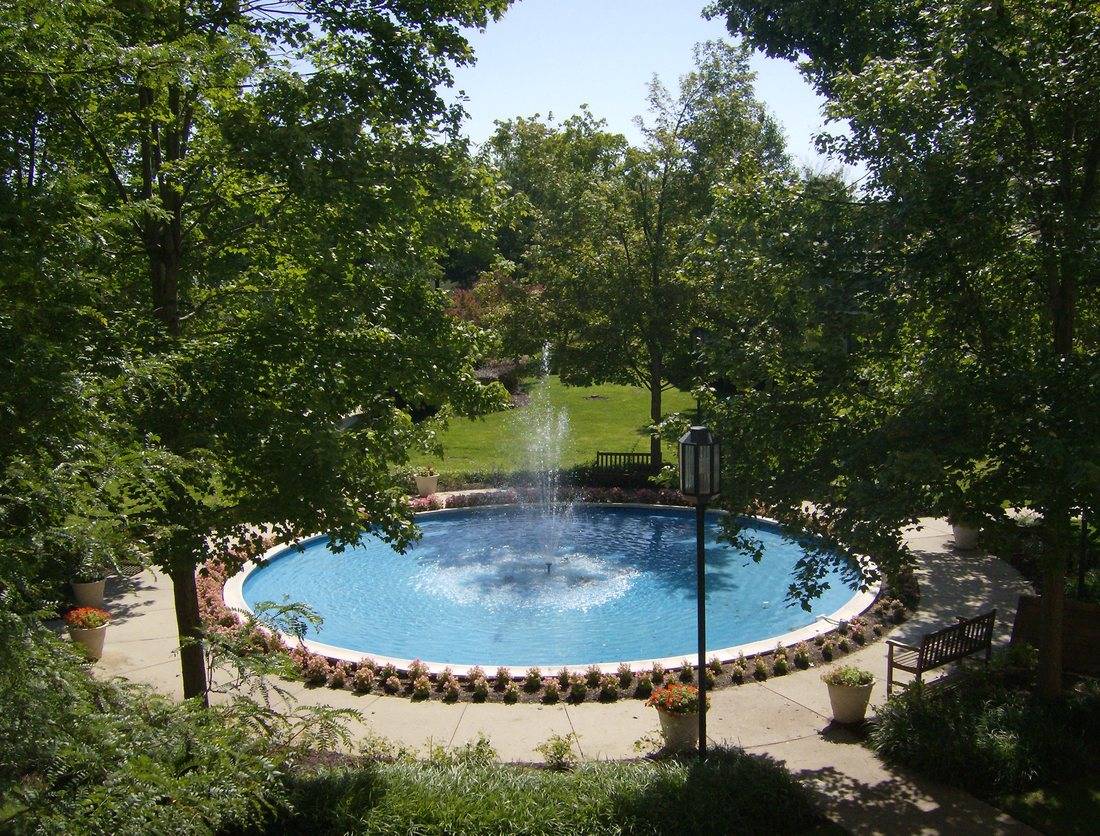
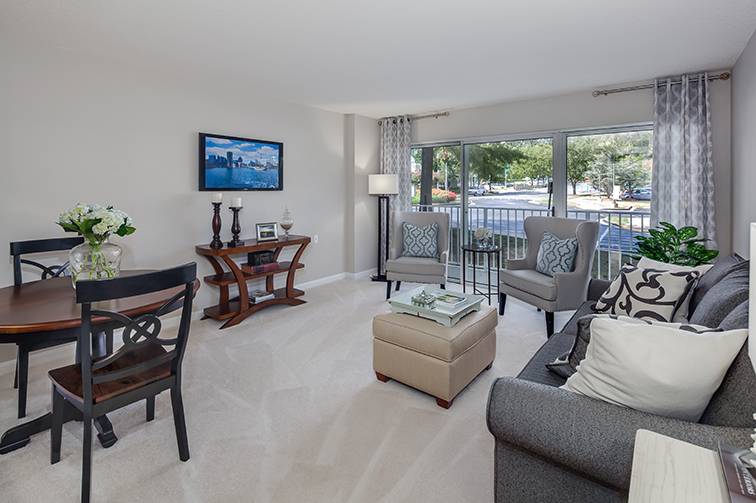
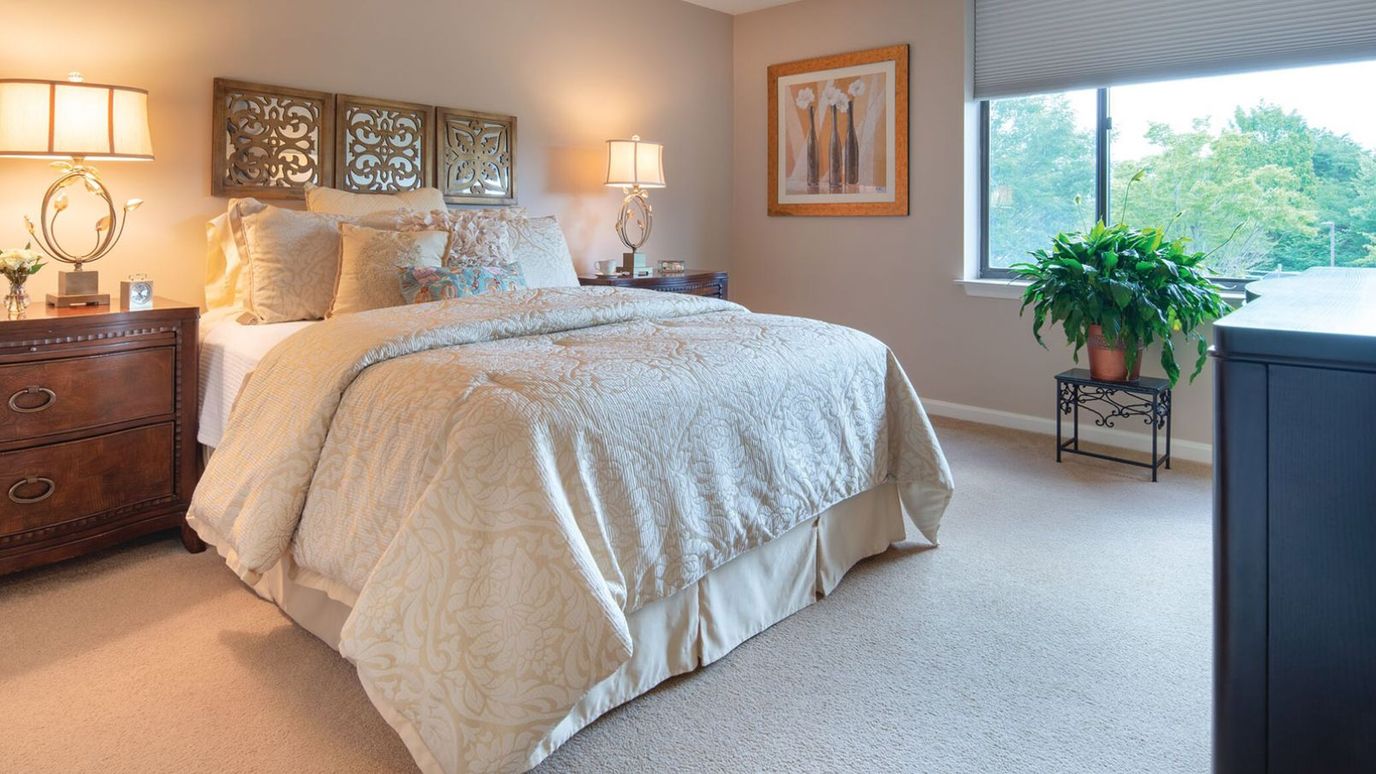
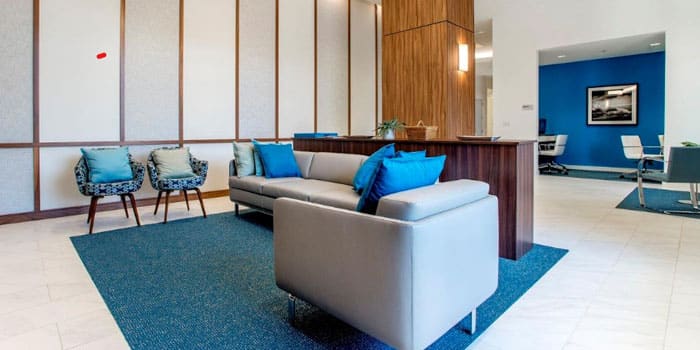
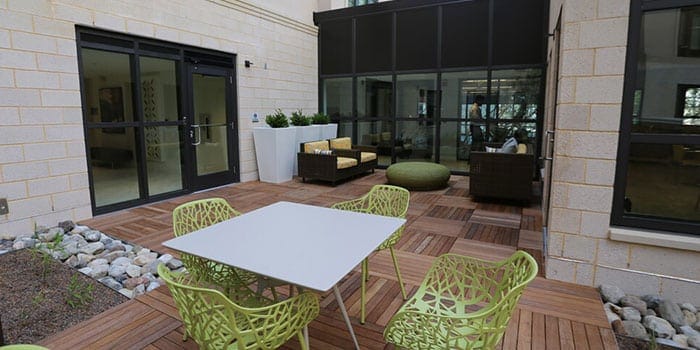
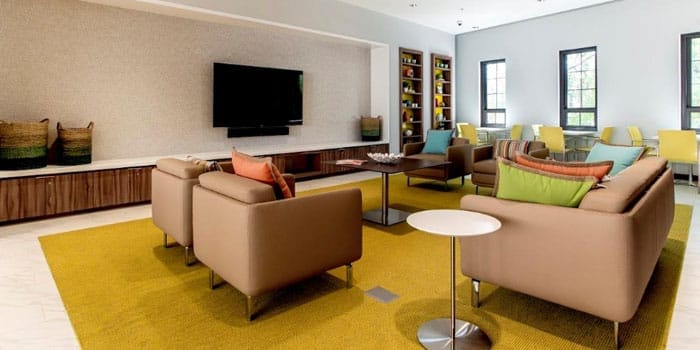
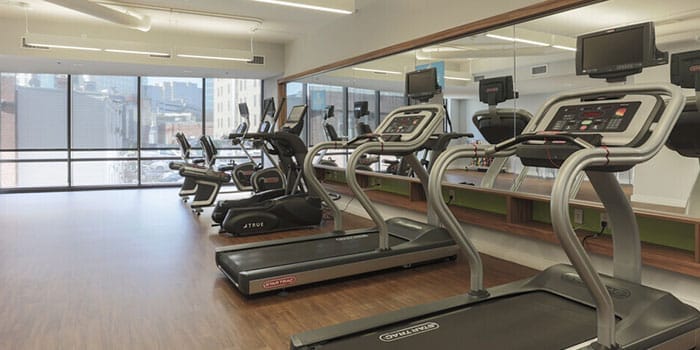
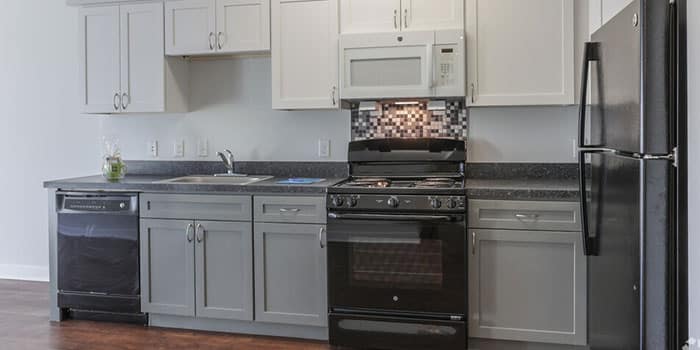
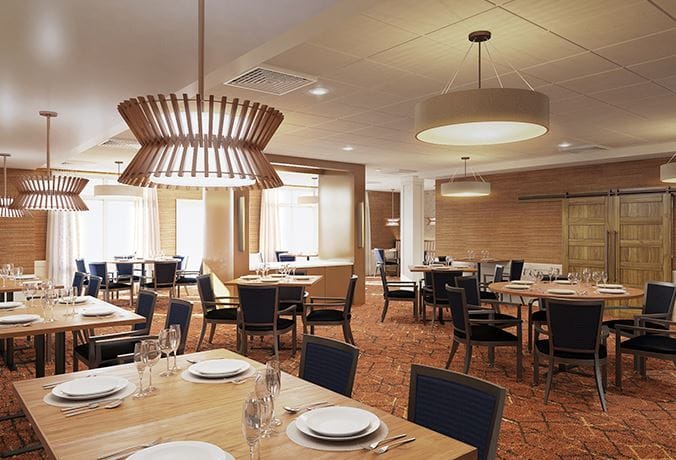
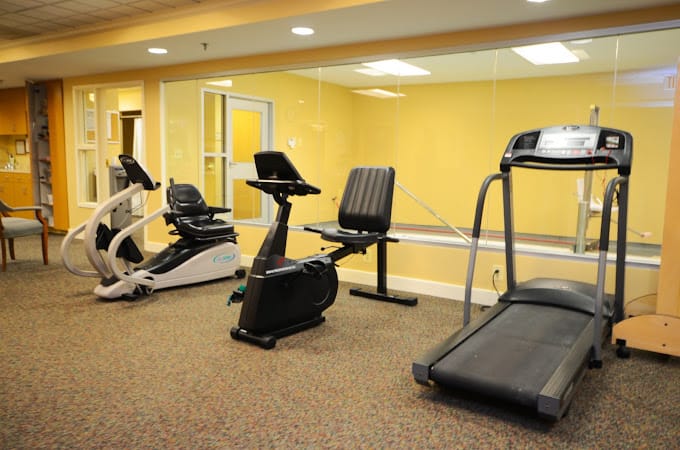
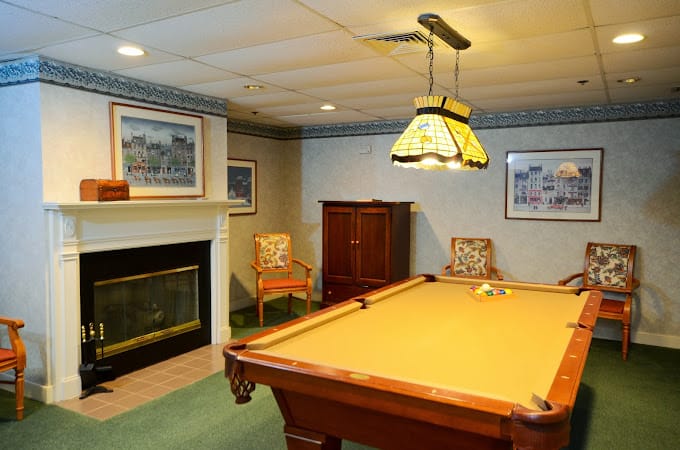
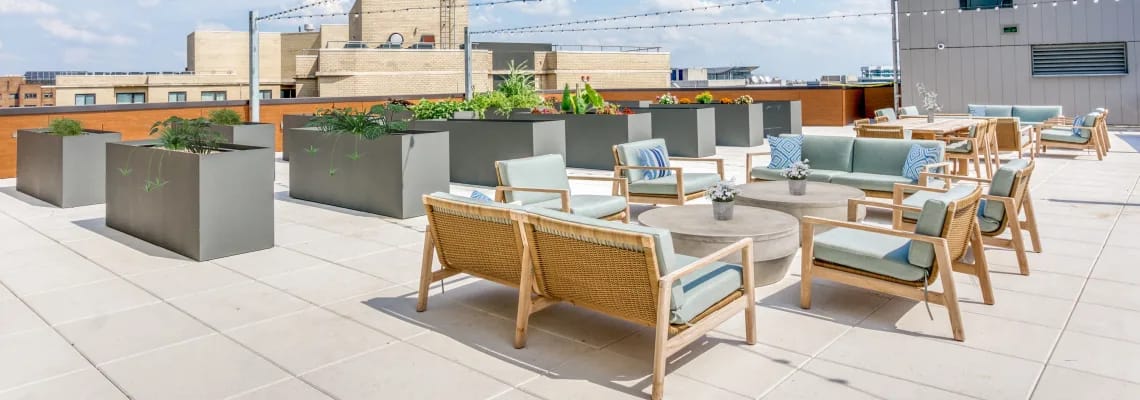
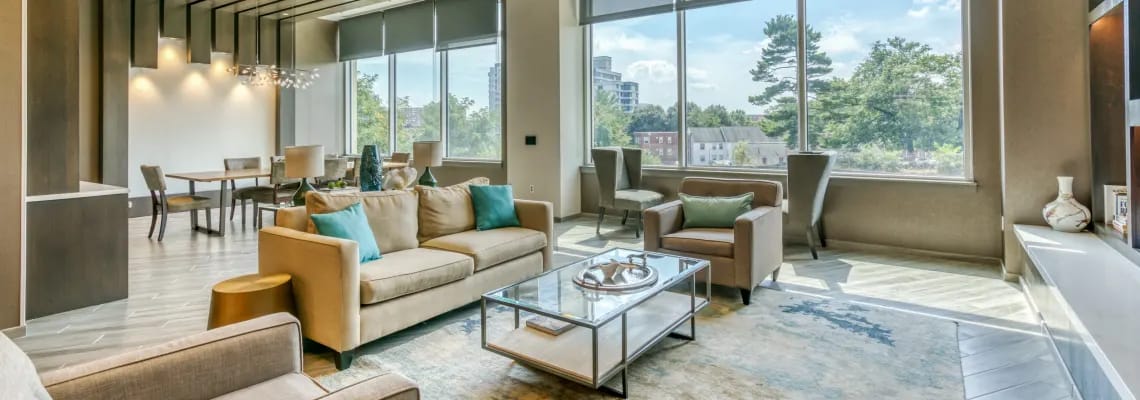
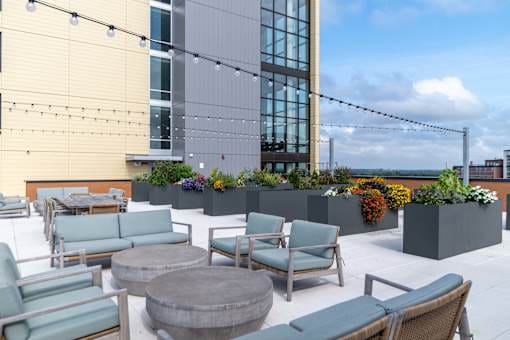
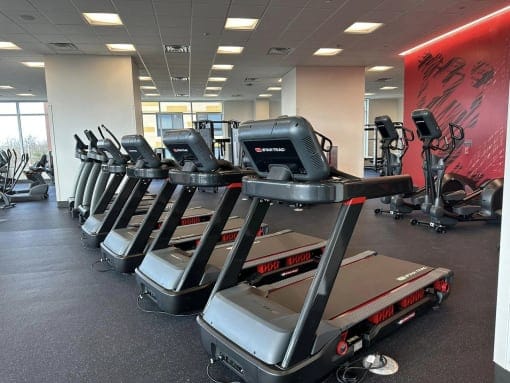
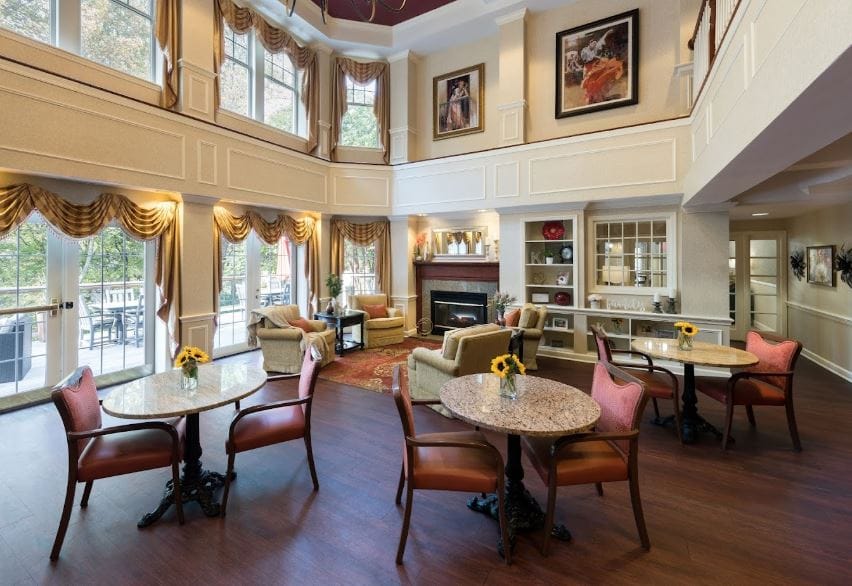
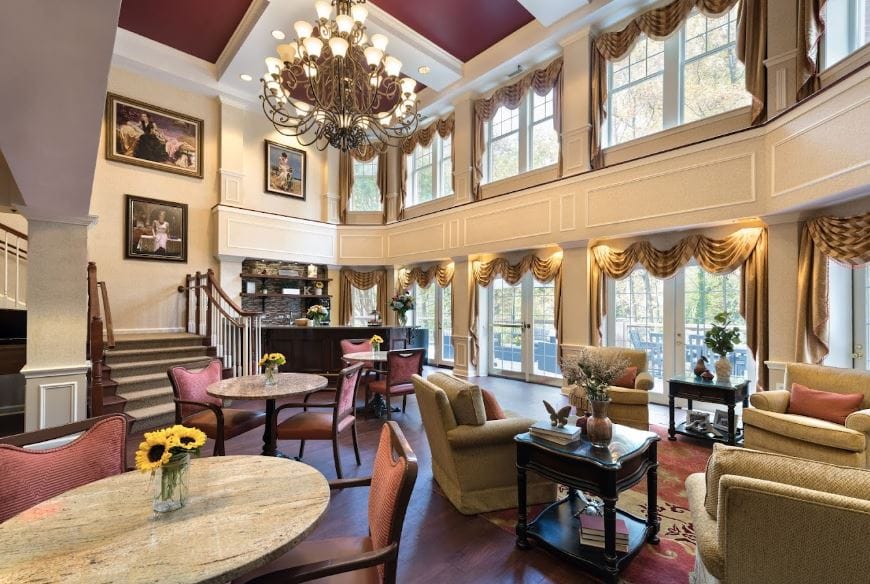
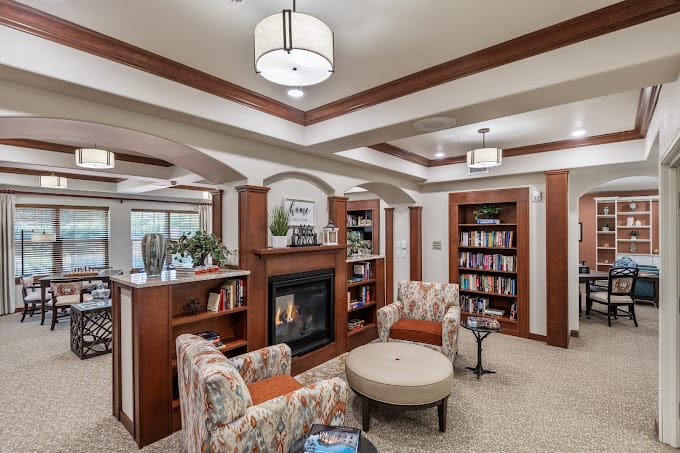
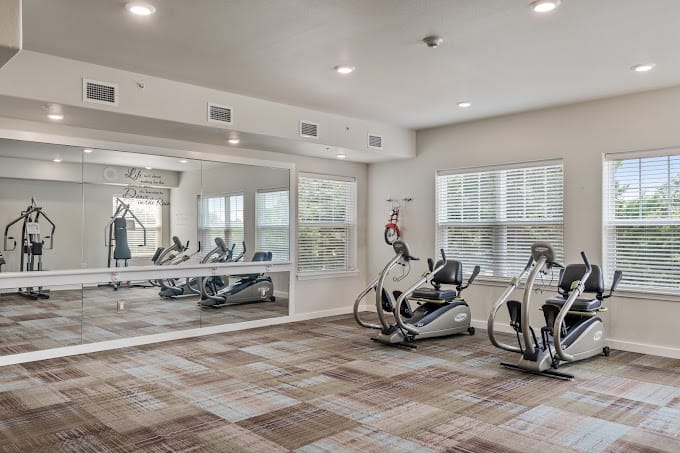
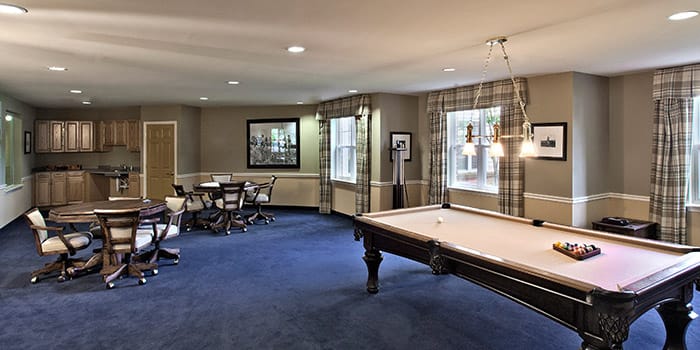
Day to day, there’s a spa, a dining room, a restaurant, a courtyard, a garden, a patio, billiards, transportation, and housekeeping. People do fitness classes, social events, resident groups. Walk Score is 66, moderately walkable, so a short list of errands can happen on foot without much fuss.
Put together, the numbers describe a community built for quick turnaround rehab care backed by a fuller continuum underneath it, the kind of place where a short stay and a long-term move both fit the same address.
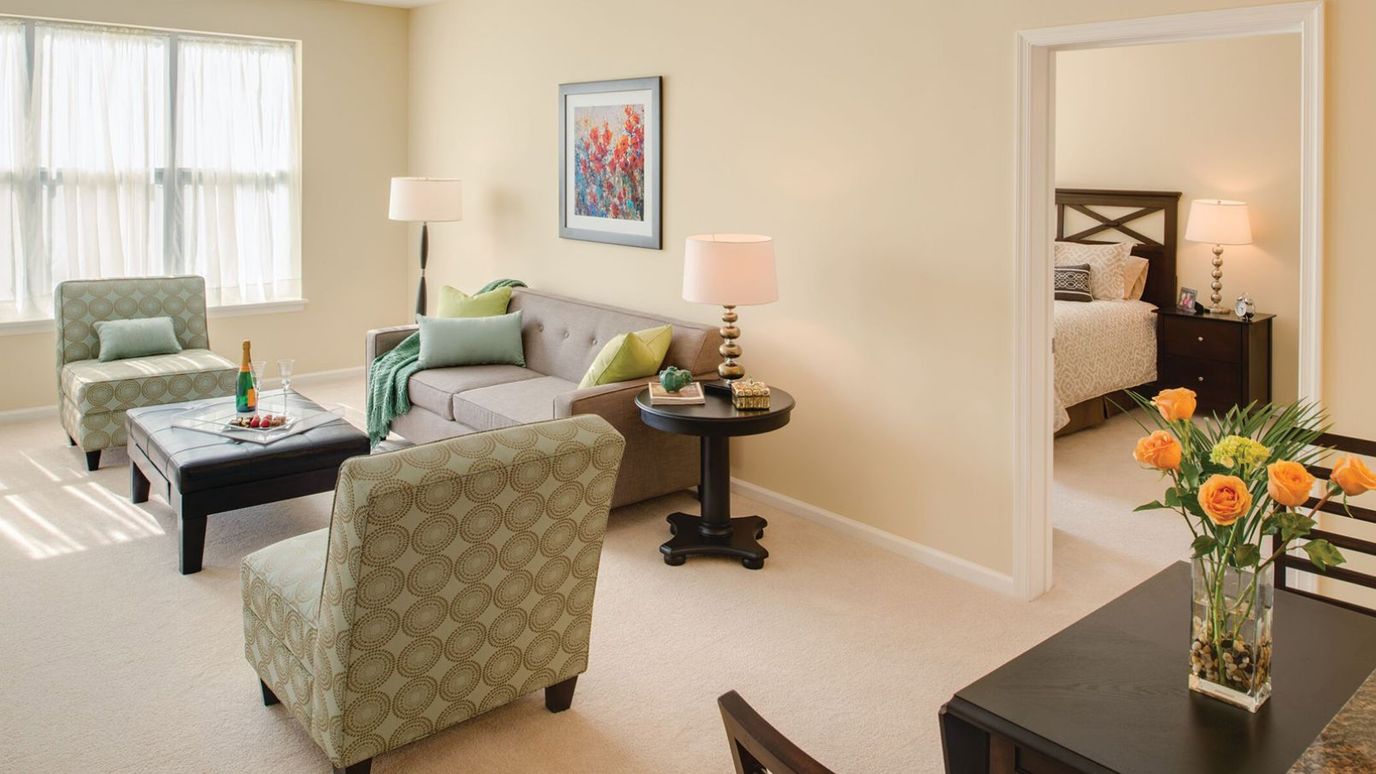
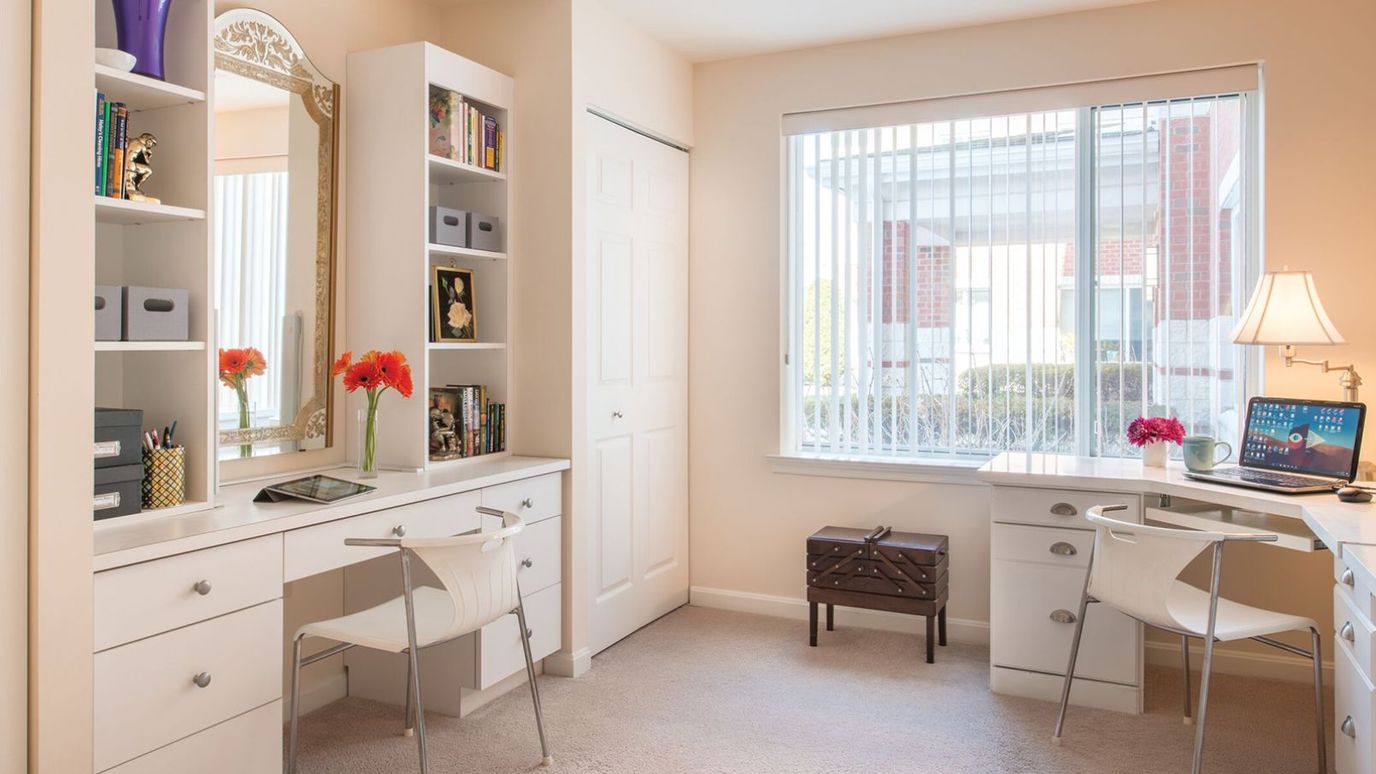
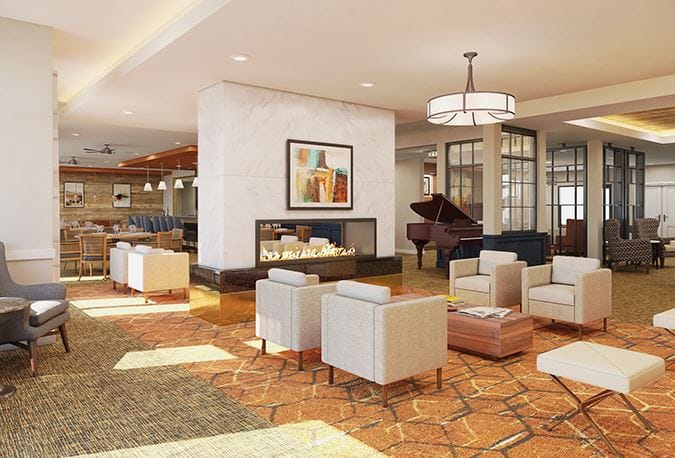
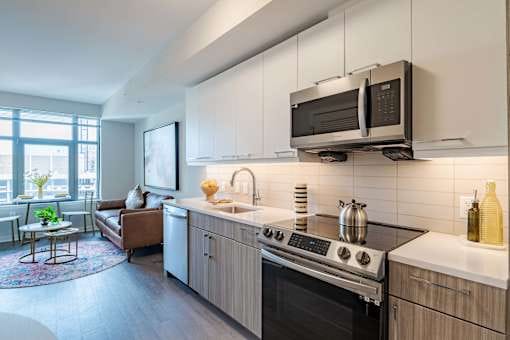
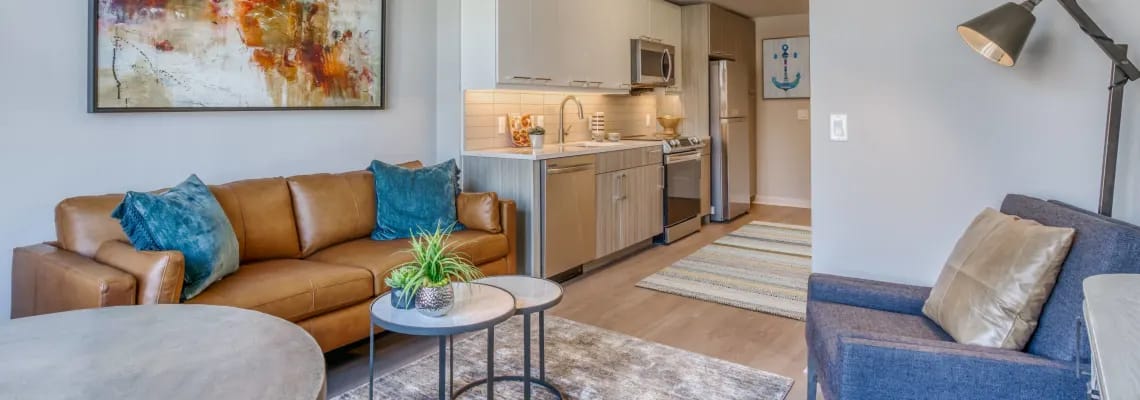
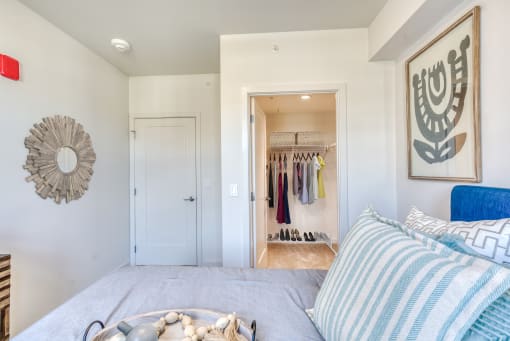
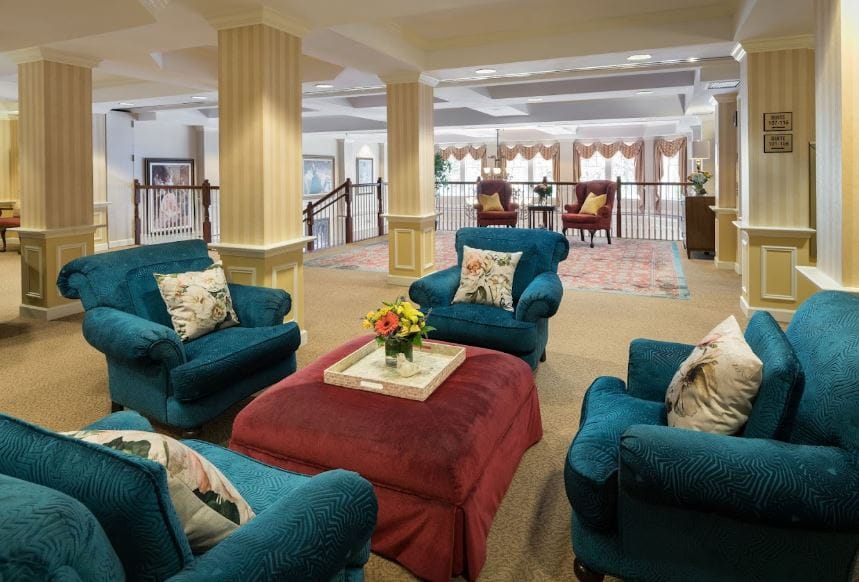
Live a vibrant retirement life with Bedford Court, a blissful senior living community in the serene and beautiful neighborhood of Silver Spring, MD, that strives to provide a welcoming environment filled with warmth and outgoing residents. Here, residents are offered with an active independent living and assisted living lifestyle, as well as skilled nursing and rehabilitation services for those who require assistance in their recovery process. The community provides an array of convenient services, including assistance with daily living activities, medication management, personal care support, and more.
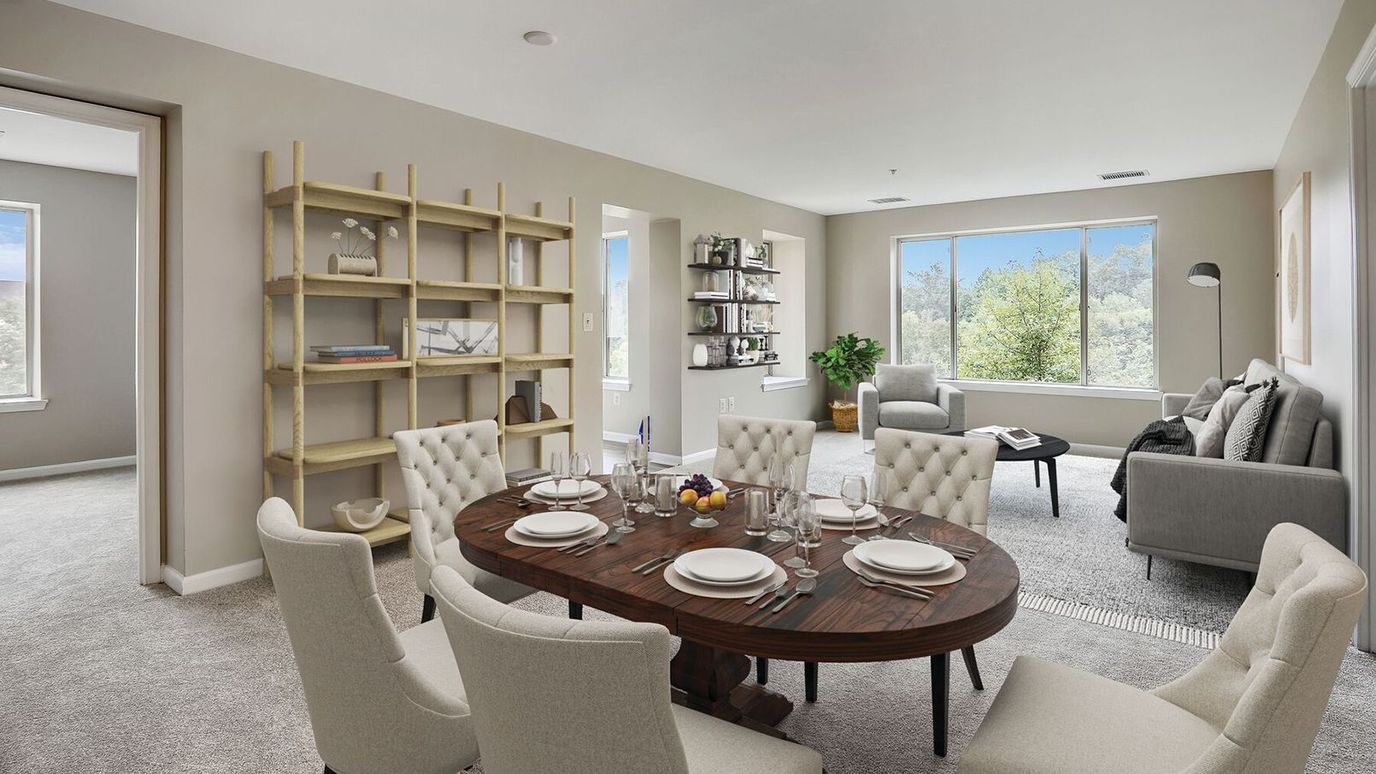
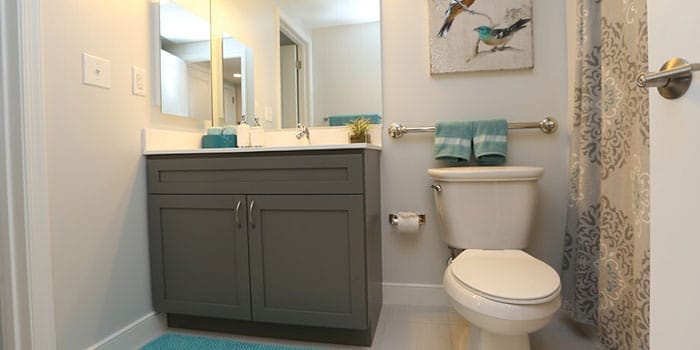
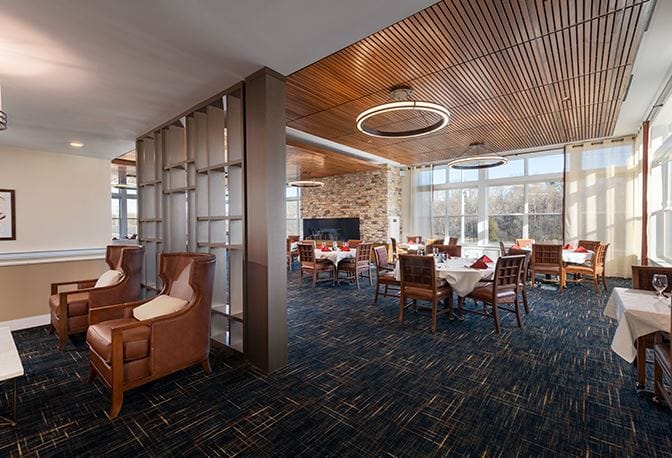
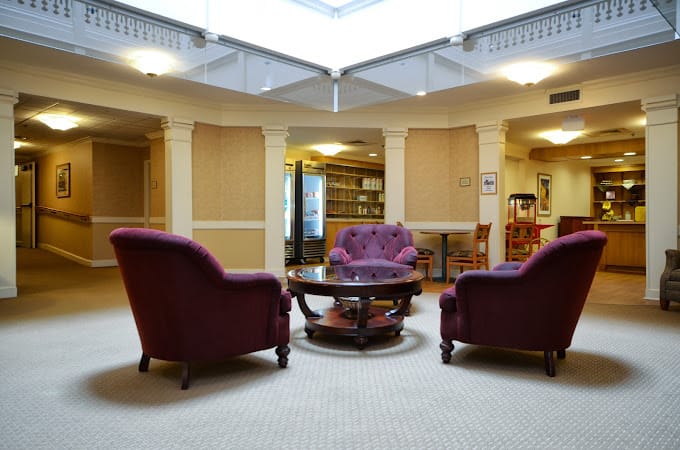
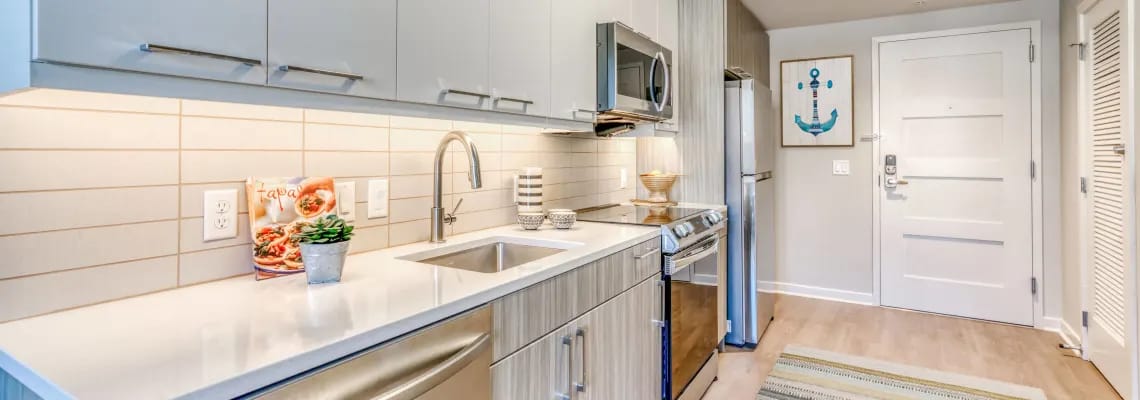
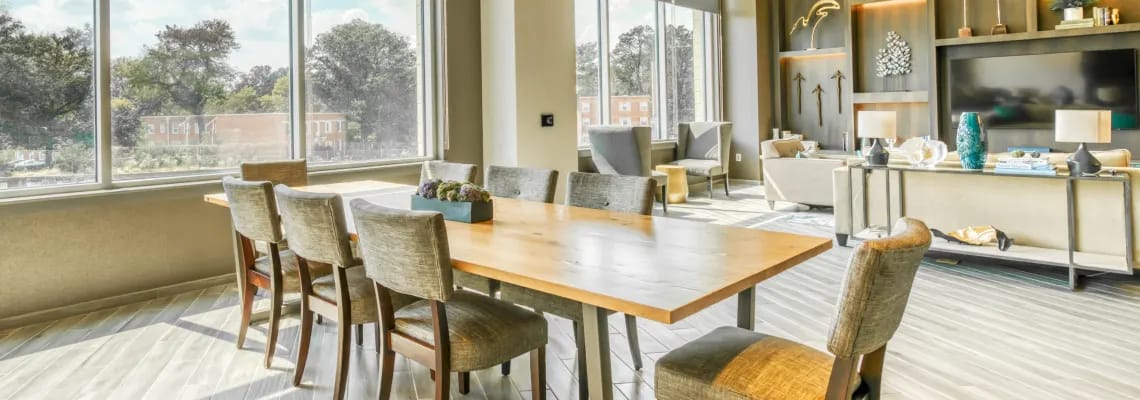
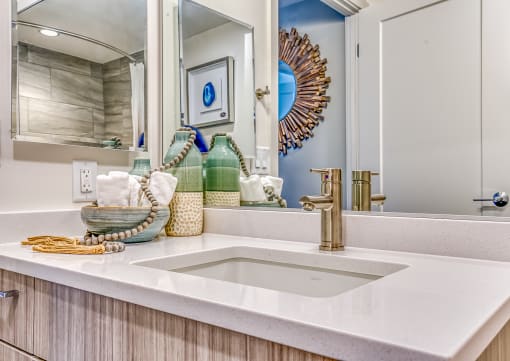
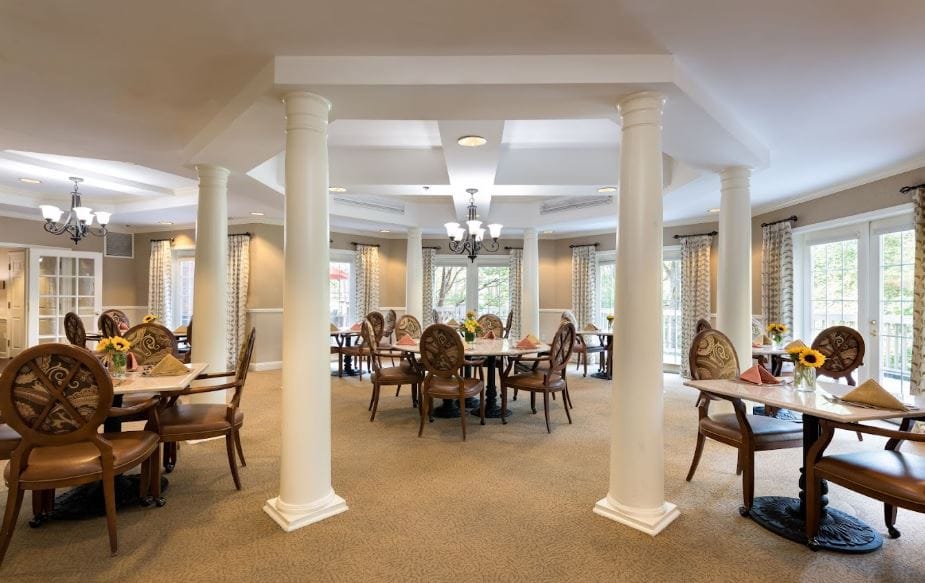
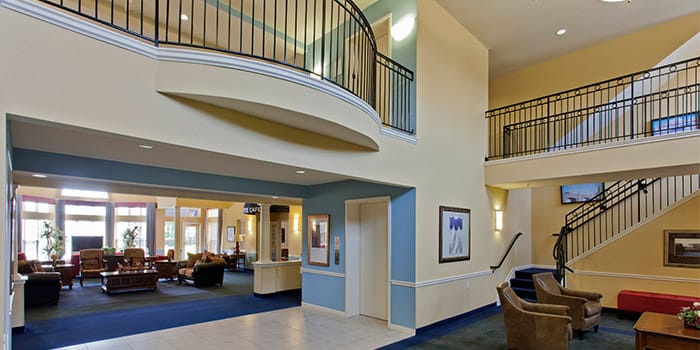
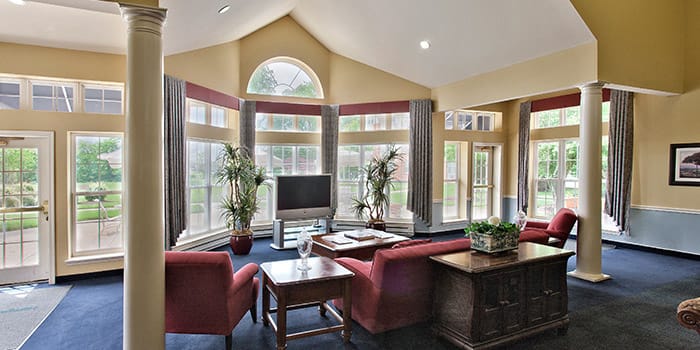
Various conveniences, such as housekeeping, maintenance and concierge services are offered for a maintenance-free living experience. Residents can prepare their own meals or enjoy the community’s restaurant-style dining experience with a great selection of delicately prepared meals served in an elegant dining area. A multitude of hotel-like amenities, such as fitness center, spa, gazebo, activity rooms, a bistro, salon, sun room, and beautiful outdoor spaces are offered to make residents’ living experience more enjoyable.
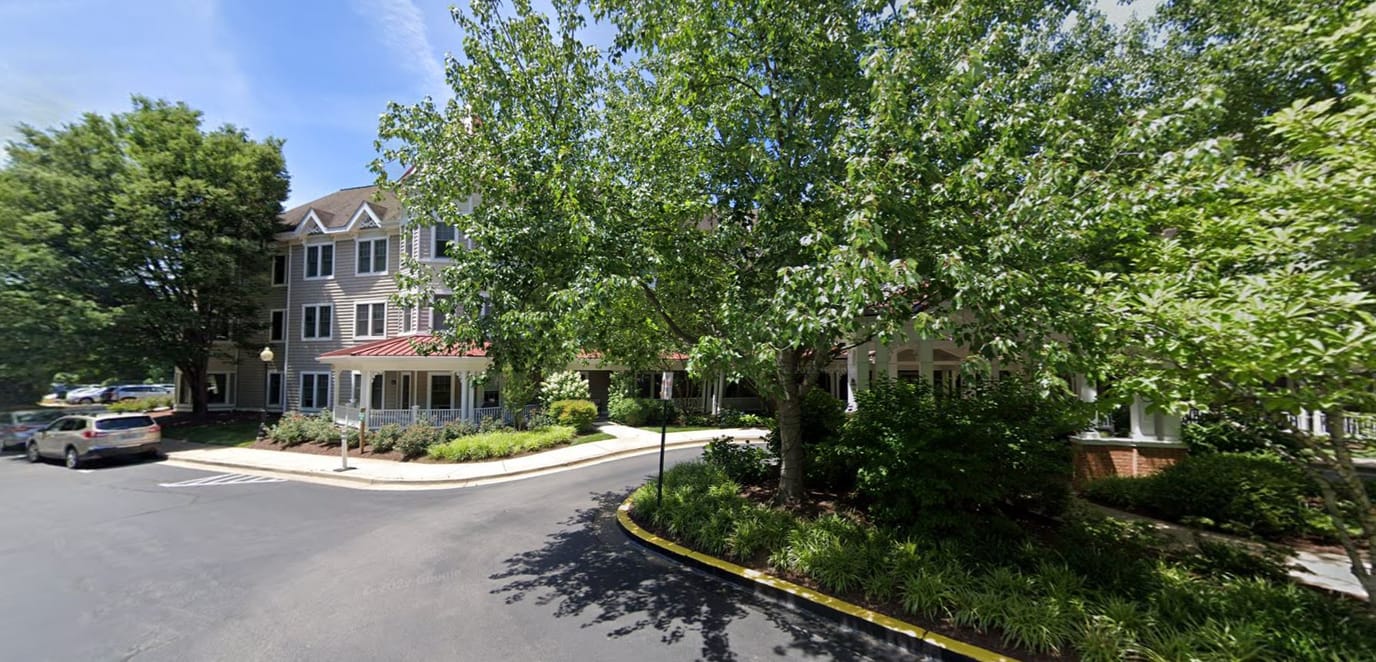
Twenty-three years on Gracefield Road in Silver Spring puts Riderwood Village in a different category than the newer facilities that dominate this region. It is a Continuing Care Retirement Community operated by Erickson Senior Living, with 275 beds spanning nursing home, assisted living, memory care, and skilled nursing. Prince George’s County is a car-dependent neighborhood (Walk Score 33), 7 miles out from Silver Spring’s center.
The numbers that matter most here: total nursing coverage is 4 hours and 54 minutes per resident per day, with registered nurses accounting for 1 hour and 25 minutes of that. Average length of stay is 79 days, which aligns with the facility’s intake pattern. Medicare and private pay are accepted; 203 of the 275 beds are currently filled.
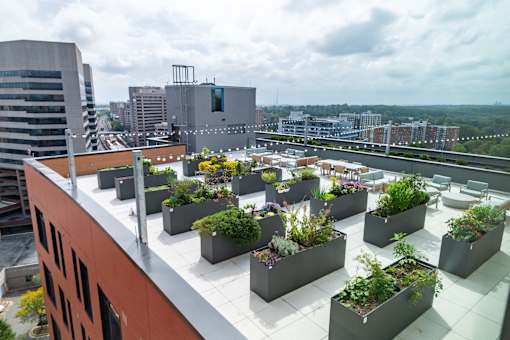
Memory care has dedicated infrastructure. The Alzheimer’s unit is organized around three clinical levels, from mild through severe, rather than a single undifferentiated placement. Personal care assistance, transportation to medical appointments, chef-prepared meals, walking trails, and a salon and barbershop round out the resident experience. An active Resident Council and Family Council both meet regularly.
Riderwood Village is built for people who need a clinically substantial setting and want the continuity of a multi-level campus, with the staffing depth and institutional track record to match.
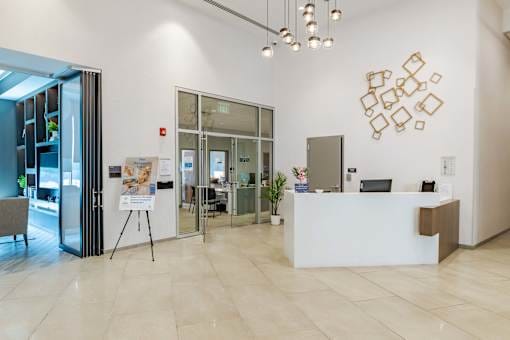
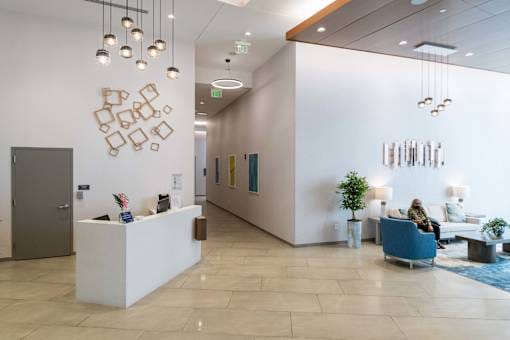
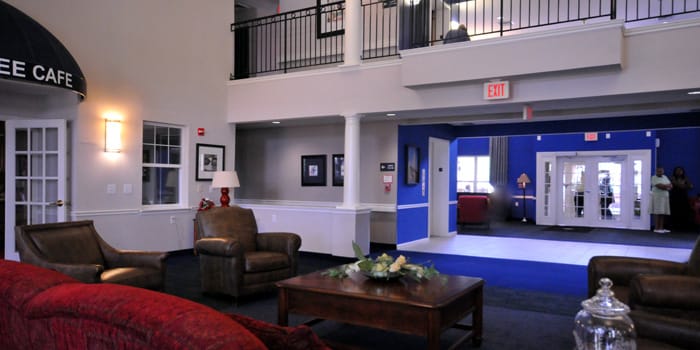
Conveniently located in the thriving neighborhood of Silver Spring, MD, The Bonifant at Silver is an astounding community that offers independent living. The community features cozy and specially designed one-bedroom floor plans, ensuring that those 62+ are comfortable and safe. On-site maintenance, management, and concierge services are also provided, so residents have a worry-free lifestyle.
Residents will not run out of things to do for leisure and wellness with a well-thought-out calendar of engaging activities and enriching programs. Delightful restaurants and shops in the area provide residents with a variety of dining options that cater to their dietary needs and preferences. Accompanied by the community’s extensive services and state-of-the-art amenities, residents are guaranteed the finest retirement experience.
Brightview Crofton Riverwalk is a mid-rise community at 1301 Clarity Dr in Crofton, Maryland, operated by Brightview Senior Living. It has been open for 6 years and holds 92 units in studio, one-bedroom, and two-bedroom configurations. The Walk Score is 45, which means a car is needed for most errands. Room pricing starts at $257 per day for a private room and $337 per day for an apartment.
Three care levels are offered under one roof: independent living, assisted living, and memory care. The memory care side includes a dedicated Alzheimer’s unit organized around mild, moderate, and severe care levels. Brightview’s branded Bright Minds Program runs alongside the clinical care model.
Respite care is available. Licensed nurses and CNAs staff the community, and the facility has a hospice affiliation with Hospice of the Chesapeake. Pets are allowed.
The day-to-day environment is well-appointed. Chef-prepared meals are served in the main dining room, with a private dining room available for family occasions. The building includes a fitness center, library, arts and crafts room, and a full-service beauty and barber shop. An outdoor courtyard and a daily structured activity schedule round out the lifestyle infrastructure.
Brightview Crofton Riverwalk is a full-continuum Brightview Senior Living property: independent living through memory care, a structured Alzheimer’s program with three care levels, on-site hospice affiliation, and a complete amenity set, all in a mid-rise building in Crofton’s Anne Arundel County.
Overview of Seaton Silver Spring

Nestled in a serene location just outside Washington, D.C. and Baltimore, Aspenwood Senior Living Community in Silver Spring, MD, offers a stress-free retreat where seniors can truly relax and unwind. In the company of friends who have become like family, residents at Aspenwood Senior Living experience a genuine sense of belonging. The community comes alive with laughter and shared memories as residents gather for delightful cookouts, engaging in heartfelt conversations, while the convenient shuttle service allows residents to embark on enriching outings, such as exploring the Smithsonian Museum.
At Aspenwood Senior Living, the community understands the significance of pets in residents’ lives. The charmingly designed living spaces are thoughtfully pet-friendly, ensuring that cherished companions are always welcome. The all-inclusive pricing simplifies the financial aspect by bundling various expenses into one convenient monthly payment. With personalized care and exceptional services at the forefront, seniors can fully embrace a fulfilling lifestyle, unburdened by the complexities of managing multiple bills. Aspenwood Senior Living is committed to providing a warm and engaging environment where seniors can create cherished moments and make the most of their golden years.
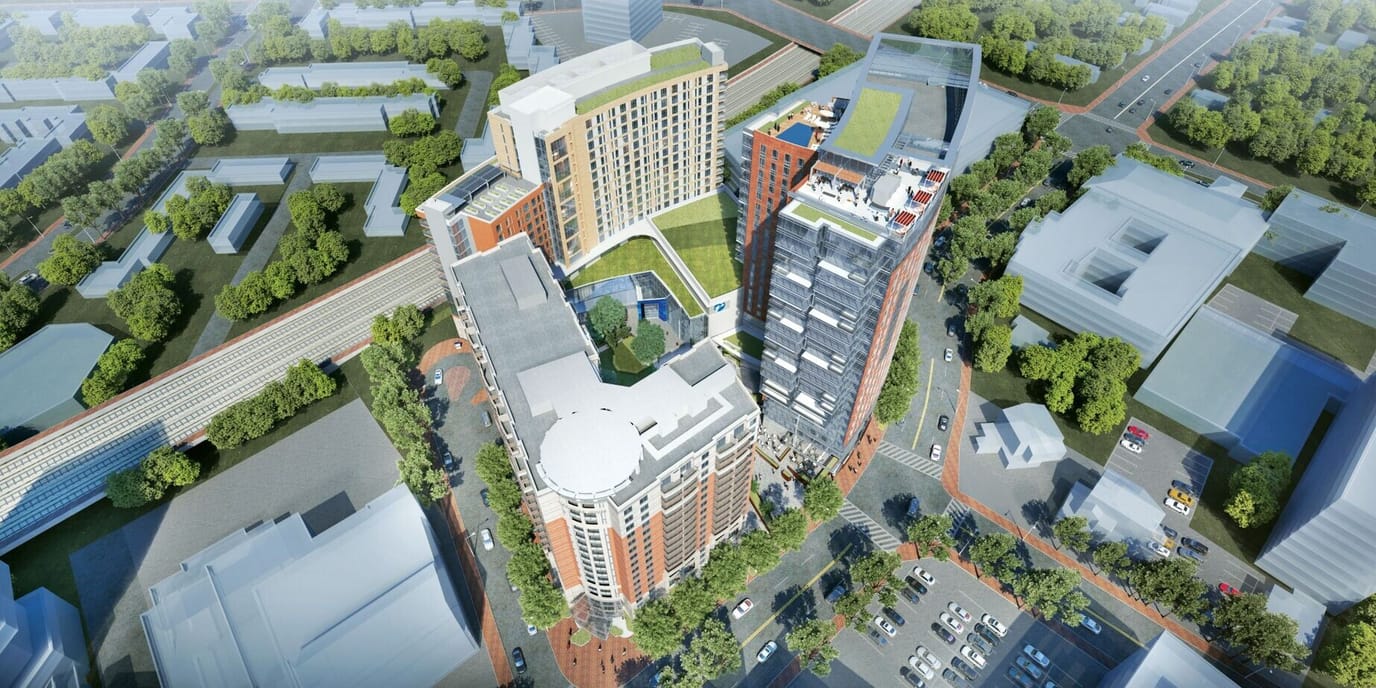
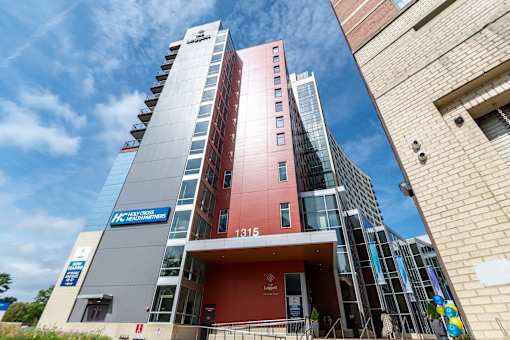
Overview of The Leggett
Surrounded by delightful local amenities in Silver Spring, MD, The Leggett at Elizabeth Square is an idyllic retreat that offers independent living. Dedicated to the comfort of those 62+, the community has beautifully furnished and spacious one-bedroom floor plans. Here, residents enjoy a worry-free lifestyle with maintenance services and plenty of convenient apartment features.
Residents will not run out of things to do with a variety of leisure opportunities and cozy communal spaces. Plenty of restaurants and shops also surround the area, ensuring easy access to dining options that cater to their dietary needs and preferences. Healthcare is also easily accessible with Holy Cross Health Partners residing nearby. The community is a great option for those seeking independence in their golden years.
Overview of Kensington Park

Kensington Park is a senior living community in Kensington, Maryland, offering assisted living, independent living, and memory care in one campus. It sits on 8 acres in Montgomery County, giving residents a spread-out, campus-style setting instead of a building on a tight lot. The three-story building sits about half a mile from Kensington’s town center.
Housing options comprise private and semi-private rooms, along with private and companion floor plans, so occupants and families can pick an arrangement that fits their budget and comfort with company. The home welcomes pets, letting residents keep companion animals with them while settling in. Clinical support exists on-site across the assisted living, independent living, and memory care settings. Daily life includes a bistro café where occupants can gather outside of formal mealtimes, and a beauty salon for grooming and personal care. Wellness programming includes brain exercise programs, massage therapy, and fitness training, giving residents a blend of cognitive, physical, and relaxation-focused activities. Transportation services help residents get to appointments and outings without relying on family for every trip. The somewhat walkable surrounding neighborhood has a Walk Score of 49, so some nearby services are reachable on foot, while most trips demand a car.
Since needs can change over time, families touring Kensington Park may want to ask staff how clinical support is designed across assisted living, independent living, and memory care settings.
Experience the epitome of independent living at Wilshire Estates Gracious Retirement Living. The community in Silver Spring, Maryland invites individuals to age with grace in a place where comfort and safety are paramount. Whether they prefer a cozy studio, a spacious one-bedroom apartment, or an elegant two-bedroom retreat, each option is thoughtfully designed to provide both comfort and style, all within the scope of the all-inclusive independent living cost.
From artistic endeavors that nurture their creativity to engaging discussions on current issues, there’s something for everyone to enjoy. The resident travel program further enriches their experience, whisking them away to different destinations at no additional expense, allowing them to explore the world and create lasting memories.
Ideally situated near MedStart Health: Medical Center at Leisure World Boulevard in Norbeck Road, Silver Spring, MD, Hampshire Village is a distinguished community that offers independent living. Here, residents choose from cozy and specially designed one- and two-bedroom accommodations, ensuring their comfort and convenience. The community is also equipped with an emergency pull cord, grab bars, smoke detectors, and sprinkler systems to ease residents’ worries.
With various fun activities and engaging programs, residents are encouraged to live actively and interact with their friends. Residents also enjoy mealtimes with the community’s breakfast bar and fully equipped kitchens, ensuring the finest dining experience. The community also features a variety of amenities, including a beauty salon, a business center, a cafe, a fitness center, a library, beautifully landscaped courtyards, and serene walking paths, creating the perfect backdrop for a vibrant retirement.
Ranking Methodology
How we rank these independent living communities
Every community above is evaluated across six weighted categories using public data including state inspection records, review platforms, BBB profiles, and operator-published materials.
Weighting overview
- 35%Resident Experience
- 25%Regulatory
- 15%Visual Media
- 10%Website
- 10%Stability
- 5%Environment
01
Resident & Family Experience 35%
The single largest share of every ranking. Aggregated review sentiment and volume from major platforms — the closest signal to real resident experience.
- Includes
- Review Sentiment
- Review Volume
02
Regulatory & Safety Record 25%
State inspection records, citations, and complaint visits. We weight per-inspection rates more heavily than raw counts.
- Includes
- State Inspections
- Citations/Inspection
- % Inspections w/ Citations
- Complaint Visits
- Accreditations
- BBB Rating
03
Visual Media & Transparency 15%
Communities that publish high-quality visuals give families a real preview. No photos or tours = a negative transparency signal.
- Includes
- Video Tours
- Virtual Walkthroughs
- Photo Quantity
- Photo Quality
04
Website & Operator Transparency 10%
Site quality and whether the operator publishes basic accountability information — staff names, contact details, ownership.
- Includes
- Website Content
- Mobile Usability
- Staff Info Available
- Owner Info Available
05
Community Stability 10%
Operational signals indicating whether a community is well-run and meeting demand.
- Includes
- Occupancy Rate
- Bed Options
06
Environment & Pricing 5%
Walkability and pricing transparency. Walk Score is weighted higher for Independent Living than for Memory Care, where most residents do not leave unaccompanied.
- Includes
- Walk Score
- Pricing Transparency
Who we are
Your Senior Care Partner, Every Step of the Way
We help families find affordable senior communities and unlock same day discounts, Medicaid, and Medicare options tailored to your needs.
Contact us Today
Frequently Asked Questions about Independent Living in Silver Spring, MD
What is the average cost of independent living in Silver Spring, MD?
The average monthly cost of independent living in Silver Spring, MD is approximately $1,870. Actual rates vary by community, level of care, and floorplan.
What is the price range for independent living in Silver Spring, MD?
Independent living in Silver Spring, MD typically ranges from $495 - $4,840 per month, depending on the community, room type, and care needs.
What is independent living?
Independent living communities are residential settings for active older adults — typically with private apartments or cottages, shared amenities (dining, fitness, activities), and no built-in medical care.
How many independent living communities are listed on this page?
This page features 16 independent living communities in Silver Spring, MD. Use the filters and comparison tools above to compare ratings, amenities, and pricing.
How do I choose the right independent living community in Silver Spring, MD?
Start by matching the level of care offered to the resident's current and anticipated needs, then compare licensing status, staff-to-resident ratios, recent inspection results, and pricing. Tour at least two or three communities in Silver Spring, MD, talk to current residents and families, and confirm what is included in the base rate versus billed as add-on services.
What should I look for when visiting independent living communities in Silver Spring, MD?
Pay attention to staff interactions with residents, cleanliness and odor, food quality at meal times, the activity calendar, and how questions about pricing and care plans are answered. Ask to see the most recent state inspection report, the move-out / level-of-care-change policy, and a sample monthly bill that lists every fee.
Updated on
