Page 35 of Best Senior Care in Maryland

Why trust this guide? Our editorial team analyzed 997 senior care communities in MD using MD Dept. of Health (OHCQ) data, inspection records, complaints, amenities, and facility-level details. How we rank senior care in MD
Reviewed by
Last updated
Jul 2026
We analyzed
997 homes
Avg Walk Score: 43/ 100The average Walk Score across facilities in Maryland. A third-party neighborhood walkability score (0–100) measuring convenience and context, not healthcare quality. Individual facilities can vary widely from this average.
National Average: 50/ 100
Avg No. of Beds: 42The average licensed bed capacity across facilities in Maryland. Individual facilities can vary widely from this average.
National Average: 90

Compare Senior Care around Maryland

Info below is compiled from the MD Dept. of Health (OHCQ), senior community websites & trusted data sources such as Walk Score & BBB.

Communities are listed from highest to lowest based on our ranking methodology.

Bedford Court, a CCRC
SC
AL
HOS
IL
MC
NH
RC
SNF
Silver Spring (International Drive)
76
Facility 76
MD AVG 42
Rank #174 / 685
Yes
64
Facility 64
MD AVG 43
Rank #261 / 985
Studio / 1 Bed
34
Facility 34
MD AVG 21
Rank #22 / 210
-
15%

Male Residents — State Benchmarked 15% of residents are male, compared to the Maryland average of 31%. This facility caters to a majority female resident pool (85% female), consistent with the broader assisted living trend where women significantly outnumber men.

85%

Female Residents — State Benchmarked 85% of residents are female, compared to the Maryland average of 69%. Women comprise the large majority, consistent with national assisted living demographics where women live longer and enter care facilities at higher rates.

95%

White Residents — State Benchmarked 95% of residents are reported as White, compared to the Maryland average of 81%. A higher White share than is typical for assisted living in Maryland in this dataset — compare with peer facilities for local context.

3%

African American Residents — State Benchmarked 3% of residents are reported as African American or Black, compared to the Maryland average of 13%. A lower African American share than is typical in Maryland; local markets still vary widely.

2%

Other Ethnicity Residents — State Benchmarked 2% of residents fall into categories other than White or African American (combined), compared to the Maryland average of 6%. This column aggregates Hispanic, Asian, multiracial, and any other labeled groups that are not classified as White or African American. Reported subgroups in this total: Asian (2%).

2%

Residents Age 65–74 — State Benchmarked 2% of residents are 65–74, compared to the Maryland average of 13%. Fewer younger seniors suggests the resident population skews older, likely requiring higher acuity care and more hands-on support.

8%

Residents Age 75–84 — State Benchmarked 8% of residents are 75–84, compared to the Maryland average of 31%. Below the state norm — the resident mix may skew either younger or older than this typical middle bracket.

65%

Residents Age 85–94 — State Benchmarked 65% of residents are 85–94, compared to the Maryland average of 44%. A high concentration of very elderly residents signals a higher-acuity facility with experience caring for advanced age-related needs.

26%

Residents Age 95+ — State Benchmarked 26% of residents are 95 or older, compared to the Maryland average of 16%. A high proportion of the oldest-old suggests strong end-of-life care experience and very-high-acuity capabilities.

Edenwald Senior Living
SC
AL
IL
MC
NH
SNF
Towson (Southerly Road)
94
Facility 94
MD AVG 42
Rank #139 / 685
No
83
Facility 83
MD AVG 43
Rank #70 / 985
1 Bed / 2 Bed-A+
18%

Male Residents — State Benchmarked 18% of residents are male, compared to the Maryland average of 31%. This facility caters to a majority female resident pool (82% female), consistent with the broader assisted living trend where women significantly outnumber men.

82%

Female Residents — State Benchmarked 82% of residents are female, compared to the Maryland average of 69%. Women comprise the large majority, consistent with national assisted living demographics where women live longer and enter care facilities at higher rates.

100%

White Residents — State Benchmarked 100% of residents are reported as White, compared to the Maryland average of 81%. A higher White share than is typical for assisted living in Maryland in this dataset — compare with peer facilities for local context.

0%

African American Residents — State Benchmarked 0% of residents are reported as African American or Black, compared to the Maryland average of 13%. A lower African American share than is typical in Maryland; local markets still vary widely.

0%

Other Ethnicity Residents — State Benchmarked 0% of residents fall into categories other than White or African American (combined), compared to the Maryland average of 6%. This column aggregates Hispanic, Asian, multiracial, and any other labeled groups that are not classified as White or African American.

-
13%

Residents Age 75–84 — State Benchmarked 13% of residents are 75–84, compared to the Maryland average of 31%. Below the state norm — the resident mix may skew either younger or older than this typical middle bracket.

53%

Residents Age 85–94 — State Benchmarked 53% of residents are 85–94, compared to the Maryland average of 44%. A high concentration of very elderly residents signals a higher-acuity facility with experience caring for advanced age-related needs.

35%

Residents Age 95+ — State Benchmarked 35% of residents are 95 or older, compared to the Maryland average of 16%. A high proportion of the oldest-old suggests strong end-of-life care experience and very-high-acuity capabilities.

Lutheran Village at Miller’s Grant
SC
AL
IL
NH
SNF
Ellicott City (Lutheran Village At Miller’s Grant)
36
Facility 36
MD AVG 42
Rank #230 / 685
Yes
19
Facility 19
MD AVG 43
Rank #746 / 985
1 Bed / 2 Bed
21
Facility 21
MD AVG 21
Rank #108 / 210
-
17%

Male Residents — State Benchmarked 17% of residents are male, compared to the Maryland average of 31%. This facility caters to a majority female resident pool (83% female), consistent with the broader assisted living trend where women significantly outnumber men.

83%

Female Residents — State Benchmarked 83% of residents are female, compared to the Maryland average of 69%. Women comprise the large majority, consistent with national assisted living demographics where women live longer and enter care facilities at higher rates.

83%

White Residents — State Benchmarked 83% of residents are reported as White, compared to the Maryland average of 81%. Close to the average for this category among assisted living facilities in Maryland with reported race/ethnicity data.

11%

African American Residents — State Benchmarked 11% of residents are reported as African American or Black, compared to the Maryland average of 13%. In line with the Maryland average for African American residents among facilities reporting this breakdown.

6%

Other Ethnicity Residents — State Benchmarked 6% of residents fall into categories other than White or African American (combined), compared to the Maryland average of 6%. This column aggregates Hispanic, Asian, multiracial, and any other labeled groups that are not classified as White or African American. Reported subgroups in this total: Asian (6%).

-
33%

Residents Age 75–84 — State Benchmarked 33% of residents are 75–84, compared to the Maryland average of 31%. This is the second most common age bracket in assisted living, representing residents with moderate care needs.

44%

Residents Age 85–94 — State Benchmarked 44% of residents are 85–94, compared to the Maryland average of 44%. This is typically the most common age bracket in assisted living — this facility is in line with the statewide norm.

22%

Residents Age 95+ — State Benchmarked 22% of residents are 95 or older, compared to the Maryland average of 16%. A high proportion of the oldest-old suggests strong end-of-life care experience and very-high-acuity capabilities.

Friends House Retirement Community
SC
AL
IL
NH
SNF
Sandy Spring
24
Facility 24
MD AVG 42
Rank #242 / 685
Yes
6
Facility 6
MD AVG 43
Rank #891 / 985
-
20
Facility 20
MD AVG 21
Rank #112 / 210
-
6%

Male Residents — State Benchmarked 6% of residents are male, compared to the Maryland average of 31%. This facility caters to a majority female resident pool (94% female), consistent with the broader assisted living trend where women significantly outnumber men.

94%

Female Residents — State Benchmarked 94% of residents are female, compared to the Maryland average of 69%. Women comprise the large majority, consistent with national assisted living demographics where women live longer and enter care facilities at higher rates.

94%

White Residents — State Benchmarked 94% of residents are reported as White, compared to the Maryland average of 81%. A higher White share than is typical for assisted living in Maryland in this dataset — compare with peer facilities for local context.

0%

African American Residents — State Benchmarked 0% of residents are reported as African American or Black, compared to the Maryland average of 13%. A lower African American share than is typical in Maryland; local markets still vary widely.

6%

Other Ethnicity Residents — State Benchmarked 6% of residents fall into categories other than White or African American (combined), compared to the Maryland average of 6%. This column aggregates Hispanic, Asian, multiracial, and any other labeled groups that are not classified as White or African American. Reported subgroups in this total: Asian (6%).

6%

Residents Age 65–74 — State Benchmarked 6% of residents are 65–74, compared to the Maryland average of 13%. Fewer younger seniors suggests the resident population skews older, likely requiring higher acuity care and more hands-on support.

18%

Residents Age 75–84 — State Benchmarked 18% of residents are 75–84, compared to the Maryland average of 31%. Below the state norm — the resident mix may skew either younger or older than this typical middle bracket.

53%

Residents Age 85–94 — State Benchmarked 53% of residents are 85–94, compared to the Maryland average of 44%. A high concentration of very elderly residents signals a higher-acuity facility with experience caring for advanced age-related needs.

24%

Residents Age 95+ — State Benchmarked 24% of residents are 95 or older, compared to the Maryland average of 16%. A high proportion of the oldest-old suggests strong end-of-life care experience and very-high-acuity capabilities.

Sunrise of Rockville
SC
AL
HOS
MC
Rockville (Baltimore Road)
89
Facility 89
MD AVG 42
Rank #150 / 685
Yes
89
Facility 89
MD AVG 43
Rank #32 / 985
Studio / 1 Bed / 2 Bed
45
Facility 45
MD AVG 21
Rank #4 / 210
A-
23%

Male Residents — State Benchmarked 23% of residents are male, compared to the Maryland average of 31%. This facility caters to a majority female resident pool (77% female), consistent with the broader assisted living trend where women significantly outnumber men.

77%

Female Residents — State Benchmarked 77% of residents are female, compared to the Maryland average of 69%. Women comprise the large majority, consistent with national assisted living demographics where women live longer and enter care facilities at higher rates.

87%

White Residents — State Benchmarked 87% of residents are reported as White, compared to the Maryland average of 81%. Close to the average for this category among assisted living facilities in Maryland with reported race/ethnicity data.

2%

African American Residents — State Benchmarked 2% of residents are reported as African American or Black, compared to the Maryland average of 13%. A lower African American share than is typical in Maryland; local markets still vary widely.

11%

Other Ethnicity Residents — State Benchmarked 11% of residents fall into categories other than White or African American (combined), compared to the Maryland average of 6%. This column aggregates Hispanic, Asian, multiracial, and any other labeled groups that are not classified as White or African American. Reported subgroups in this total: Mixed Race (6%), Hispanic (3%), Asian (2%).

3%

Residents Age 65–74 — State Benchmarked 3% of residents are 65–74, compared to the Maryland average of 13%. Fewer younger seniors suggests the resident population skews older, likely requiring higher acuity care and more hands-on support.

31%

Residents Age 75–84 — State Benchmarked 31% of residents are 75–84, compared to the Maryland average of 31%. This is the second most common age bracket in assisted living, representing residents with moderate care needs.

56%

Residents Age 85–94 — State Benchmarked 56% of residents are 85–94, compared to the Maryland average of 44%. A high concentration of very elderly residents signals a higher-acuity facility with experience caring for advanced age-related needs.

10%

Residents Age 95+ — State Benchmarked 10% of residents are 95 or older, compared to the Maryland average of 16%. Most residents here have not yet reached the oldest-old bracket, suggesting a younger overall community.
Maplewood Park Place
SC
AL
IL
MC
NH
SNF
Bethesda (Pooks Hill)
29
Facility 29
MD AVG 42
Rank #240 / 685
Yes
38
Facility 38
MD AVG 43
Rank #542 / 985
1 Bed / 2 Bed
30
Facility 30
MD AVG 21
Rank #44 / 210
-
18%

Male Residents — State Benchmarked 18% of residents are male, compared to the Maryland average of 31%. This facility caters to a majority female resident pool (82% female), consistent with the broader assisted living trend where women significantly outnumber men.

82%

Female Residents — State Benchmarked 82% of residents are female, compared to the Maryland average of 69%. Women comprise the large majority, consistent with national assisted living demographics where women live longer and enter care facilities at higher rates.

100%

White Residents — State Benchmarked 100% of residents are reported as White, compared to the Maryland average of 81%. A higher White share than is typical for assisted living in Maryland in this dataset — compare with peer facilities for local context.

0%

African American Residents — State Benchmarked 0% of residents are reported as African American or Black, compared to the Maryland average of 13%. A lower African American share than is typical in Maryland; local markets still vary widely.

0%

Other Ethnicity Residents — State Benchmarked 0% of residents fall into categories other than White or African American (combined), compared to the Maryland average of 6%. This column aggregates Hispanic, Asian, multiracial, and any other labeled groups that are not classified as White or African American.

-
6%

Residents Age 75–84 — State Benchmarked 6% of residents are 75–84, compared to the Maryland average of 31%. Below the state norm — the resident mix may skew either younger or older than this typical middle bracket.

24%

Residents Age 85–94 — State Benchmarked 24% of residents are 85–94, compared to the Maryland average of 44%. The population here skews younger than the statewide norm, which may indicate a more active, lower-acuity community.
71%

Residents Age 95+ — State Benchmarked 71% of residents are 95 or older, compared to the Maryland average of 16%. A high proportion of the oldest-old suggests strong end-of-life care experience and very-high-acuity capabilities.

Ingleside at King Farm
SC
AL
IL
MC
NH
SNF
Rockville (King Farm)
45
Facility 45
MD AVG 42
Rank #219 / 685
Yes
73
Facility 73
MD AVG 43
Rank #152 / 985
1 Bed / 2 Bed-----------
Homewood Living Frederick
SC
AL
IL
MC
NH
SNF
Frederick
120
Facility 120
MD AVG 42
Rank #73 / 685
Yes
14
Facility 14
MD AVG 43
Rank #788 / 985
1 Bed / 2 Bed-----------
Residences at Vantage Point
SC
AL
HC
IL
MC
NH
SNF
Columbia (Town Center)
44
Facility 44
MD AVG 42
Rank #222 / 685
Yes
52
Facility 52
MD AVG 43
Rank #402 / 985
Studio / 1 Bed / 2 Bed
36
Facility 36
MD AVG 21
Rank #16 / 210
----------
Buckingham‘s Choice
SC
AL
MC
NH
RC
SNF
Adamstown (Baker Circle)
42
Facility 42
MD AVG 42
Rank #223 / 685
No
3
Facility 3
MD AVG 43
Rank #930 / 985
Private Rooms
31
Facility 31
MD AVG 21
Rank #39 / 210
----------
Sunrise of Pikesville
SC
NH
AL
HOS
MC
Pikesville (Old Court Road)
96
Facility 96
MD AVG 42
Rank #131 / 685
Yes
75
Facility 75
MD AVG 43
Rank #131 / 985
Studio / 1 Bed / 2 Bed
45
Facility 45
MD AVG 21
Rank #4 / 210
A-
30%

Male Residents — State Benchmarked 30% of residents are male, compared to the Maryland average of 31%. This facility caters to a majority female resident pool (70% female), consistent with the broader assisted living trend where women significantly outnumber men.

70%

Female Residents — State Benchmarked 70% of residents are female, compared to the Maryland average of 69%. Women comprise the large majority, consistent with national assisted living demographics where women live longer and enter care facilities at higher rates.

63%

White Residents — State Benchmarked 63% of residents are reported as White, compared to the Maryland average of 81%. A lower White share than the Maryland average — the community may draw a more diverse resident mix relative to other facilities in Maryland.

37%

African American Residents — State Benchmarked 37% of residents are reported as African American or Black, compared to the Maryland average of 13%. A higher African American share than the typical Maryland average — useful context when comparing cultural fit and community composition.

0%

Other Ethnicity Residents — State Benchmarked 0% of residents fall into categories other than White or African American (combined), compared to the Maryland average of 6%. This column aggregates Hispanic, Asian, multiracial, and any other labeled groups that are not classified as White or African American.

15%

Residents Age 65–74 — State Benchmarked 15% of residents are 65–74, compared to the Maryland average of 13%. In line with the statewide profile for this youngest senior bracket in assisted living.

27%

Residents Age 75–84 — State Benchmarked 27% of residents are 75–84, compared to the Maryland average of 31%. This is the second most common age bracket in assisted living, representing residents with moderate care needs.

41%

Residents Age 85–94 — State Benchmarked 41% of residents are 85–94, compared to the Maryland average of 44%. This is typically the most common age bracket in assisted living — this facility is in line with the statewide norm.

15%

Residents Age 95+ — State Benchmarked 15% of residents are 95 or older, compared to the Maryland average of 16%. In line with the statewide profile for the oldest resident bracket.

Brighton Gardens of Friendship Heights
SC
AL
HOS
MC
Chevy Chase (Friendship Boulevard)
154
Facility 154
MD AVG 42
Rank #39 / 685
Yes
86
Facility 86
MD AVG 43
Rank #47 / 985
Studio / 1 Bed / 2 Bed
29
Facility 29
MD AVG 21
Rank #48 / 210
-
20%

Male Residents — State Benchmarked 20% of residents are male, compared to the Maryland average of 31%. This facility caters to a majority female resident pool (80% female), consistent with the broader assisted living trend where women significantly outnumber men.

80%

Female Residents — State Benchmarked 80% of residents are female, compared to the Maryland average of 69%. Women comprise the large majority, consistent with national assisted living demographics where women live longer and enter care facilities at higher rates.

96%

White Residents — State Benchmarked 96% of residents are reported as White, compared to the Maryland average of 81%. A higher White share than is typical for assisted living in Maryland in this dataset — compare with peer facilities for local context.

1%

African American Residents — State Benchmarked 1% of residents are reported as African American or Black, compared to the Maryland average of 13%. A lower African American share than is typical in Maryland; local markets still vary widely.

3%

Other Ethnicity Residents — State Benchmarked 3% of residents fall into categories other than White or African American (combined), compared to the Maryland average of 6%. This column aggregates Hispanic, Asian, multiracial, and any other labeled groups that are not classified as White or African American. Reported subgroups in this total: Asian (2%), Hispanic (1%).

3%

Residents Age 65–74 — State Benchmarked 3% of residents are 65–74, compared to the Maryland average of 13%. Fewer younger seniors suggests the resident population skews older, likely requiring higher acuity care and more hands-on support.

31%

Residents Age 75–84 — State Benchmarked 31% of residents are 75–84, compared to the Maryland average of 31%. This is the second most common age bracket in assisted living, representing residents with moderate care needs.

49%

Residents Age 85–94 — State Benchmarked 49% of residents are 85–94, compared to the Maryland average of 44%. A high concentration of very elderly residents signals a higher-acuity facility with experience caring for advanced age-related needs.

15%

Residents Age 95+ — State Benchmarked 15% of residents are 95 or older, compared to the Maryland average of 16%. In line with the statewide profile for the oldest resident bracket.

Sunrise of Frederick
SC
AL
MC
Frederick (Waterford)
88
Facility 88
MD AVG 42
Rank #152 / 685
Yes
62
Facility 62
MD AVG 43
Rank #286 / 985
Studio / Suite / 2 Bed
45
Facility 45
MD AVG 21
Rank #4 / 210
A-
31%

Male Residents — State Benchmarked 31% of residents are male, compared to the Maryland average of 31%. This facility caters to a majority female resident pool (69% female), consistent with the broader assisted living trend where women significantly outnumber men.

69%

Female Residents — State Benchmarked 69% of residents are female, compared to the Maryland average of 69%. Women comprise the large majority, consistent with national assisted living demographics where women live longer and enter care facilities at higher rates.

97%

White Residents — State Benchmarked 97% of residents are reported as White, compared to the Maryland average of 81%. A higher White share than is typical for assisted living in Maryland in this dataset — compare with peer facilities for local context.

2%

African American Residents — State Benchmarked 2% of residents are reported as African American or Black, compared to the Maryland average of 13%. A lower African American share than is typical in Maryland; local markets still vary widely.

2%

Other Ethnicity Residents — State Benchmarked 2% of residents fall into categories other than White or African American (combined), compared to the Maryland average of 6%. This column aggregates Hispanic, Asian, multiracial, and any other labeled groups that are not classified as White or African American. Reported subgroups in this total: Hispanic (2%).

10%

Residents Age 65–74 — State Benchmarked 10% of residents are 65–74, compared to the Maryland average of 13%. Fewer younger seniors suggests the resident population skews older, likely requiring higher acuity care and more hands-on support.

34%

Residents Age 75–84 — State Benchmarked 34% of residents are 75–84, compared to the Maryland average of 31%. This is the second most common age bracket in assisted living, representing residents with moderate care needs.

48%

Residents Age 85–94 — State Benchmarked 48% of residents are 85–94, compared to the Maryland average of 44%. This is typically the most common age bracket in assisted living — this facility is in line with the statewide norm.

6%

Residents Age 95+ — State Benchmarked 6% of residents are 95 or older, compared to the Maryland average of 16%. Most residents here have not yet reached the oldest-old bracket, suggesting a younger overall community.
Autumn Lake Healthcare at Riverview
SC
HOS
NH
PC
RC
SNF
Essex
238
Facility 238
MD AVG 42
Rank #5 / 685
No
61
Facility 61
MD AVG 43
Rank #301 / 985
------------
Sterling Care Hillhaven Assisted Living and Memory Care
SC
AL
HOS
MC
NH
SNF
Adelphi (Knollwood)
66
Facility 66
MD AVG 42
Rank #188 / 685
No
25
Facility 25
MD AVG 43
Rank #684 / 985
Studio / 1 Bed-----------
Rows per page:
View all Nearby Homes

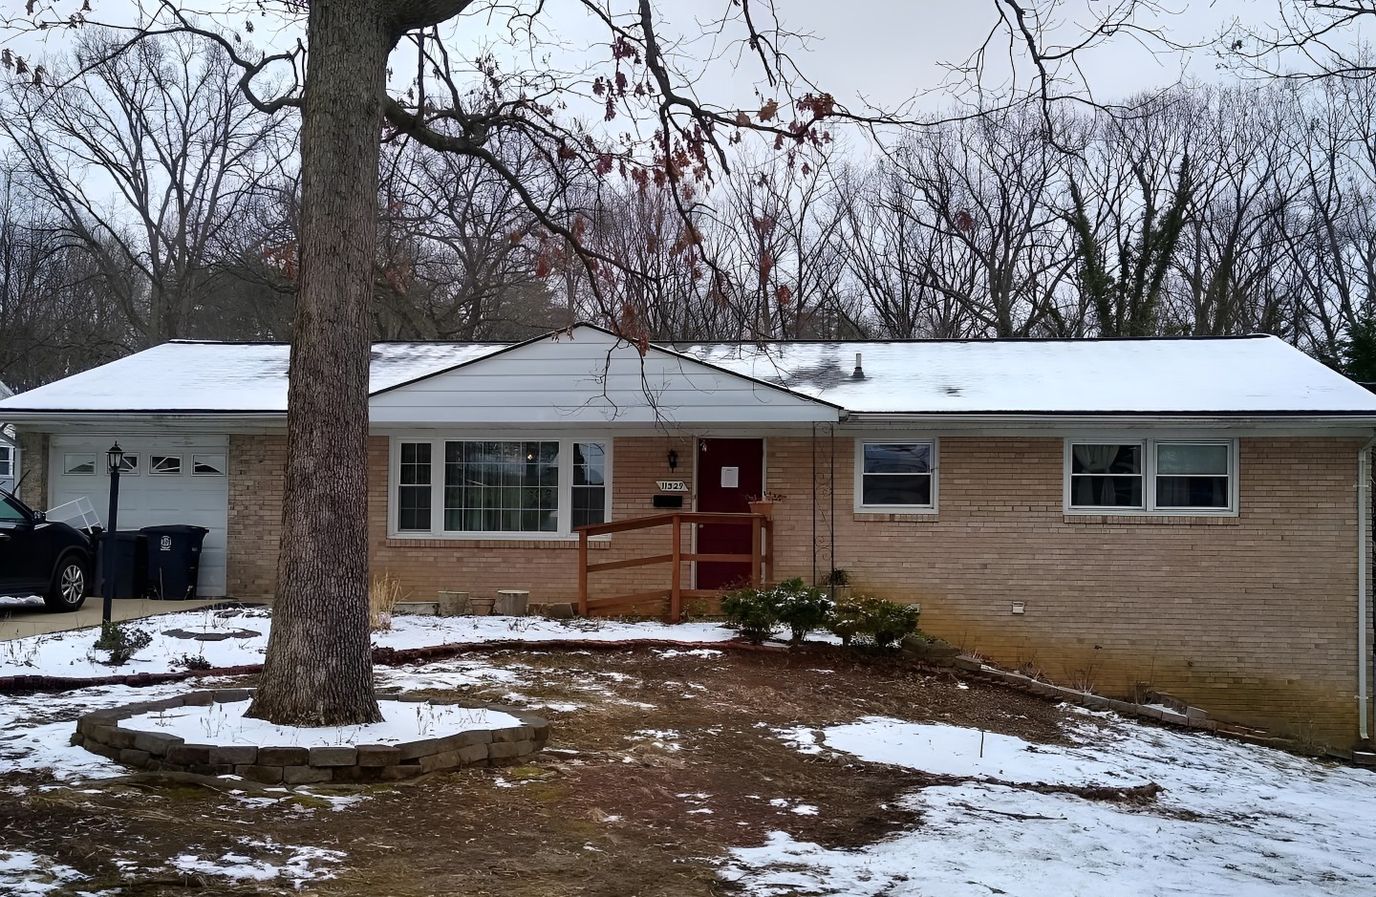
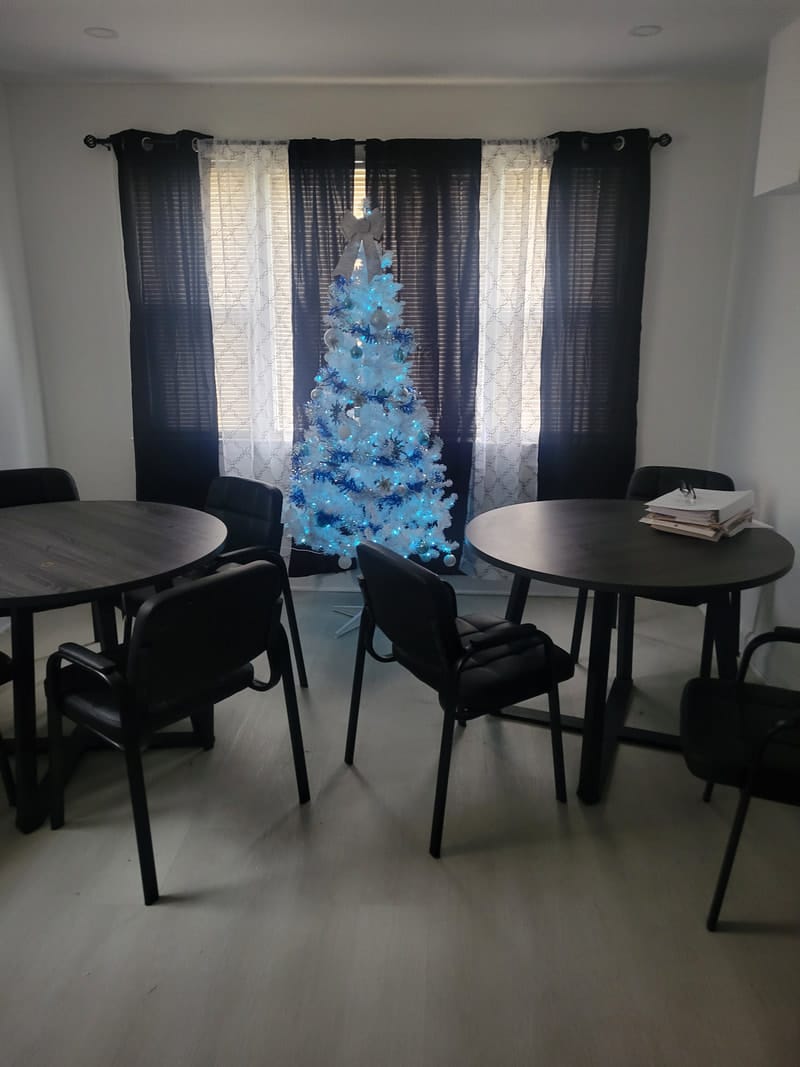
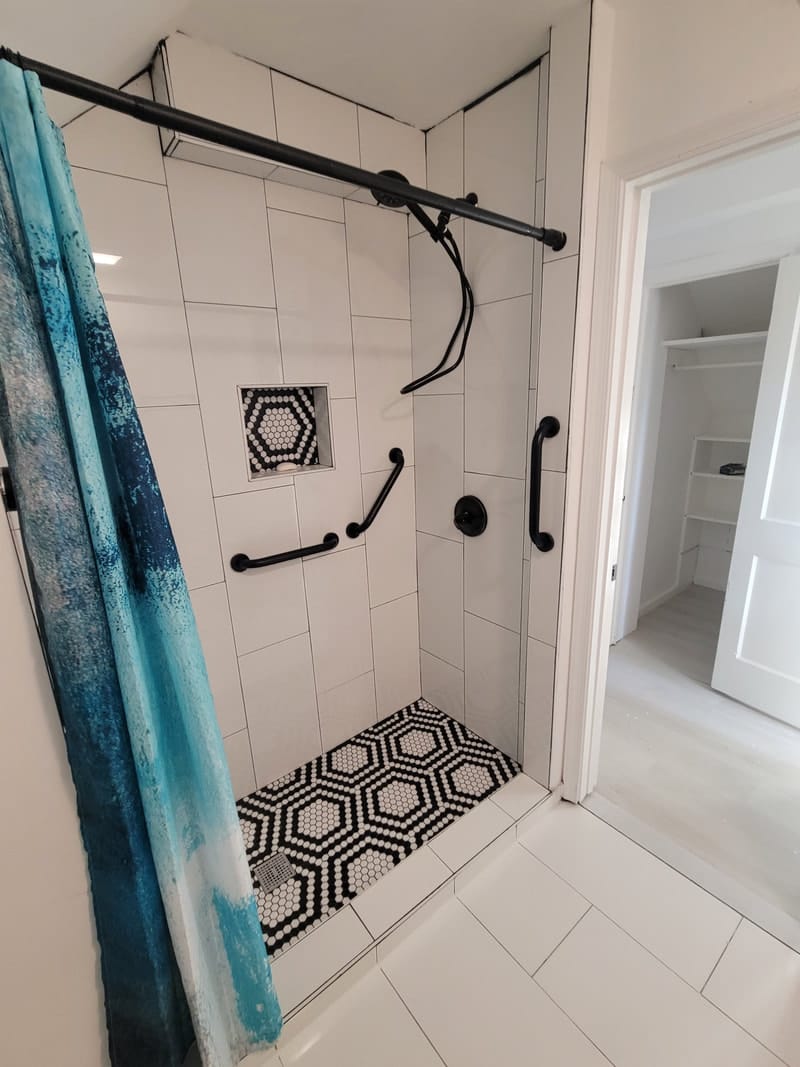
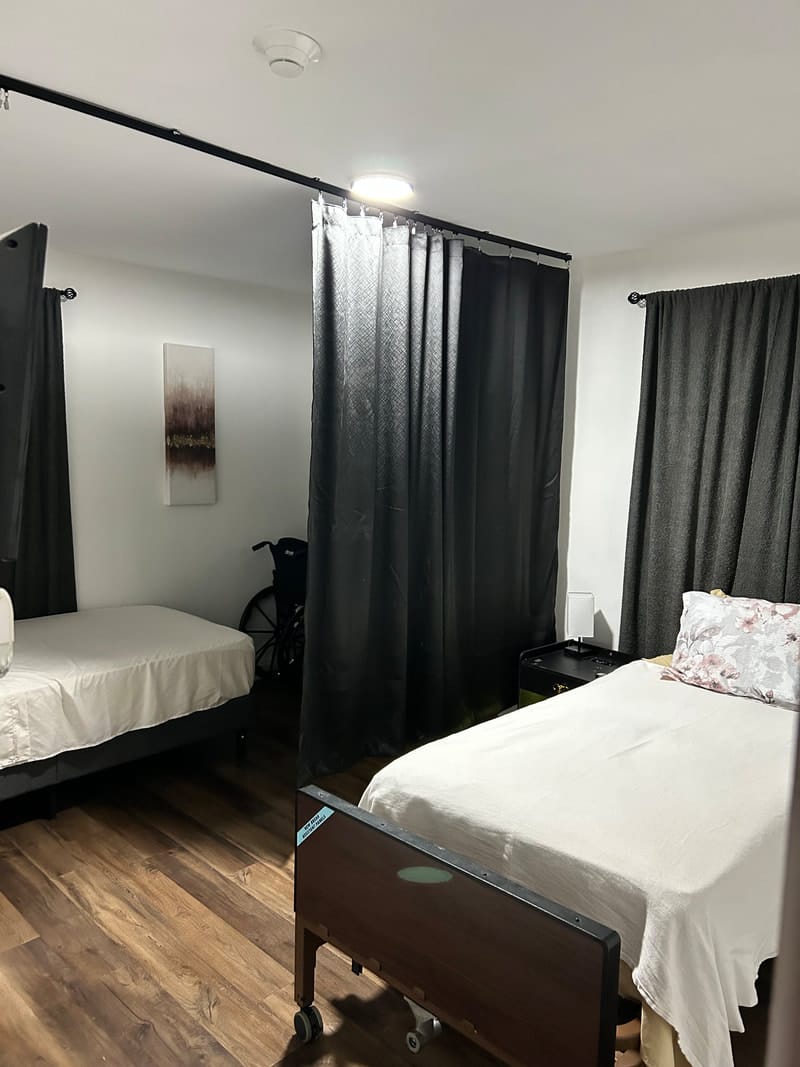
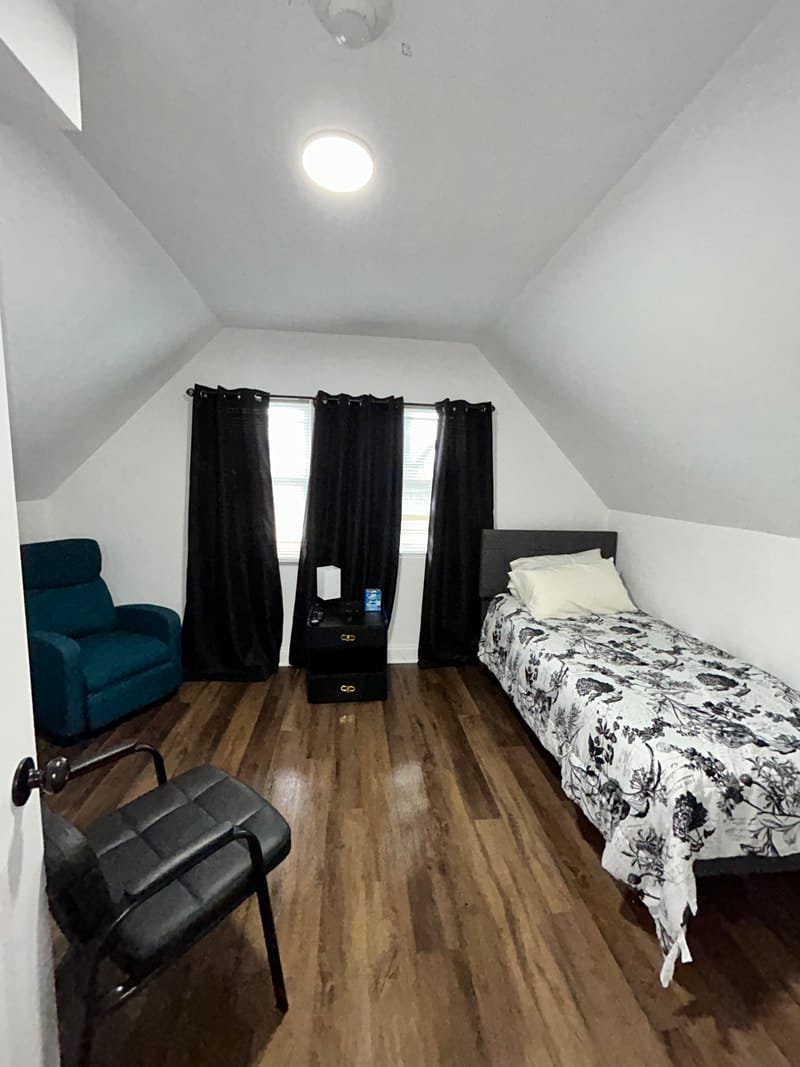
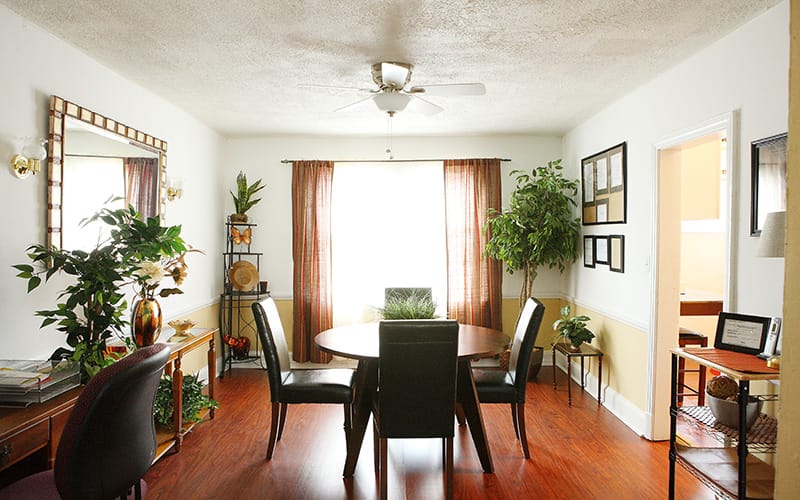
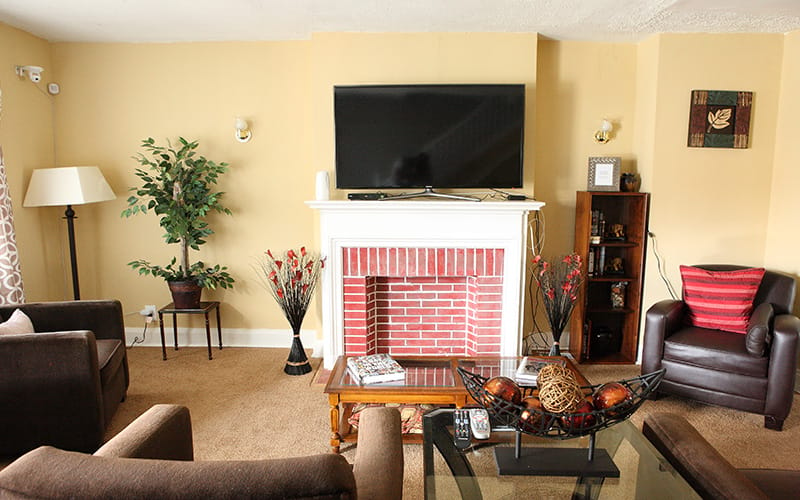
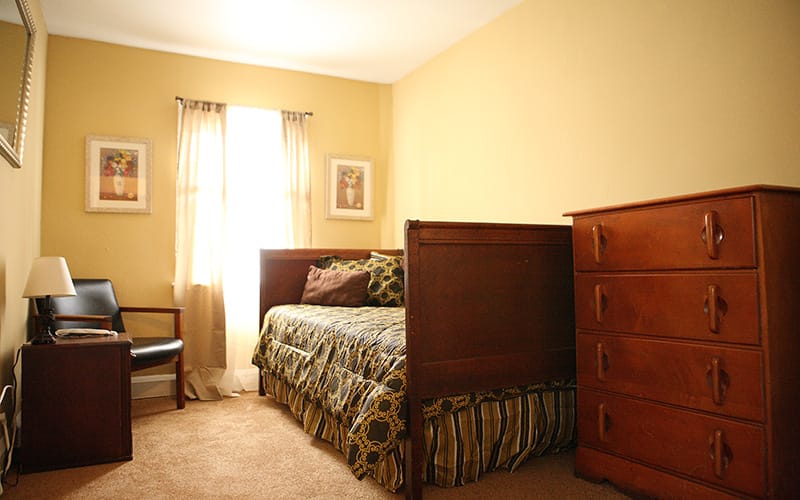
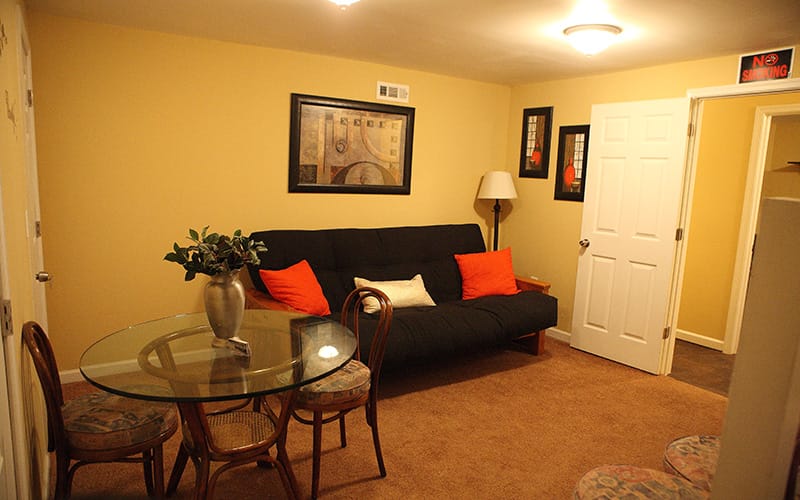
Fine Living Care I

4605 Navy Day Pl, Hillcrest Heights, MD 20746
Overview of Fine Living Care I

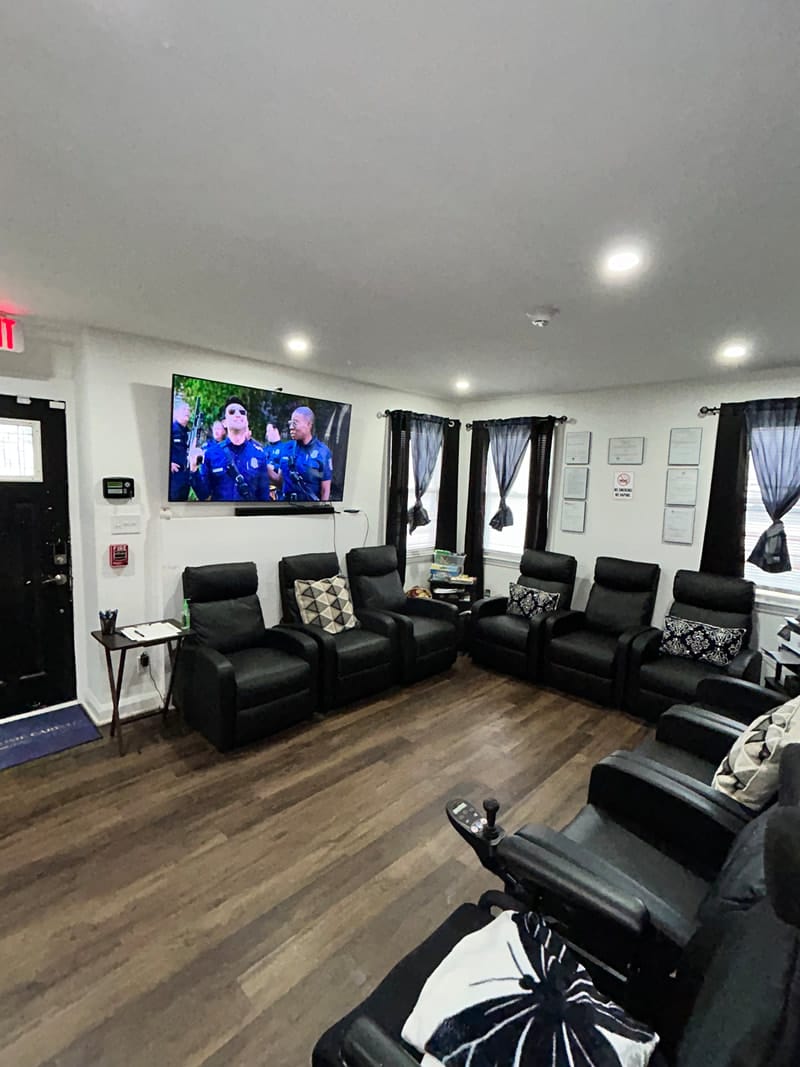
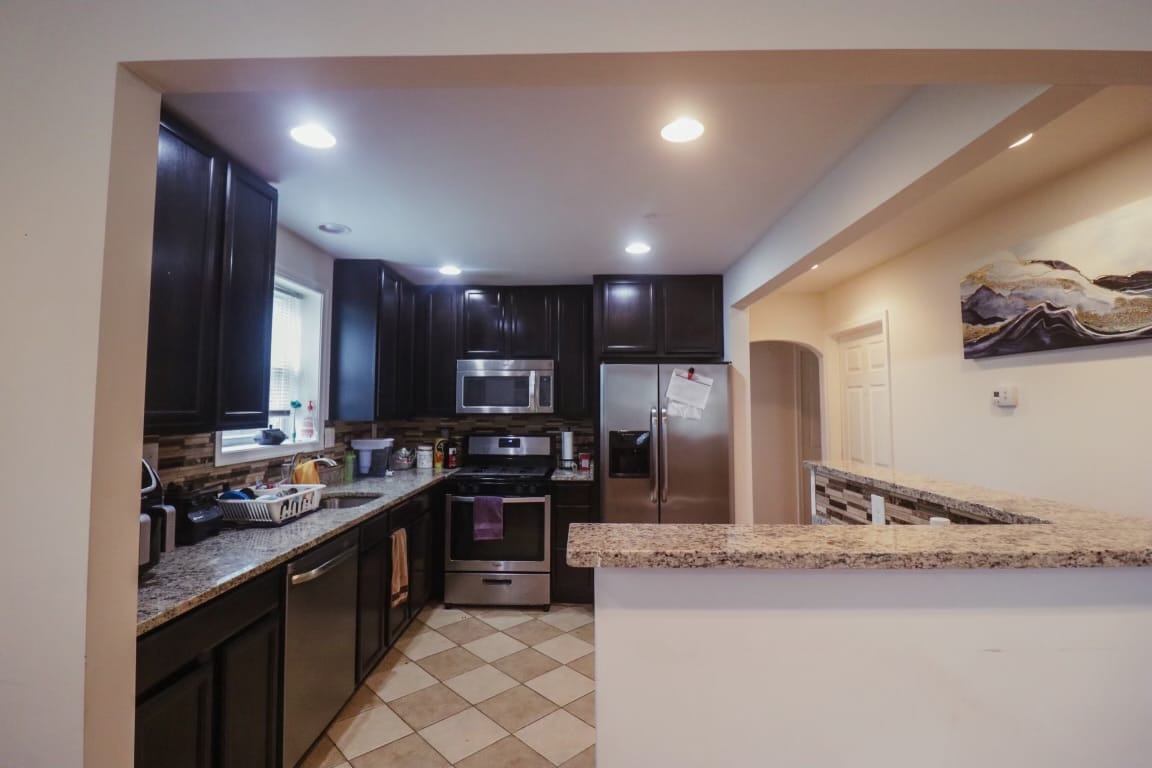
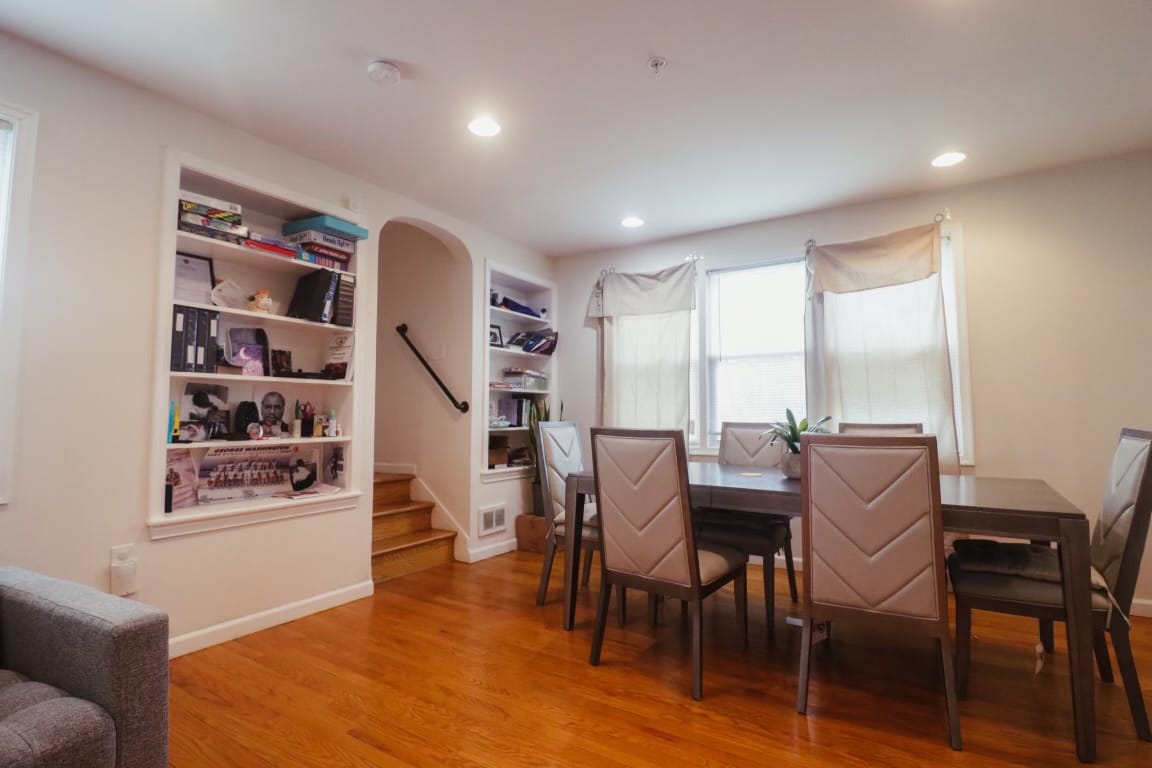
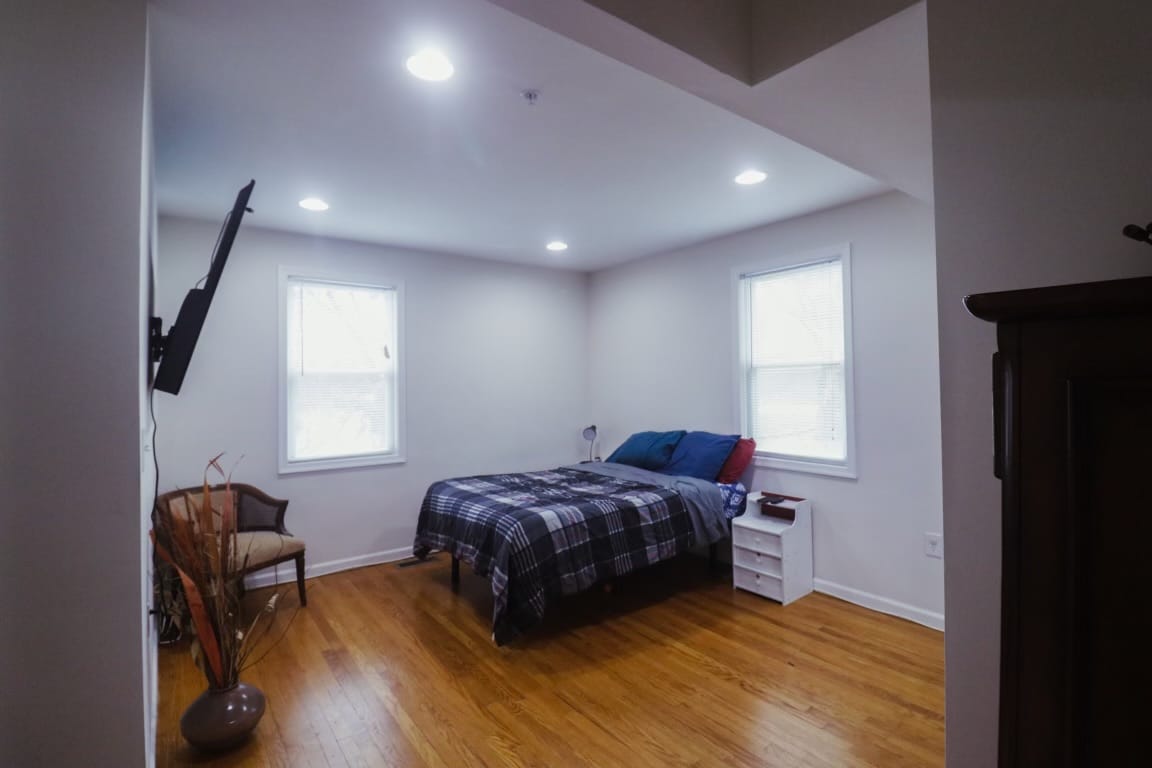
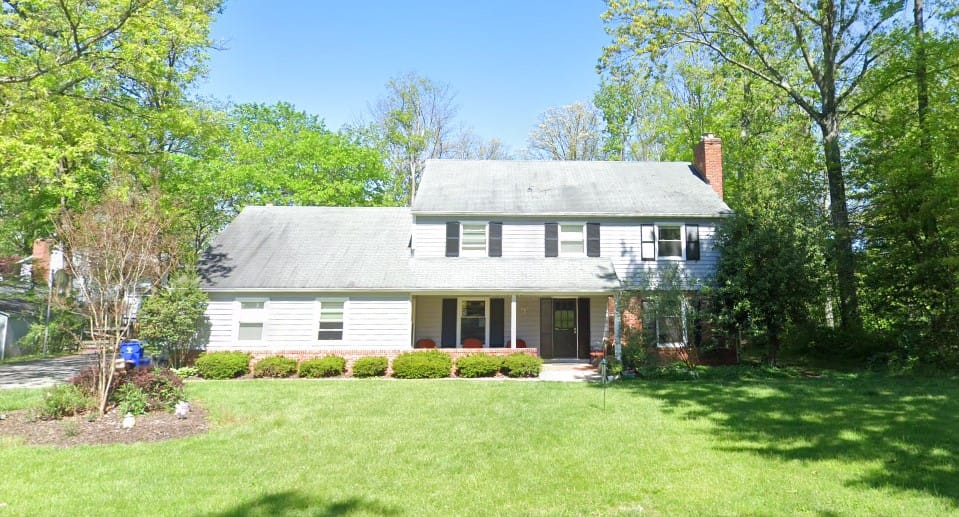
Fine Living Care I is an outstanding senior living community set in the idyllic neighborhood of Navy Day Place Suitland, MD, providing assisted living and respite care. With its commitment to residents’ welfare, the community features 24-hour care from a team of licensed and well-trained professionals within a welcoming and peaceful environment. Here, residents have more time to do the things they love with the community, caring for their daily living activities, housekeeping, and medication.

Promoting strong family relationships and an active lifestyle, the community encourages families to visit while ensuring residents do not get bored with various activities daily. Meals are enjoyed with friends and satisfy their dietary needs and tastes. The community strives to retain residents’ independence with the right balance of care for their comfort.

Contact Fine Living Care I

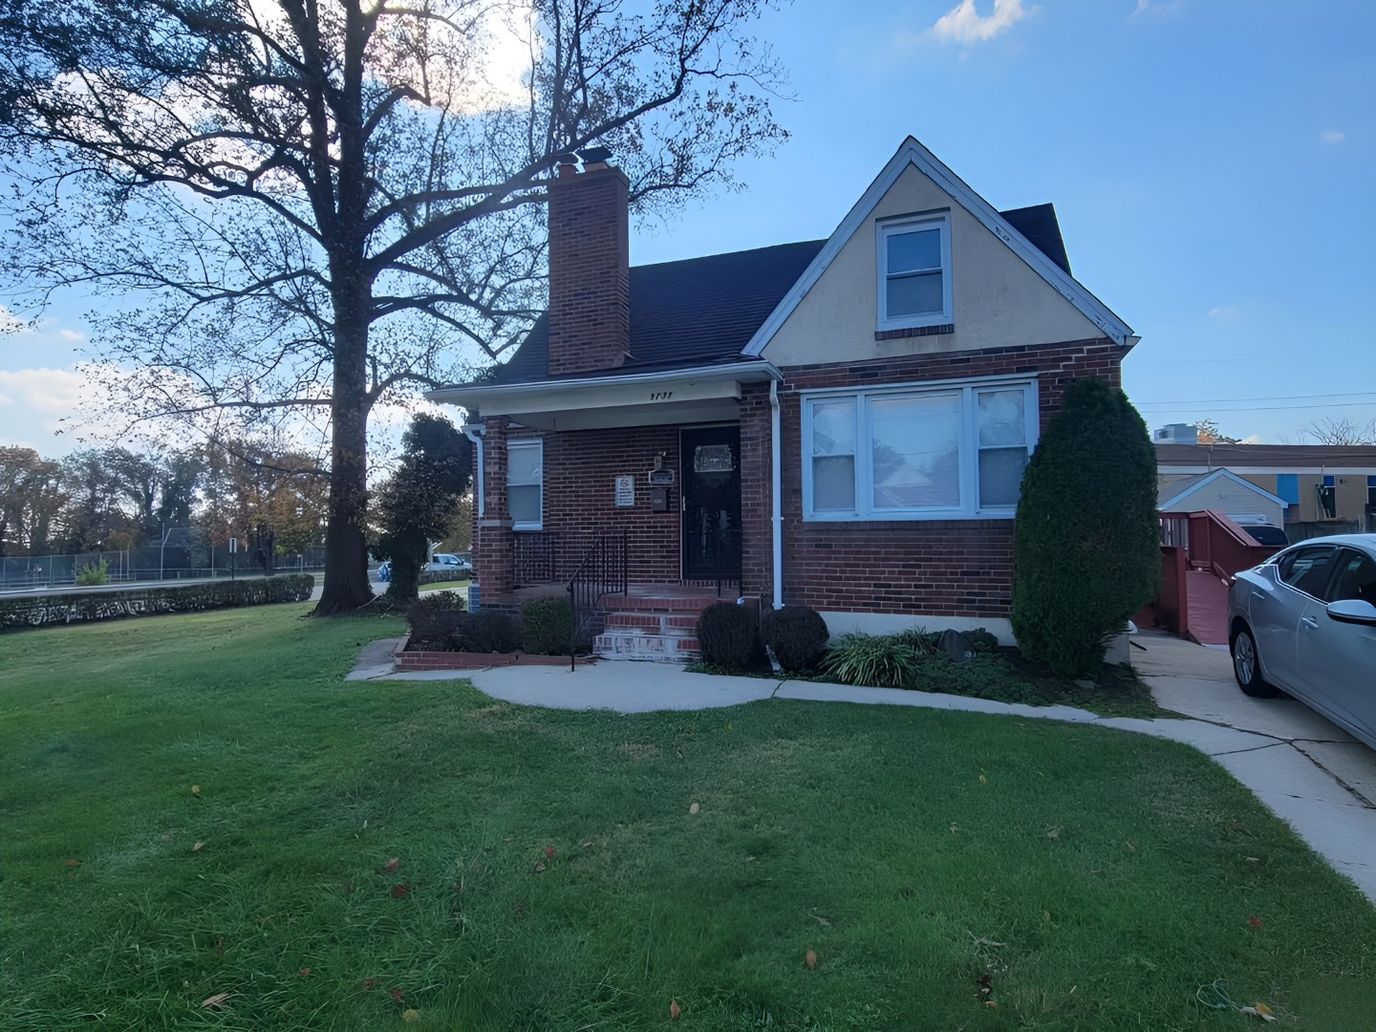
Bryant Woods Manor

10461 Waterfowl Ter, Columbia, MD 21044
Overview of Bryant Woods Manor

Situated amidst the suburban beauty and friendly neighborhood of Columbia, Maryland, Bryant Woods Manor emerges as a trusted option for seniors seeking assisted living and memory care. The community’s allure lies in its location, granting residents easy access to everyday local conveniences. Positioned just across from Wilde Lake, it exudes a serene atmosphere appreciated by all.

Bryant Woods Manor also boasts a team of in-house professionals, including a podiatrist, ophthalmologist, physician, and more, ensuring prompt attention to the urgent and essential needs of its seniors. Notably, the community takes pride in its homely ambiance, a characteristic favored by many over a more modernized and institutional environment. Residents can savor moments of relaxation and meaningful conversations while enjoying tea on the cozy outdoor porch or within the well-lit living room. The familial atmosphere cultivated here fosters a sense of belonging, ensuring that seniors and their families experience every moment with ease.

Contact Bryant Woods Manor

Overview of Harmony at Enterprise

A 102-bed mid-rise in Bowie, Maryland. Harmony at Enterprise sits at 12000 Traditions Blvd in Prince George’s County, offering independent living and assisted living in studio, one-bedroom, and two-bedroom apartments that range from 325 to 1,189 square feet. The upper end of that range is substantial; two-bedroom layouts approaching 1,200 square feet give couples or residents who need more space a real option. Pets are welcome.

The community and its surrounding area have a Walk Score of 7. This is a fully car-dependent address. The nearest hospital is about 10 miles out. Residents and families need their own transportation or must rely on the on-site shuttle for most movement.

Services include 24-hour staffing, nursing services, rehabilitation services, and respite care. Dining is restaurant-style. The amenity footprint covers a movie theater, bistro, library, game room, and walking paths. An activities calendar is in place.

The facility does not hold CMS certification for Medicare or Medicaid, which is standard for Maryland-licensed assisted living communities operating outside the federal certification system. Costs are private pay.

A 102-bed IL/AL community in suburban Prince George’s County with a large apartment range, pet-friendly policy, and private-pay structure: that is the factual picture this profile establishes.

Contact Harmony at Enterprise

Overview of Brightview Columbia

Nestled in the vibrant town of Columbia, MD, the Brightview Columbia is a remarkable senior living community that provides independent living, assisted living, and memory care services. Beautifully appointed and spacious accommodations with varying floor plans are available for its residents based on their preferences. In terms of memory care, this community offers innovative memory care services through its Wellspring Village Neighborhood for those with cognitive conditions.

As an award-winning community for senior living experience, it is committed to delivering exceptional amenities and services. Indulge in delightful and healthy chef-prepared meals daily, beauty salon, fitness room, and art studio. Explore its beautifully designed common spaces such as the courtyard and outdoor gardens. Have fun in its interactive full-packed programs and activities to further social engagement. With Brightview Columbia, seniors are guaranteed a glorious living experience.

Contact Brightview Columbia

Overview of Autumn Lake Healthcare at Summit Park

Autumn Lake Healthcare at Summit Park, situated at 1502 Frederick Road in Catonsville’s Frederick Road neighborhood of Baltimore County, Maryland, is a 134-bed facility independently owned and operated.

The community draws residents across a mixed-payer model: 83.6% of current residents are Medicaid-funded long-term care patients, while new admissions also include Medicare short-term rehabilitation patients and private-pay residents. Occupancy reaches 83.6%, tracking above the Maryland average and signaling stable market demand.

The facility carries a 1-star overall CMS rating, driven primarily by health inspections that run 64.5% below state performance benchmarks. Staffing resources similarly lag: nursing hours total 3 hours 16 minutes per resident daily; 14% below state averages.

A civil money penalty of $49,000 was imposed in November 2023 for regulatory violations. These structural limitations coexist, however, with clinical quality metrics that exceed state performance by 8.2%, a tension that underscores the challenge of achieving good outcomes despite constrained resources.

Falls with major injury occur in just 1.0% of long-stay residents, 58% better than the state average. Urinary tract infections are absent entirely; 100% better than the state benchmark. High-risk clinical events and functional decline scores both run approximately 13% better than state comparators, indicating effective nursing intervention despite lower staffing hours. Pressure ulcer prevalence, however, stands at 9.9%; 51% worse than the state average of 6.5%.

The therapeutic and clinical program depth includes physical, occupational, and speech therapy; respiratory care; wound care; post-operative support; and management protocols for diabetes and chronic pain.

The physical environment features private and semi-private rooms, a salon, a central dining room, and an inner garden sanctuary.

The community’s current payer mix of predominantly Medicaid long-term residents with supplementary short-term rehabilitation and private-pay admissions shapes its orientation toward sustained institutional care in a mixed-acuity model.

The facility serves long-term Medicaid residents who can tolerate staffing constraints in exchange for stable placement and clinical outcomes that exceed broader state performance patterns.

Contact Autumn Lake Healthcare at Summit Park

Overview of Brooke Grove Retirement Village

ASSISTED LIVING AT BROOKEGROVE

NURTURING FREEDOM OF MOVEMENT, OF CHOICE, OF SELF-DISCOVERY

Nothing says “home” like a beloved pet greeting you … the aroma of baking brownies … the sound of a child laughing … and the many other comforting touches you’ll find in The Meadows and The Woods assisted living residences at Brooke Grove Retirement Village . Here, on a pastoral retreat in a convenient Montgomery County, Maryland, location, skilled assistance blends seamlessly with the welcome feeling of home.

… BECAUSE WHAT SURROUNDS YOU REALLY MATTERS.

AN INNOVATIVE APPROACH TO ASSISTED LIVING

Specifically designed for assisted living or memory support, each residential-style dwelling is home to only 16 residents. Over-sized windows and skylights allow natural light to warm and brighten each room. Community members gather in family rooms with fireplaces and pianos, game and craft rooms, intimate dining rooms and sunny decks.

Everything at Brooke Grove is intentionally designed to enhance lives. We do this through LIFE ®  principles and programming we’ve developed to create the cheerful atmosphere, opportunities for individual discovery, partnership with families and enriching experiences that set us apart.

At Brooke Grove, safety and security are paramount but not confining. With easy access to large courtyards, residents move freely inside and out, visiting our neighborhood homes, strolling winding paths, and enjoying our peaceful wooded setting. An ornamental Koi pond, flower and sensory gardens, and a playground for visiting children charm and entertain.

Those who live here continue to grow and learn, to participate in lifelong hobbies and explore new ones, to love and care for one another, and to feel a sense of purpose with each new day.

ASSISTED LIVING AMENITIES & SERVICES

 Five different residential-style homes with secure and stimulating environments that promote independence and choice
 24-hour licensed, professional staff
 Assistance with daily living tasks such as dressing, bathing, eating and taking medications
 Specially trained staff educated in assisting people with memory loss
 Spacious, private rooms with sitting areas and private baths (some efficiencies available)
 Three wholesome meals a day with delicious options
 Innovative LIFE® enrichment programming with meaningful activities and off-site excursions
 Access to outdoor gardens, walking paths and fish pond
 Linen, laundry and housekeeping services
 Occupational, physical and speech therapies
 Chaplaincy services and spiritual programs for all faiths
 Priority access to Brooke Grove’s rehabilitation and long-term care
Respite care to offer family members a break or a chance to experience Brooke Grove on a trial basis
 Full-time, licensed social worker

Contact Brooke Grove Retirement Village

Overview of Cantys Helping Hands

Canty’s Helping Hands offers affordable senior home care services to help individuals with daily tasks and maintain their independence at home care near me.

Their certified caregivers provide a wide range of non-medical services, ensuring clients feel safe and comfortable. This includes assistance with personal care like bathing and dressing, meal preparation that considers dietary needs, light housekeeping to maintain a clean environment, and transportation to appointments. They understand the importance of social interaction and offer companionship care to prevent social isolation. For families juggling caregiving responsibilities, Canty’s Helping Hands provides respite care, offering temporary relief.

Canty’s Helping Hands serves Baltimore City and surrounding counties. Licensed by the state, they prioritize compassionate care, treating clients with dignity and respect. Their caregivers are carefully screened and matched with clients based on personality and skill set. They will work with you to create a personalized care plan that promotes independence and improves quality of life.

Contact Cantys Helping Hands

Overview of Pleasant Garden Glenmore

Pleasant Garden Glenmore is an inviting senior living community delivering exceptional assisted living services to the neighborhood of Baltimore, MD. The community provides residents with an intimate living environment that caters to their individual needs and preferences with safety features throughout and easy to navigate spaces for their convenience and safety. A team of reliable professional caregivers are always on standby to offer various assistance and compassionate care that help residents maintain their independence.

The community partners with several local organizations to provide residents various opportunities to learn new skills and keep their minds stimulated and entertained, including intergenerational opportunities and seminars on various topics. Committed to helping its residents achieve their ultimate health and wellness goals, the community offers residents a comfortable, secure, and nurturing living environment that cultivates a pleasant living experience.

Contact Pleasant Garden Glenmore

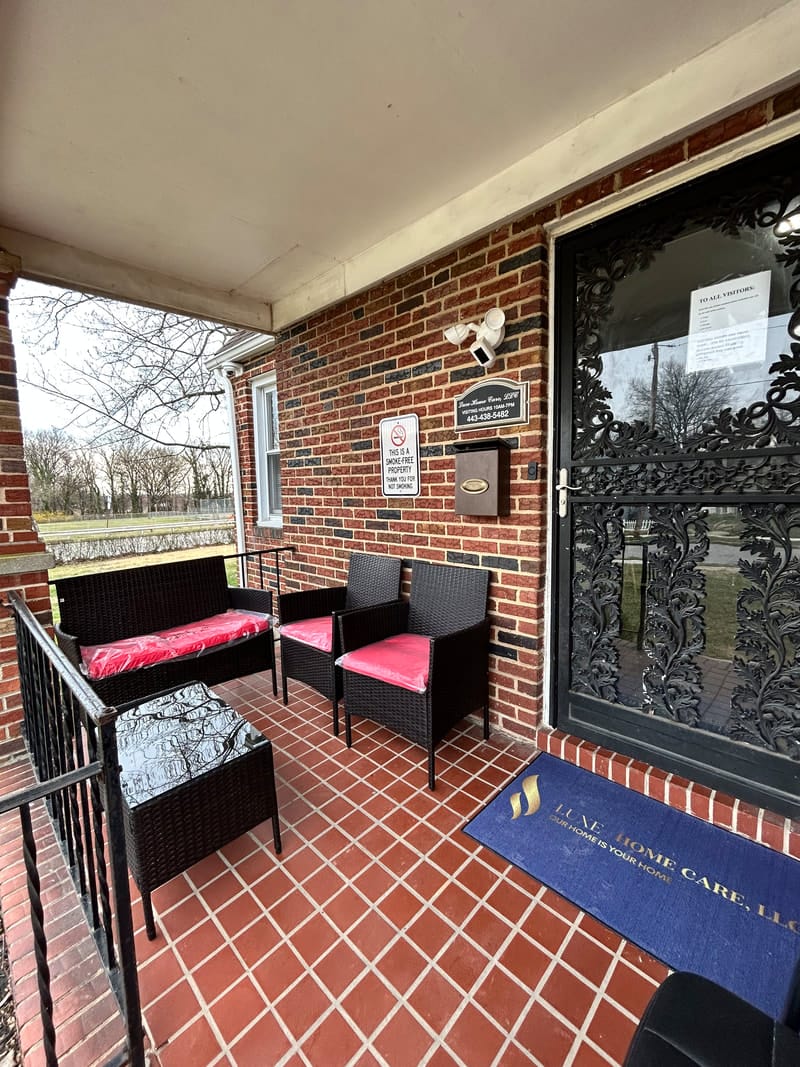
Overview of Caring for You Assisted Living III

Beautifully situated near Clifton Park in Baltimore, MD, Caring For You Assisted Living III LLC is a welcoming retreat that offers assisted living. With a respectful and well-trained team available around the clock, residents receive top-tier assistance for their daily living activities, including bathing and dressing. Cleaning, laundry, and other household chores are also taken care of, ensuring residents have a hassle-free lifestyle.

Enriching exercises and fun social events are conducted, encouraging residents to live actively and maintain social connections. Delicious and healthy dining options are also served to meet residents’ nutritional needs and tastes. Medication management is also provided for residents’ healthcare needs. The community is ideal for those needing assistance to live comfortably in retirement, especially with its supportive and friendly environment.

Contact Caring For You Assisted Living III, LLC

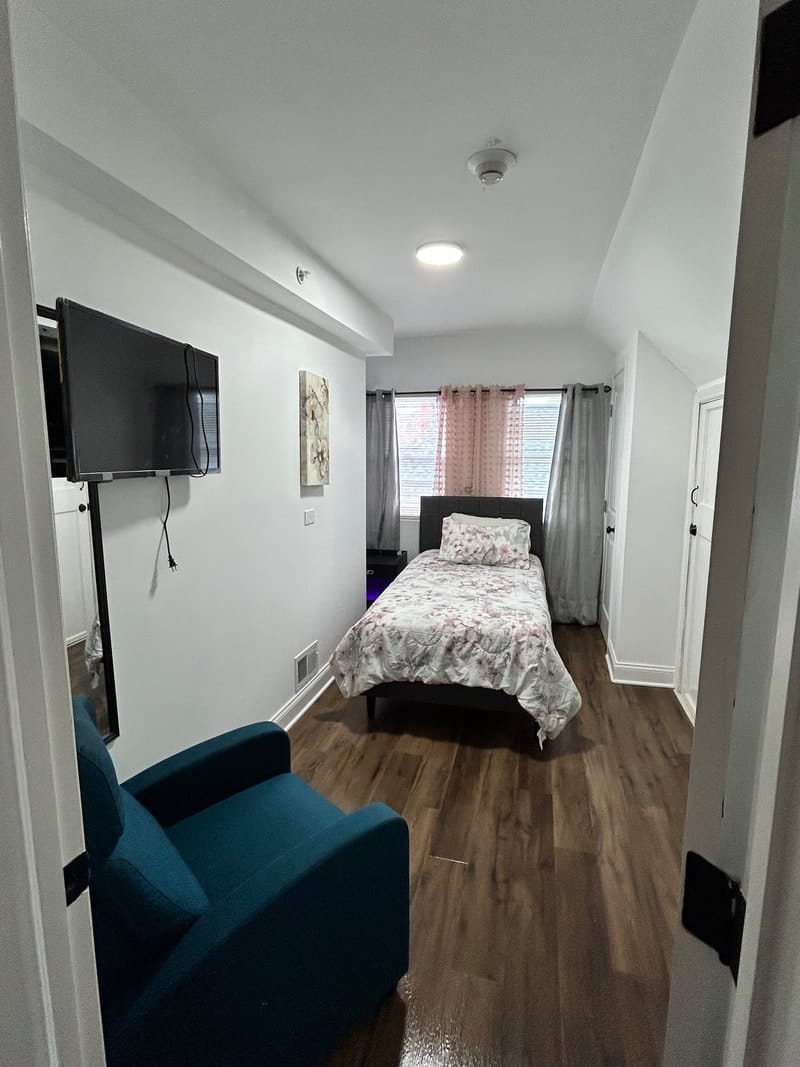
Overview of Palmer Home Care Facility

Live without worries at Palmer Home Care Facility, a distinct retreat in Baltimore, MD, that offers assisted living. Residents receive top-notch assistance for their daily living activities, including bathing and grooming, from a kind and highly skilled team available 24/7. With housekeeping and laundry services, residents have more time to do the things they love.

Fun recreational activities and exciting events are conducted, encouraging residents to live actively and maintain social connections. Residents have a delightful dining experience that satisfies their nutritional needs and preferences with a well-planned menu of healthy meals. With medication reminders, residents do not have to worry about their prescriptions. The community continuously promotes a vibrant and welcoming environment, ensuring residents reach their potential in retirement.

Contact Palmer Home Care Facility

Weighting overview

  • 35%
    Resident Experience
  • 25%
    Regulatory
  • 15%
    Visual Media
  • 10%
    Website
  • 10%
    Stability
  • 5%
    Environment
01

Resident & Family Experience 35%

The single largest share of every ranking. Aggregated review sentiment and volume from major platforms — the closest signal to real resident experience.

  • Includes
  • Review Sentiment
  • Review Volume
02

Regulatory & Safety Record 25%

State inspection records, citations, and complaint visits. We weight per-inspection rates more heavily than raw counts.

  • Includes
  • State Inspections
  • Citations/Inspection
  • % Inspections w/ Citations
  • Complaint Visits
  • Accreditations
  • BBB Rating
03

Visual Media & Transparency 15%

Communities that publish high-quality visuals give families a real preview. No photos or tours = a negative transparency signal.

  • Includes
  • Video Tours
  • Virtual Walkthroughs
  • Photo Quantity
  • Photo Quality
04

Website & Operator Transparency 10%

Site quality and whether the operator publishes basic accountability information — staff names, contact details, ownership.

  • Includes
  • Website Content
  • Mobile Usability
  • Staff Info Available
  • Owner Info Available
05

Community Stability 10%

Operational signals indicating whether a community is well-run and meeting demand.

  • Includes
  • Occupancy Rate
  • Bed Options
06

Environment & Pricing 5%

Walkability and pricing transparency. Walk Score is weighted higher for Independent Living than for Memory Care, where most residents do not leave unaccompanied.

  • Includes
  • Walk Score
  • Pricing Transparency
No paid rankings Communities cannot pay to influence placement.
How we're paid: If we help you find a community and you move in, that community may pay us a referral fee. This never affects where they rank or what you pay. Learn more
Submit a correction

Nearby Cities

Who we are

Your Senior Care Partner, Every Step of the Way

We help families find affordable senior communities and unlock same day discounts, Medicaid, and Medicare options tailored to your needs.

Contact us Today