Page 87 of Best Senior Care in Maryland

Why trust this guide? Our editorial team analyzed 997 senior care communities in MD using MD Dept. of Health (OHCQ) data, inspection records, complaints, amenities, and facility-level details. How we rank senior care in MD
Reviewed by
Last updated
Jul 2026
We analyzed
997 homes
Avg Walk Score: 43/ 100The average Walk Score across facilities in Maryland. A third-party neighborhood walkability score (0–100) measuring convenience and context, not healthcare quality. Individual facilities can vary widely from this average.
National Average: 50/ 100
Avg No. of Beds: 42The average licensed bed capacity across facilities in Maryland. Individual facilities can vary widely from this average.
National Average: 90

Compare Senior Care around Maryland

Info below is compiled from the MD Dept. of Health (OHCQ), senior community websites & trusted data sources such as Walk Score & BBB.

Communities are listed from highest to lowest based on our ranking methodology.

Bedford Court, a CCRC
SC
AL
HOS
IL
MC
NH
RC
SNF
Silver Spring (International Drive)
76
Facility 76
MD AVG 42
Rank #174 / 685
Yes
64
Facility 64
MD AVG 43
Rank #261 / 985
Studio / 1 Bed
34
Facility 34
MD AVG 21
Rank #22 / 210
-
15%

Male Residents — State Benchmarked 15% of residents are male, compared to the Maryland average of 31%. This facility caters to a majority female resident pool (85% female), consistent with the broader assisted living trend where women significantly outnumber men.

85%

Female Residents — State Benchmarked 85% of residents are female, compared to the Maryland average of 69%. Women comprise the large majority, consistent with national assisted living demographics where women live longer and enter care facilities at higher rates.

95%

White Residents — State Benchmarked 95% of residents are reported as White, compared to the Maryland average of 81%. A higher White share than is typical for assisted living in Maryland in this dataset — compare with peer facilities for local context.

3%

African American Residents — State Benchmarked 3% of residents are reported as African American or Black, compared to the Maryland average of 13%. A lower African American share than is typical in Maryland; local markets still vary widely.

2%

Other Ethnicity Residents — State Benchmarked 2% of residents fall into categories other than White or African American (combined), compared to the Maryland average of 6%. This column aggregates Hispanic, Asian, multiracial, and any other labeled groups that are not classified as White or African American. Reported subgroups in this total: Asian (2%).

2%

Residents Age 65–74 — State Benchmarked 2% of residents are 65–74, compared to the Maryland average of 13%. Fewer younger seniors suggests the resident population skews older, likely requiring higher acuity care and more hands-on support.

8%

Residents Age 75–84 — State Benchmarked 8% of residents are 75–84, compared to the Maryland average of 31%. Below the state norm — the resident mix may skew either younger or older than this typical middle bracket.

65%

Residents Age 85–94 — State Benchmarked 65% of residents are 85–94, compared to the Maryland average of 44%. A high concentration of very elderly residents signals a higher-acuity facility with experience caring for advanced age-related needs.

26%

Residents Age 95+ — State Benchmarked 26% of residents are 95 or older, compared to the Maryland average of 16%. A high proportion of the oldest-old suggests strong end-of-life care experience and very-high-acuity capabilities.

Edenwald Senior Living
SC
AL
IL
MC
NH
SNF
Towson (Southerly Road)
94
Facility 94
MD AVG 42
Rank #139 / 685
No
83
Facility 83
MD AVG 43
Rank #70 / 985
1 Bed / 2 Bed-A+
18%

Male Residents — State Benchmarked 18% of residents are male, compared to the Maryland average of 31%. This facility caters to a majority female resident pool (82% female), consistent with the broader assisted living trend where women significantly outnumber men.

82%

Female Residents — State Benchmarked 82% of residents are female, compared to the Maryland average of 69%. Women comprise the large majority, consistent with national assisted living demographics where women live longer and enter care facilities at higher rates.

100%

White Residents — State Benchmarked 100% of residents are reported as White, compared to the Maryland average of 81%. A higher White share than is typical for assisted living in Maryland in this dataset — compare with peer facilities for local context.

0%

African American Residents — State Benchmarked 0% of residents are reported as African American or Black, compared to the Maryland average of 13%. A lower African American share than is typical in Maryland; local markets still vary widely.

0%

Other Ethnicity Residents — State Benchmarked 0% of residents fall into categories other than White or African American (combined), compared to the Maryland average of 6%. This column aggregates Hispanic, Asian, multiracial, and any other labeled groups that are not classified as White or African American.

-
13%

Residents Age 75–84 — State Benchmarked 13% of residents are 75–84, compared to the Maryland average of 31%. Below the state norm — the resident mix may skew either younger or older than this typical middle bracket.

53%

Residents Age 85–94 — State Benchmarked 53% of residents are 85–94, compared to the Maryland average of 44%. A high concentration of very elderly residents signals a higher-acuity facility with experience caring for advanced age-related needs.

35%

Residents Age 95+ — State Benchmarked 35% of residents are 95 or older, compared to the Maryland average of 16%. A high proportion of the oldest-old suggests strong end-of-life care experience and very-high-acuity capabilities.

Lutheran Village at Miller’s Grant
SC
AL
IL
NH
SNF
Ellicott City (Lutheran Village At Miller’s Grant)
36
Facility 36
MD AVG 42
Rank #230 / 685
Yes
19
Facility 19
MD AVG 43
Rank #746 / 985
1 Bed / 2 Bed
21
Facility 21
MD AVG 21
Rank #108 / 210
-
17%

Male Residents — State Benchmarked 17% of residents are male, compared to the Maryland average of 31%. This facility caters to a majority female resident pool (83% female), consistent with the broader assisted living trend where women significantly outnumber men.

83%

Female Residents — State Benchmarked 83% of residents are female, compared to the Maryland average of 69%. Women comprise the large majority, consistent with national assisted living demographics where women live longer and enter care facilities at higher rates.

83%

White Residents — State Benchmarked 83% of residents are reported as White, compared to the Maryland average of 81%. Close to the average for this category among assisted living facilities in Maryland with reported race/ethnicity data.

11%

African American Residents — State Benchmarked 11% of residents are reported as African American or Black, compared to the Maryland average of 13%. In line with the Maryland average for African American residents among facilities reporting this breakdown.

6%

Other Ethnicity Residents — State Benchmarked 6% of residents fall into categories other than White or African American (combined), compared to the Maryland average of 6%. This column aggregates Hispanic, Asian, multiracial, and any other labeled groups that are not classified as White or African American. Reported subgroups in this total: Asian (6%).

-
33%

Residents Age 75–84 — State Benchmarked 33% of residents are 75–84, compared to the Maryland average of 31%. This is the second most common age bracket in assisted living, representing residents with moderate care needs.

44%

Residents Age 85–94 — State Benchmarked 44% of residents are 85–94, compared to the Maryland average of 44%. This is typically the most common age bracket in assisted living — this facility is in line with the statewide norm.

22%

Residents Age 95+ — State Benchmarked 22% of residents are 95 or older, compared to the Maryland average of 16%. A high proportion of the oldest-old suggests strong end-of-life care experience and very-high-acuity capabilities.

Friends House Retirement Community
SC
AL
IL
NH
SNF
Sandy Spring
24
Facility 24
MD AVG 42
Rank #242 / 685
Yes
6
Facility 6
MD AVG 43
Rank #891 / 985
-
20
Facility 20
MD AVG 21
Rank #112 / 210
-
6%

Male Residents — State Benchmarked 6% of residents are male, compared to the Maryland average of 31%. This facility caters to a majority female resident pool (94% female), consistent with the broader assisted living trend where women significantly outnumber men.

94%

Female Residents — State Benchmarked 94% of residents are female, compared to the Maryland average of 69%. Women comprise the large majority, consistent with national assisted living demographics where women live longer and enter care facilities at higher rates.

94%

White Residents — State Benchmarked 94% of residents are reported as White, compared to the Maryland average of 81%. A higher White share than is typical for assisted living in Maryland in this dataset — compare with peer facilities for local context.

0%

African American Residents — State Benchmarked 0% of residents are reported as African American or Black, compared to the Maryland average of 13%. A lower African American share than is typical in Maryland; local markets still vary widely.

6%

Other Ethnicity Residents — State Benchmarked 6% of residents fall into categories other than White or African American (combined), compared to the Maryland average of 6%. This column aggregates Hispanic, Asian, multiracial, and any other labeled groups that are not classified as White or African American. Reported subgroups in this total: Asian (6%).

6%

Residents Age 65–74 — State Benchmarked 6% of residents are 65–74, compared to the Maryland average of 13%. Fewer younger seniors suggests the resident population skews older, likely requiring higher acuity care and more hands-on support.

18%

Residents Age 75–84 — State Benchmarked 18% of residents are 75–84, compared to the Maryland average of 31%. Below the state norm — the resident mix may skew either younger or older than this typical middle bracket.

53%

Residents Age 85–94 — State Benchmarked 53% of residents are 85–94, compared to the Maryland average of 44%. A high concentration of very elderly residents signals a higher-acuity facility with experience caring for advanced age-related needs.

24%

Residents Age 95+ — State Benchmarked 24% of residents are 95 or older, compared to the Maryland average of 16%. A high proportion of the oldest-old suggests strong end-of-life care experience and very-high-acuity capabilities.

Sunrise of Rockville
SC
AL
HOS
MC
Rockville (Baltimore Road)
89
Facility 89
MD AVG 42
Rank #150 / 685
Yes
89
Facility 89
MD AVG 43
Rank #32 / 985
Studio / 1 Bed / 2 Bed
45
Facility 45
MD AVG 21
Rank #4 / 210
A-
23%

Male Residents — State Benchmarked 23% of residents are male, compared to the Maryland average of 31%. This facility caters to a majority female resident pool (77% female), consistent with the broader assisted living trend where women significantly outnumber men.

77%

Female Residents — State Benchmarked 77% of residents are female, compared to the Maryland average of 69%. Women comprise the large majority, consistent with national assisted living demographics where women live longer and enter care facilities at higher rates.

87%

White Residents — State Benchmarked 87% of residents are reported as White, compared to the Maryland average of 81%. Close to the average for this category among assisted living facilities in Maryland with reported race/ethnicity data.

2%

African American Residents — State Benchmarked 2% of residents are reported as African American or Black, compared to the Maryland average of 13%. A lower African American share than is typical in Maryland; local markets still vary widely.

11%

Other Ethnicity Residents — State Benchmarked 11% of residents fall into categories other than White or African American (combined), compared to the Maryland average of 6%. This column aggregates Hispanic, Asian, multiracial, and any other labeled groups that are not classified as White or African American. Reported subgroups in this total: Mixed Race (6%), Hispanic (3%), Asian (2%).

3%

Residents Age 65–74 — State Benchmarked 3% of residents are 65–74, compared to the Maryland average of 13%. Fewer younger seniors suggests the resident population skews older, likely requiring higher acuity care and more hands-on support.

31%

Residents Age 75–84 — State Benchmarked 31% of residents are 75–84, compared to the Maryland average of 31%. This is the second most common age bracket in assisted living, representing residents with moderate care needs.

56%

Residents Age 85–94 — State Benchmarked 56% of residents are 85–94, compared to the Maryland average of 44%. A high concentration of very elderly residents signals a higher-acuity facility with experience caring for advanced age-related needs.

10%

Residents Age 95+ — State Benchmarked 10% of residents are 95 or older, compared to the Maryland average of 16%. Most residents here have not yet reached the oldest-old bracket, suggesting a younger overall community.

Maplewood Park Place
SC
AL
IL
MC
NH
SNF
Bethesda (Pooks Hill)
29
Facility 29
MD AVG 42
Rank #240 / 685
Yes
38
Facility 38
MD AVG 43
Rank #542 / 985
1 Bed / 2 Bed
30
Facility 30
MD AVG 21
Rank #44 / 210
-
18%

Male Residents — State Benchmarked 18% of residents are male, compared to the Maryland average of 31%. This facility caters to a majority female resident pool (82% female), consistent with the broader assisted living trend where women significantly outnumber men.

82%

Female Residents — State Benchmarked 82% of residents are female, compared to the Maryland average of 69%. Women comprise the large majority, consistent with national assisted living demographics where women live longer and enter care facilities at higher rates.

100%

White Residents — State Benchmarked 100% of residents are reported as White, compared to the Maryland average of 81%. A higher White share than is typical for assisted living in Maryland in this dataset — compare with peer facilities for local context.

0%

African American Residents — State Benchmarked 0% of residents are reported as African American or Black, compared to the Maryland average of 13%. A lower African American share than is typical in Maryland; local markets still vary widely.

0%

Other Ethnicity Residents — State Benchmarked 0% of residents fall into categories other than White or African American (combined), compared to the Maryland average of 6%. This column aggregates Hispanic, Asian, multiracial, and any other labeled groups that are not classified as White or African American.

-
6%

Residents Age 75–84 — State Benchmarked 6% of residents are 75–84, compared to the Maryland average of 31%. Below the state norm — the resident mix may skew either younger or older than this typical middle bracket.

24%

Residents Age 85–94 — State Benchmarked 24% of residents are 85–94, compared to the Maryland average of 44%. The population here skews younger than the statewide norm, which may indicate a more active, lower-acuity community.

71%

Residents Age 95+ — State Benchmarked 71% of residents are 95 or older, compared to the Maryland average of 16%. A high proportion of the oldest-old suggests strong end-of-life care experience and very-high-acuity capabilities.

Ingleside at King Farm
SC
AL
IL
MC
NH
SNF
Rockville (King Farm)
45
Facility 45
MD AVG 42
Rank #219 / 685
Yes
73
Facility 73
MD AVG 43
Rank #152 / 985
1 Bed / 2 Bed-----------
Homewood Living Frederick
SC
AL
IL
MC
NH
SNF
Frederick
120
Facility 120
MD AVG 42
Rank #73 / 685
Yes
14
Facility 14
MD AVG 43
Rank #788 / 985
1 Bed / 2 Bed-----------
Residences at Vantage Point
SC
AL
HC
IL
MC
NH
SNF
Columbia (Town Center)
44
Facility 44
MD AVG 42
Rank #222 / 685
Yes
52
Facility 52
MD AVG 43
Rank #402 / 985
Studio / 1 Bed / 2 Bed
36
Facility 36
MD AVG 21
Rank #16 / 210
----------
Buckingham‘s Choice
SC
AL
MC
NH
RC
SNF
Adamstown (Baker Circle)
42
Facility 42
MD AVG 42
Rank #223 / 685
No
3
Facility 3
MD AVG 43
Rank #930 / 985
Private Rooms
31
Facility 31
MD AVG 21
Rank #39 / 210
----------
Sunrise of Pikesville
SC
NH
AL
HOS
MC
Pikesville (Old Court Road)
96
Facility 96
MD AVG 42
Rank #131 / 685
Yes
75
Facility 75
MD AVG 43
Rank #131 / 985
Studio / 1 Bed / 2 Bed
45
Facility 45
MD AVG 21
Rank #4 / 210
A-
30%

Male Residents — State Benchmarked 30% of residents are male, compared to the Maryland average of 31%. This facility caters to a majority female resident pool (70% female), consistent with the broader assisted living trend where women significantly outnumber men.

70%

Female Residents — State Benchmarked 70% of residents are female, compared to the Maryland average of 69%. Women comprise the large majority, consistent with national assisted living demographics where women live longer and enter care facilities at higher rates.

63%

White Residents — State Benchmarked 63% of residents are reported as White, compared to the Maryland average of 81%. A lower White share than the Maryland average — the community may draw a more diverse resident mix relative to other facilities in Maryland.

37%

African American Residents — State Benchmarked 37% of residents are reported as African American or Black, compared to the Maryland average of 13%. A higher African American share than the typical Maryland average — useful context when comparing cultural fit and community composition.

0%

Other Ethnicity Residents — State Benchmarked 0% of residents fall into categories other than White or African American (combined), compared to the Maryland average of 6%. This column aggregates Hispanic, Asian, multiracial, and any other labeled groups that are not classified as White or African American.

15%

Residents Age 65–74 — State Benchmarked 15% of residents are 65–74, compared to the Maryland average of 13%. In line with the statewide profile for this youngest senior bracket in assisted living.

27%

Residents Age 75–84 — State Benchmarked 27% of residents are 75–84, compared to the Maryland average of 31%. This is the second most common age bracket in assisted living, representing residents with moderate care needs.

41%

Residents Age 85–94 — State Benchmarked 41% of residents are 85–94, compared to the Maryland average of 44%. This is typically the most common age bracket in assisted living — this facility is in line with the statewide norm.

15%

Residents Age 95+ — State Benchmarked 15% of residents are 95 or older, compared to the Maryland average of 16%. In line with the statewide profile for the oldest resident bracket.

Brighton Gardens of Friendship Heights
SC
AL
HOS
MC
Chevy Chase (Friendship Boulevard)
154
Facility 154
MD AVG 42
Rank #39 / 685
Yes
86
Facility 86
MD AVG 43
Rank #47 / 985
Studio / 1 Bed / 2 Bed
29
Facility 29
MD AVG 21
Rank #48 / 210
-
20%

Male Residents — State Benchmarked 20% of residents are male, compared to the Maryland average of 31%. This facility caters to a majority female resident pool (80% female), consistent with the broader assisted living trend where women significantly outnumber men.

80%

Female Residents — State Benchmarked 80% of residents are female, compared to the Maryland average of 69%. Women comprise the large majority, consistent with national assisted living demographics where women live longer and enter care facilities at higher rates.

96%

White Residents — State Benchmarked 96% of residents are reported as White, compared to the Maryland average of 81%. A higher White share than is typical for assisted living in Maryland in this dataset — compare with peer facilities for local context.

1%

African American Residents — State Benchmarked 1% of residents are reported as African American or Black, compared to the Maryland average of 13%. A lower African American share than is typical in Maryland; local markets still vary widely.

3%

Other Ethnicity Residents — State Benchmarked 3% of residents fall into categories other than White or African American (combined), compared to the Maryland average of 6%. This column aggregates Hispanic, Asian, multiracial, and any other labeled groups that are not classified as White or African American. Reported subgroups in this total: Asian (2%), Hispanic (1%).

3%

Residents Age 65–74 — State Benchmarked 3% of residents are 65–74, compared to the Maryland average of 13%. Fewer younger seniors suggests the resident population skews older, likely requiring higher acuity care and more hands-on support.

31%

Residents Age 75–84 — State Benchmarked 31% of residents are 75–84, compared to the Maryland average of 31%. This is the second most common age bracket in assisted living, representing residents with moderate care needs.

49%

Residents Age 85–94 — State Benchmarked 49% of residents are 85–94, compared to the Maryland average of 44%. A high concentration of very elderly residents signals a higher-acuity facility with experience caring for advanced age-related needs.

15%

Residents Age 95+ — State Benchmarked 15% of residents are 95 or older, compared to the Maryland average of 16%. In line with the statewide profile for the oldest resident bracket.

Sunrise of Frederick
SC
AL
MC
Frederick (Waterford)
88
Facility 88
MD AVG 42
Rank #152 / 685
Yes
62
Facility 62
MD AVG 43
Rank #286 / 985
Studio / Suite / 2 Bed
45
Facility 45
MD AVG 21
Rank #4 / 210
A-
31%

Male Residents — State Benchmarked 31% of residents are male, compared to the Maryland average of 31%. This facility caters to a majority female resident pool (69% female), consistent with the broader assisted living trend where women significantly outnumber men.

69%

Female Residents — State Benchmarked 69% of residents are female, compared to the Maryland average of 69%. Women comprise the large majority, consistent with national assisted living demographics where women live longer and enter care facilities at higher rates.

97%

White Residents — State Benchmarked 97% of residents are reported as White, compared to the Maryland average of 81%. A higher White share than is typical for assisted living in Maryland in this dataset — compare with peer facilities for local context.

2%

African American Residents — State Benchmarked 2% of residents are reported as African American or Black, compared to the Maryland average of 13%. A lower African American share than is typical in Maryland; local markets still vary widely.

2%

Other Ethnicity Residents — State Benchmarked 2% of residents fall into categories other than White or African American (combined), compared to the Maryland average of 6%. This column aggregates Hispanic, Asian, multiracial, and any other labeled groups that are not classified as White or African American. Reported subgroups in this total: Hispanic (2%).

10%

Residents Age 65–74 — State Benchmarked 10% of residents are 65–74, compared to the Maryland average of 13%. Fewer younger seniors suggests the resident population skews older, likely requiring higher acuity care and more hands-on support.

34%

Residents Age 75–84 — State Benchmarked 34% of residents are 75–84, compared to the Maryland average of 31%. This is the second most common age bracket in assisted living, representing residents with moderate care needs.

48%

Residents Age 85–94 — State Benchmarked 48% of residents are 85–94, compared to the Maryland average of 44%. This is typically the most common age bracket in assisted living — this facility is in line with the statewide norm.

6%

Residents Age 95+ — State Benchmarked 6% of residents are 95 or older, compared to the Maryland average of 16%. Most residents here have not yet reached the oldest-old bracket, suggesting a younger overall community.

Autumn Lake Healthcare at Riverview
SC
HOS
NH
PC
RC
SNF
Essex
238
Facility 238
MD AVG 42
Rank #5 / 685
No
61
Facility 61
MD AVG 43
Rank #301 / 985
------------
Sterling Care Hillhaven Assisted Living and Memory Care
SC
AL
HOS
MC
NH
SNF
Adelphi (Knollwood)
66
Facility 66
MD AVG 42
Rank #188 / 685
No
25
Facility 25
MD AVG 43
Rank #684 / 985
Studio / 1 Bed-----------
Rows per page:
View all Nearby Homes
Overview of Abundantly Blessed Assisted Living

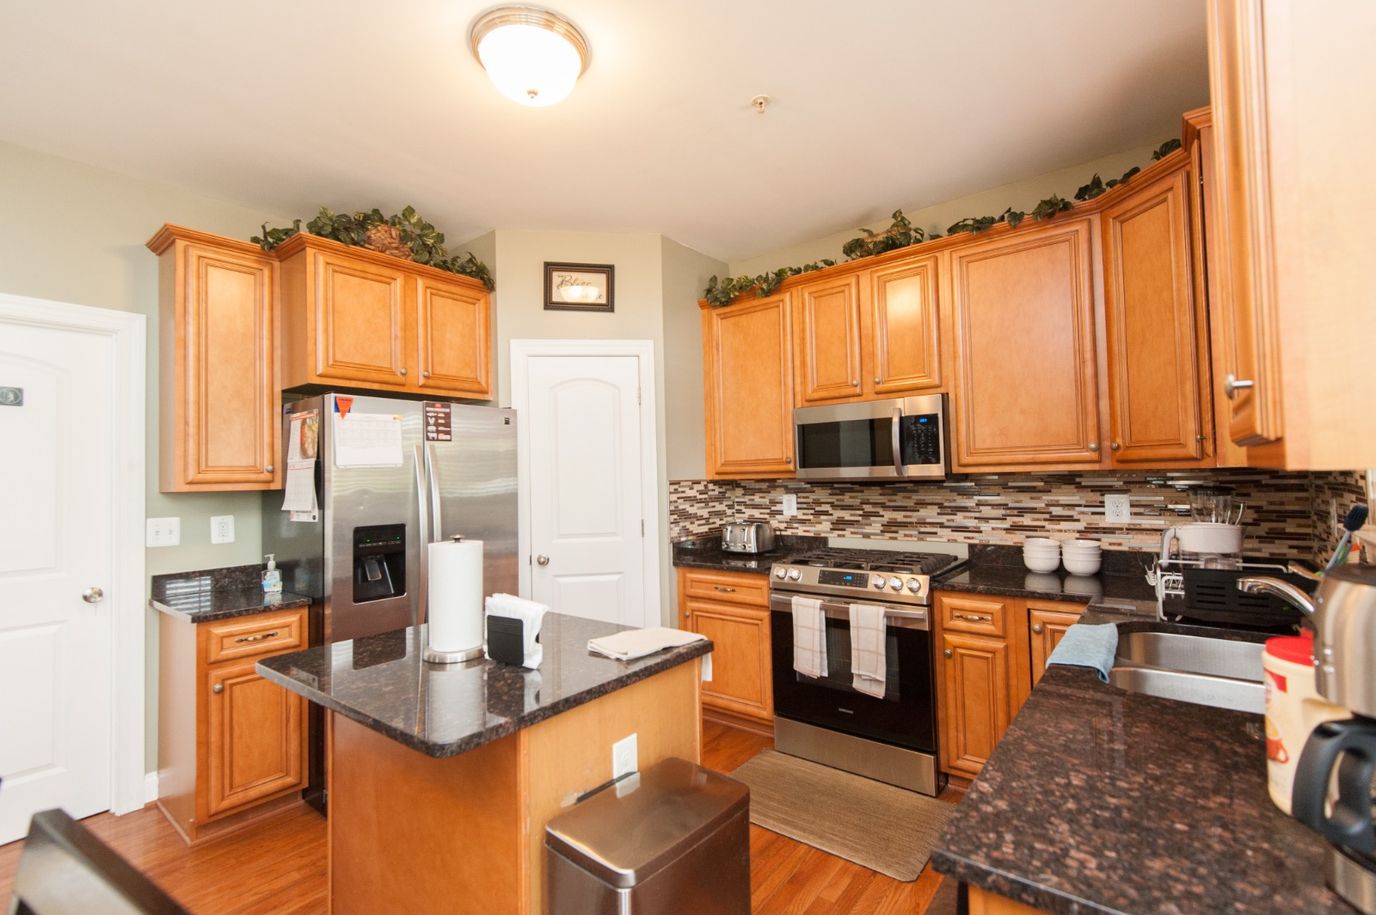
Stay well-engaged with the blissful senior living community of Abundantly Blessed Assisted Living set in the quiet neighborhood of Polaris Drive, Upper Marlboro, MD, offering assisted living. The community strives to help seniors with their daily living chores to ensure they live well within its premises. A dedicated and highly trained team works closely with the residents to better understand their needs and aspirations for a care plan that best suits them.

Explore the locality on planned outings and have fun days within the community through enjoyable activities. The community also provides transportation to ensure residents do not miss their appointments. Healthy and tasty meals await seniors every mealtime for the finest dining experience. With its vibrant and welcoming environment, Abundantly Blessed Assisted Living provides a haven for seniors to make their golden years more meaningful.

Contact Abundantly Blessed Assisted Living

Overview of Royal Residential Services

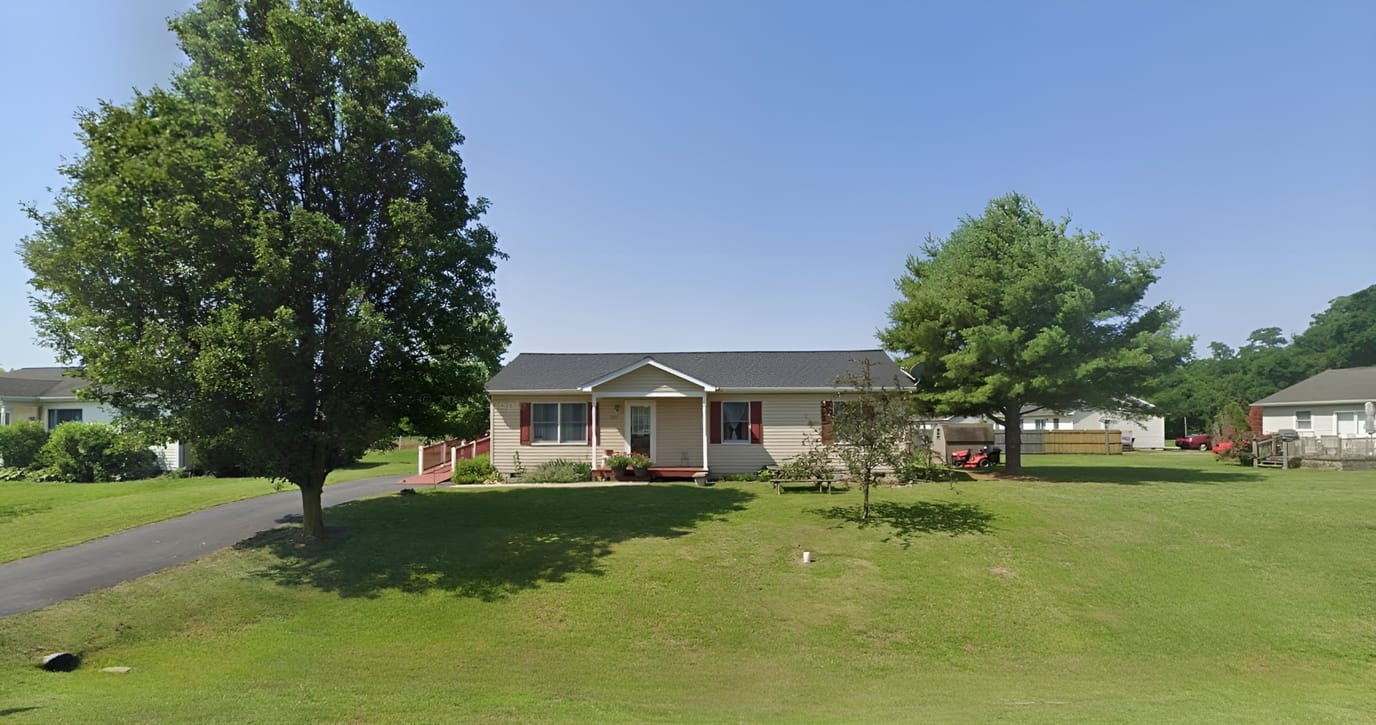
Have a blissful retirement at Royal Residential Services, a distinguished community in Columbia, MD, offering assisted living. Prioritizing residents’ well-being, a compassionate and highly skilled team provides top-notch care tailored to their personal needs around the clock. The community ensures residents have a hassle-free living, helping with cleaning, laundry, and other chores.

A jam-packed calendar of engaging activities and enriching programs is conducted to keep residents active and socially connected. Mealtimes are also something to look forward to, with delicious and healthy dining options that cater to their dietary needs and preferences. The community is a good option for those looking to make the most of their best years without worries.

Contact Royal Residential Services

Overview of Mary’s Place

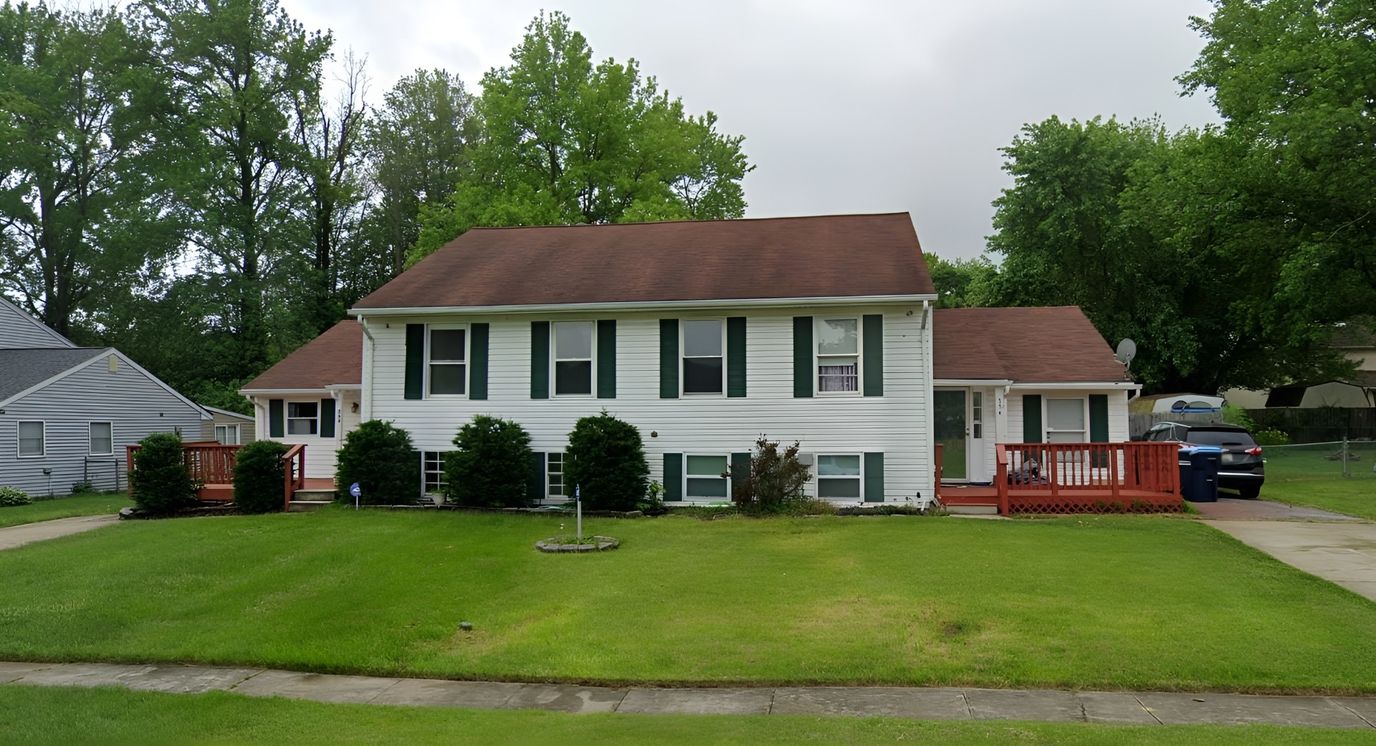
Peacefully situated in a tree-filled neighborhood of Baltimore, MD, Mary’s Place is a blissful retreat that offers assisted living. Committed to residents’ well-being, the community has a compassionate and well-trained team that provides top-notch assistance for their daily living activities 24/7. Here, residents have a hassle-free living with housekeeping and laundry services.

A carefully planned calendar of fun exercises and enriching programs is conducted, encouraging residents to live actively and maintain social connections. Mealtimes foster comfort and satisfy dietary needs with delectable and well-balanced dining options. Ensuring residents have their prescriptions, medication management is also provided. The community’s supportive and welcoming environment improves residents’ retirement experiences.

Contact Mary’s Place

Overview of HeartLands Senior Living at Ellicott City

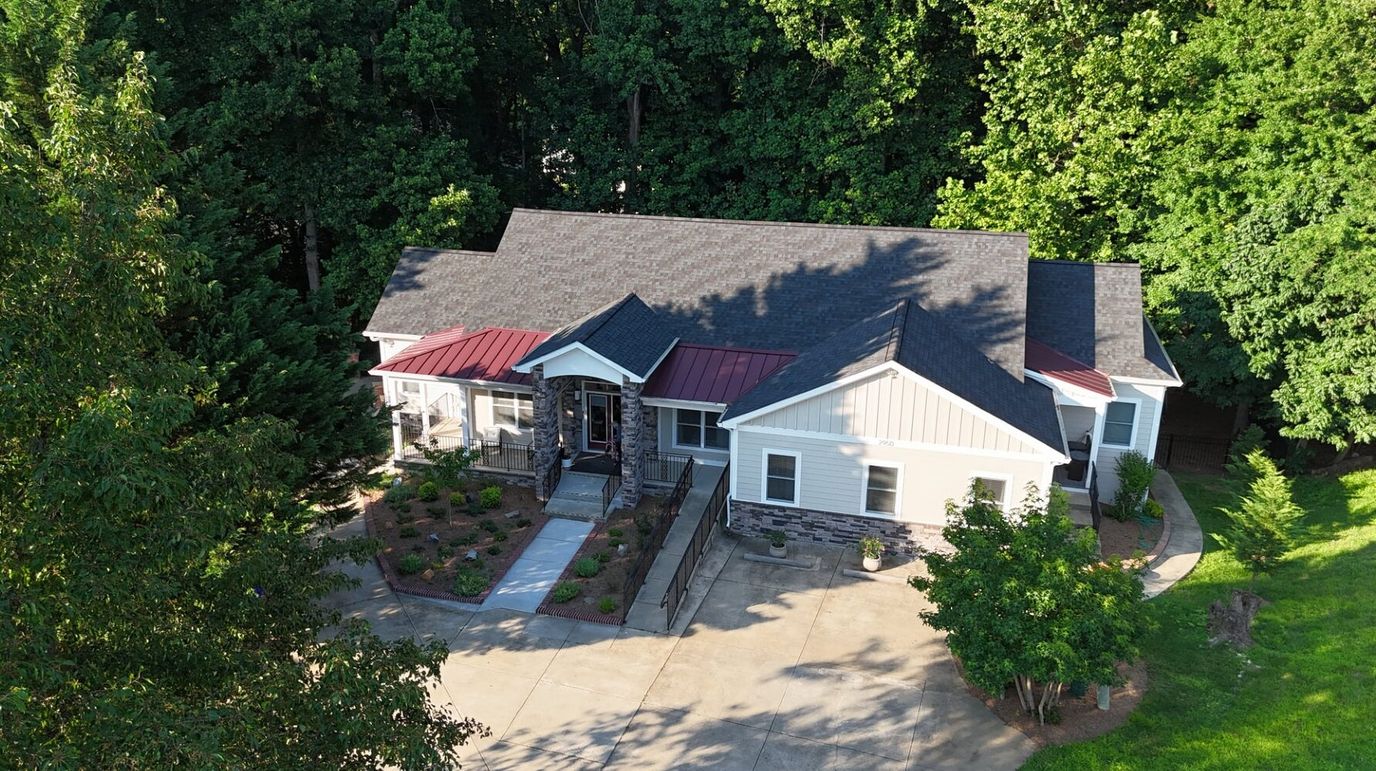
HeartLands Senior Living at Ellicott City operates as a skilled nursing facility in Ellicott City, Maryland, with certification for Medicare and Medicaid services. The facility is part of Discovery Senior Living’s portfolio of 45 senior living communities across multiple states. Located at 3004 North Ridge Road in Howard County, the operation has maintained licensed capacity for 182 beds and is currently serving residents at 87.8% occupancy, above the Maryland average; with an average length of stay of 103 days.

Nursing staff totals 27 registered nurses, 30 licensed practical nurses, and 64 certified nursing assistants among 174 total personnel. The facility provides 3 hours 27 minutes of nursing care per resident daily, below Maryland’s 4 hours 17 minutes standard. Contractor staffing represents 7% of total hours (3,896 hours quarterly), with specialists including physical therapy assistants, speech-language pathologists, respiratory therapy technicians, and qualified social workers supplementing core staff.

CMS assigns a 1-star overall rating, placing the facility 70.7% below Maryland average. Health inspection performance falls 68.8% below state benchmark. Quality measures register 7.2% above Maryland average for clinical outcomes including pressure ulcers, activities of daily living decline, walking ability, urinary tract infection rates, and depressive symptoms. The facility achieved pneumococcal vaccine administration at 99.7% of long-stay residents, and antipsychotic use at 7.8%, favorably below Maryland average of 12.9%.

Between September 2019 and November 2025, the facility accumulated 104 health citations: 1 critical, 2 serious, 101 moderate. Deficiencies concentrated in resident rights (24), quality of life/care (23), administration (8), abuse/neglect (8), and pharmacy services (7). No federal civil money penalties were assessed in the three-year review period. Complaint investigations from March 2025 through June 2025 identified systemic issues in resident dignity, environmental maintenance, care planning, activities of daily living assistance, medical records accuracy, and infection control practices.

Fiscal year 2024 generated $27.4 million gross revenue with net operating loss of $1.8 million and -6.4% profit margin. Payroll comprised $11.9 million (43.6% of revenue), ranked 31st statewide in total investment but 78th in payroll percentage. Payer mix reflects Medicaid dominance at 78.8%, private pay at 12.0%, and Medicare at 9.1%.

The facility accommodates mixed-stay residents through skilled nursing, independent living, and respite care service lines.

Dining emphasizes restaurant-style preparation with executive chef direction. Programs include recreational activities, exercise, beauty services, transportation, and housekeeping.

The car-dependent neighborhood (walk score 14) necessitates facility-provided transportation for community access.

HeartLands Senior Living at Ellicott City provides skilled nursing services within a mixed-pay model, sustained by substantial staffing investment but facing quality and efficiency performance gaps relative to Maryland standards and a persistent operating deficit.

Contact HeartLands Senior Living at Ellicott City

Overview of Deer’s Head Hospital Center

Deer’s Head Hospital Center is a nursing home in Salisbury, MD, offering rehabilitation and skilled nursing. Promoting a nurturing and welcoming environment, the community ensures older adults have a comfortable stay. Excellent services, including 24-hour care, well-balanced meals, and therapies, are also provided to enrich residents’ living experiences. Residents also receive the best possible care for their unique needs and habits through personalized care plans.

Fun gatherings, light exercises, and a variety of games encourage residents to stay active and gain meaningful experiences. With accessible common areas and thoughtfully furnished rooms, residents are guaranteed the utmost comfort and safety. Nestled near Johnson Pond in Salisbury, the community guarantees a stress-free retirement. This nursing home has high-quality services and a clean setting, making it one of the best choices for senior living in Maryland.

Contact Deer’s Head Hospital Center

Me First Respite Care

8181 Professional Pl, Hyattsville, MD 20785
Overview of Me First Respite Care

Based in Hyattsville’s Professional Plaza, Me First Respite Care delivers temporary in-home respite and home care specifically engineered for family caregivers, not residential facilities. The model is direct: licensed nurses and CNAs show up at the client’s home for several hours, a day, or a week at a time while the primary caregiver steps away. All staff undergo background screening, maintain liability insurance, and carry bonding.

Hours run Monday through Friday, 9:00 a.m. to 5:30 p.m., with Saturday availability through 1:00 p.m.; a business-hours model reflecting the service’s focus on caregiver relief rather than round-the-clock residential care. Veterans aged 65 and older and their spouses receive dedicated veteran-focused programming; companion care and sitter services round out the offering for non-veteran clients.

Respite companions handle personal care and household management, allowing family caregivers to attend medical appointments, return to work, or simply rest. The starting rate is $3,649 monthly.The organization does not carry Medicare or Medicaid certification.

Hyattsville sits 7.2 miles from the city center in a car-dependent area (walk score 32), though the service itself operates in clients’ homes rather than requiring facility visits.

This is respite on demand, not residential placement.

Me First Respite Care fits family caregivers needing temporary, scheduled relief for hours or days, during business hours, and veterans and their families seeking caregiver support within a dedicated veteran-care program.

Contact Me First Respite Care

Overview of Everyone’s Welcome Assisted Living

Everyone’s Welcome Assisted Living is an assisted living community in Columbia, MD, offering personal care and memory care. The community also fosters a vibrant and welcoming environment, ensuring older adults feel at home. Residents receive the utmost attention with exceptional services provided, including 24-hour care, three balanced meals, wellness monitoring, physical therapy coordination, housekeeping, and laundry. Owned and operated by a registered nurse, the community ensures residents are well-cared for.

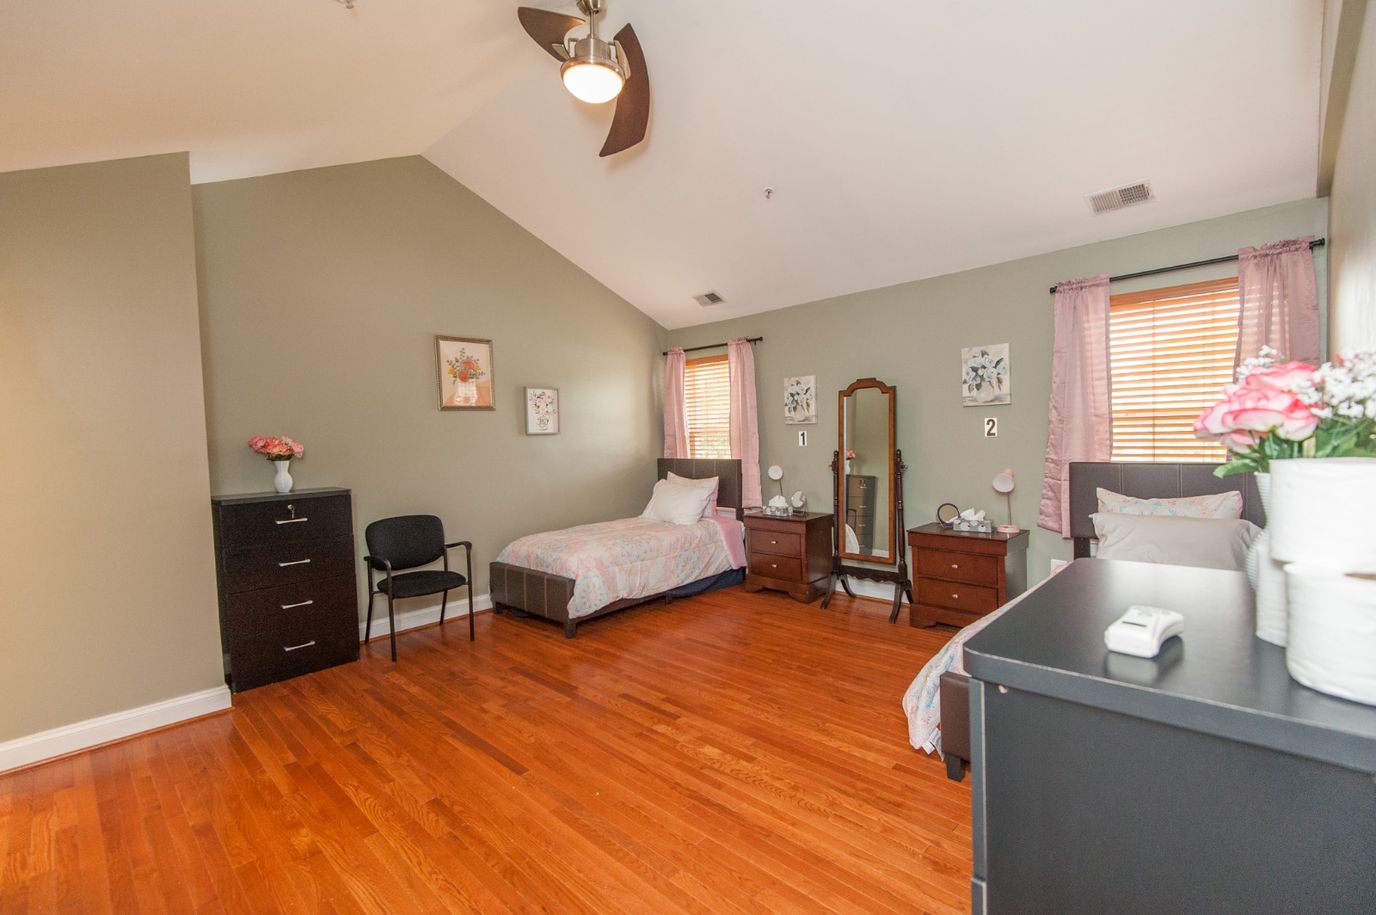
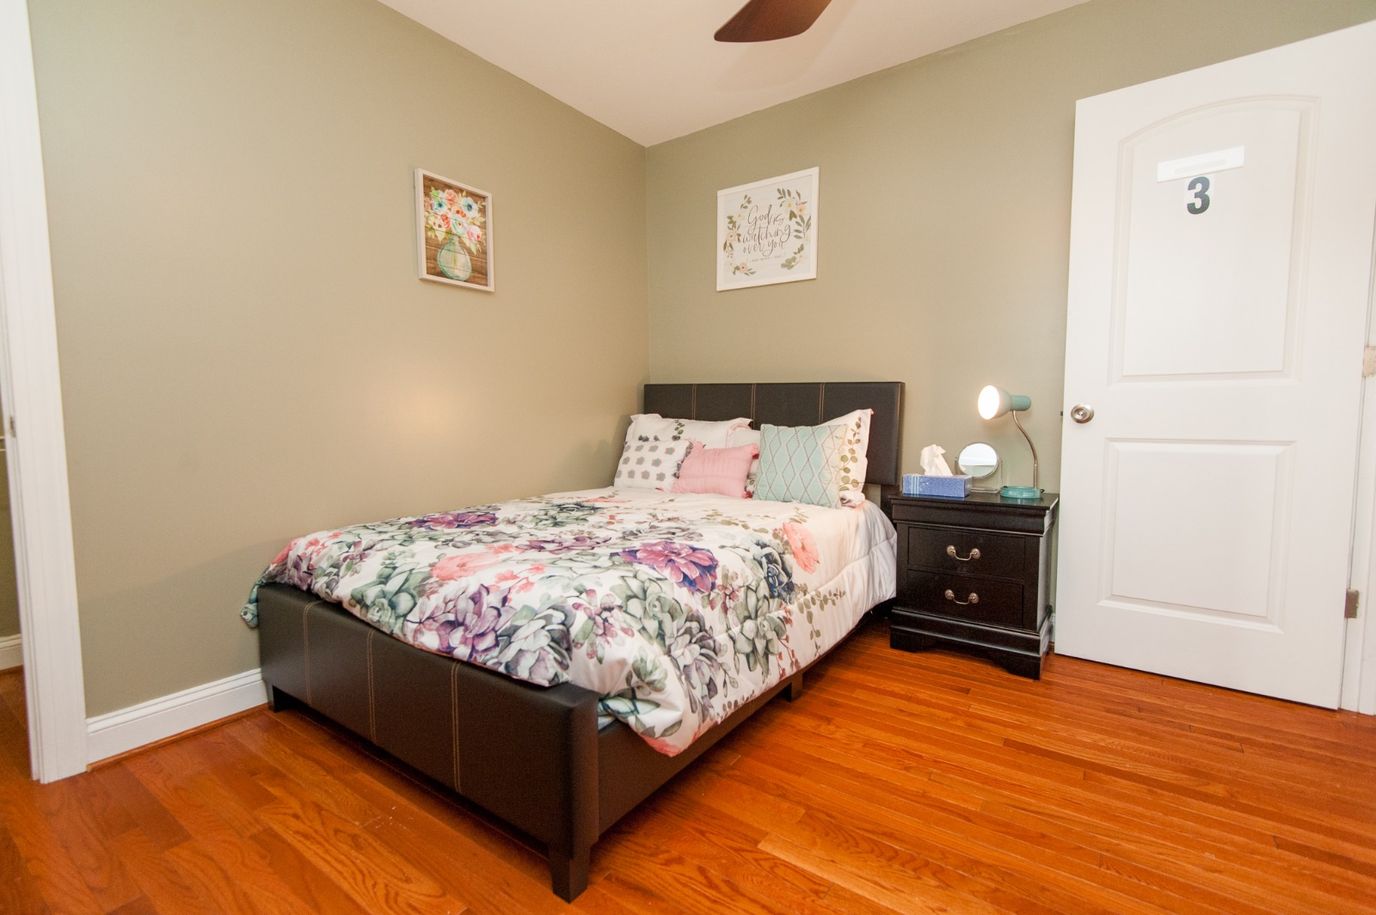
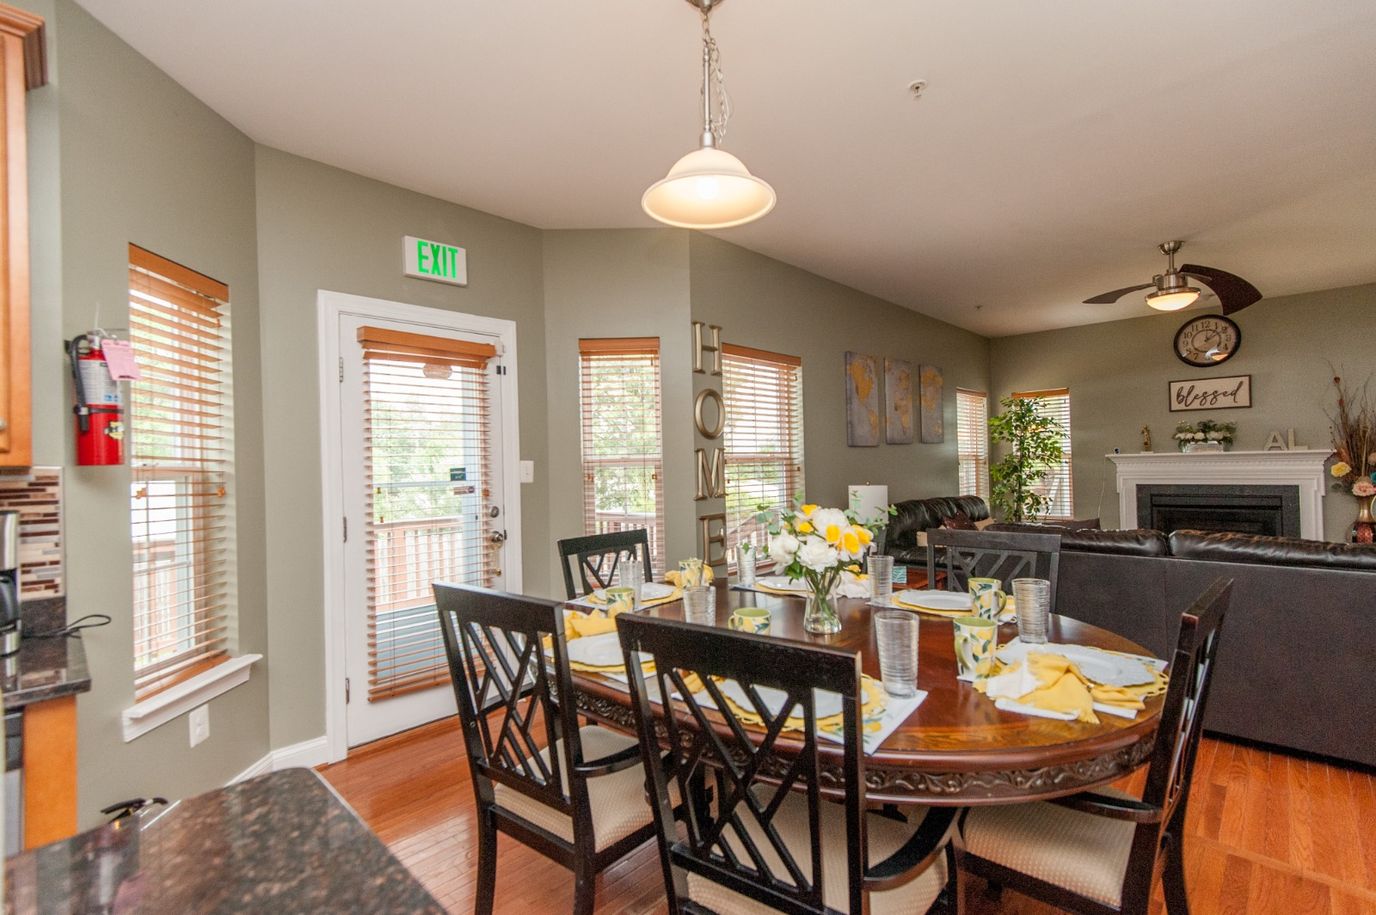
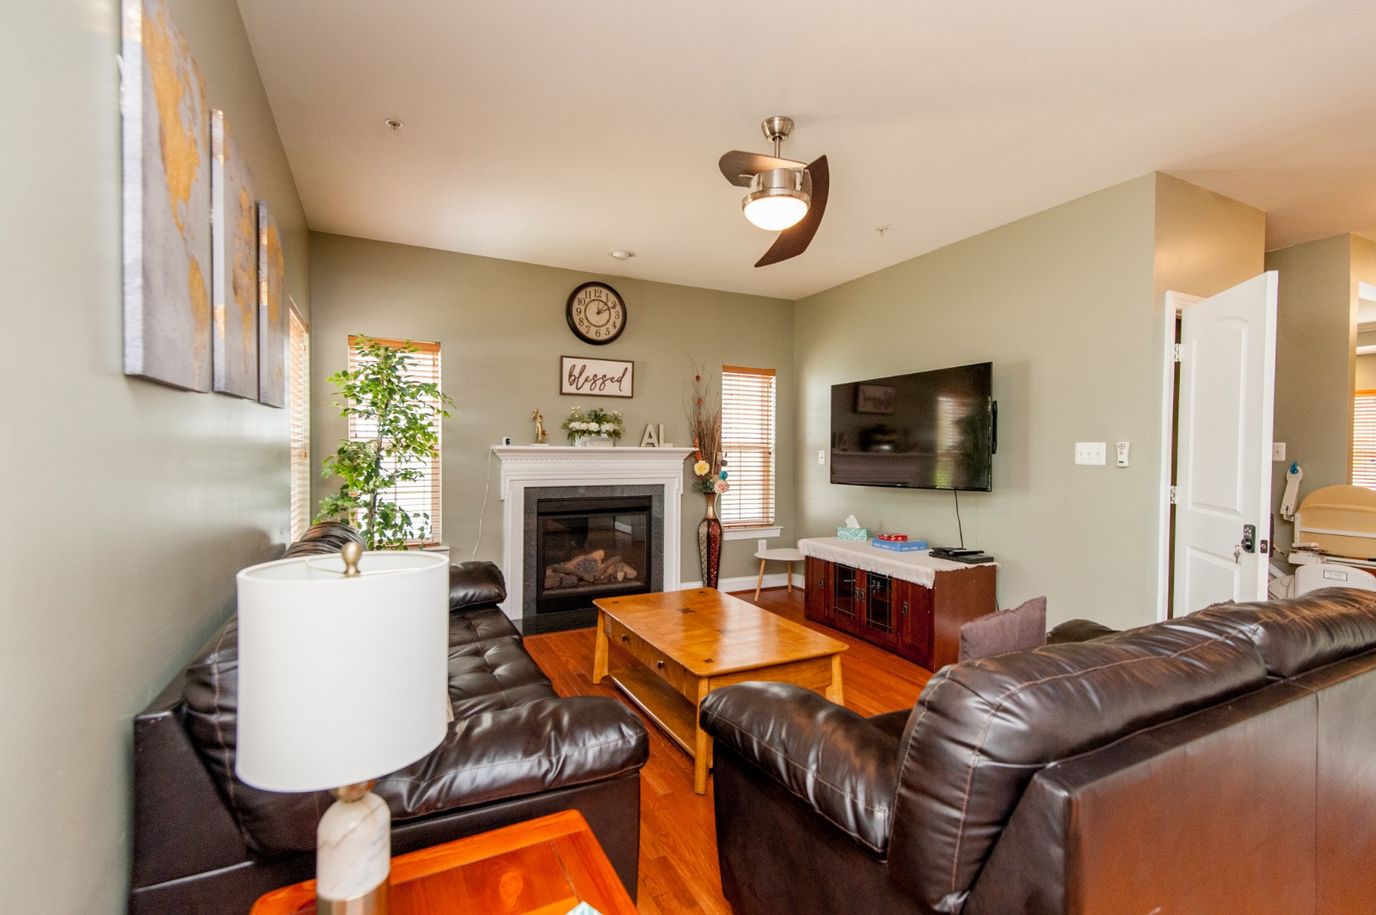
Exercise programs, arts and crafts, and daily social activities are conducted to help residents live actively and socialize. The community also features a fully renovated home with spacious rooms and spacious communal areas for residents’ comfort and safety. Johns Hopkins Howard County General Hospital and other local amenities are located nearby, providing residents with easy access to medical needs and leisure. This assisted living community is one of the best options for senior living in Maryland, especially with its comprehensive care options and modern amenities.

Overview of Caring Over Other’s Kin

Caring Over Other’s Kin is an assisted living community in Aberdeen, MD, offering personal care. With an intimate, home-like setting, the community can accommodate up to five older adults. 24-hour supervision, medication management, three meals daily, housekeeping, and weekly laundry services are among the services provided to help residents have a maintenance-free living. Owned by a registered nurse and a retired police detective, the community ensures residents receive the utmost attention for their needs and habits.

TV and entertainment, as well as Wifi access, are provided to promote social engagement and prevent residents from getting lonely. With spacious rooms and cozy communal spaces, residents can rest and move around comfortably. Set in the tree-lined neighborhood of Aberdeen, the community guarantees a stress-free retirement. This assisted living community is a great option for senior living in Maryland, especially with its dedicated services.

Overview of Catherine’s House Elderly Assisted Living

Situated in the peaceful neighborhood in Montgomery County, Clarksburg, MD, Catherine’s House Elderly Assisted Living is a well-established senior living community that offers premiere assisted living services. Providing access to an array of medical services such as visiting doctors and nurses, in-house rehabilitation, physical and speech therapy, and other complex services, the community ensures residents will receive the care they need. Offering intimate accommodations for 5 people, the community warrants personalized services, close interactions, and focused attention.

Residents here enjoy the convenience brought by housekeeping, laundry, and transportation services, giving them more time to spend in exciting activities and exercise programs. Gourmet meals are also provided to give residents the nourishment they need without the hassles of cooking and cleaning. With emergency alert and monitoring, residents can comfortably rest knowing that they are in a safe and secure environment.

Contact Catherine’s House Elderly Assisted Living

Overview of Springtime Home IV

Burrowed in the peaceful neighborhood at 804 Cypress Point Cir, Mitchellville, MD 20721, Springtime Home IV, is a remarkable senior living community that provides top-notch assisted living services. Here, residents can enjoy an independent and stress-free living in a family-like environment. The community redefines the standards of assisted living for its resident-centered approach to care catering to the unique needs of its residents.

Here, residents are treated with love and respect while enjoying its beautiful spaces. Top-tier amenities and services are available depending on the type of residents to be taken care of. Participate in a jam-packed schedule of social, recreational, and religious activities coordinated by a professional team. Equipped with the right tools and people, seniors can enjoy a glorious retirement with Springtime Home IV.

Contact Springtime Home IV

Weighting overview

  • 35%
    Resident Experience
  • 25%
    Regulatory
  • 15%
    Visual Media
  • 10%
    Website
  • 10%
    Stability
  • 5%
    Environment
01

Resident & Family Experience 35%

The single largest share of every ranking. Aggregated review sentiment and volume from major platforms — the closest signal to real resident experience.

  • Includes
  • Review Sentiment
  • Review Volume
02

Regulatory & Safety Record 25%

State inspection records, citations, and complaint visits. We weight per-inspection rates more heavily than raw counts.

  • Includes
  • State Inspections
  • Citations/Inspection
  • % Inspections w/ Citations
  • Complaint Visits
  • Accreditations
  • BBB Rating
03

Visual Media & Transparency 15%

Communities that publish high-quality visuals give families a real preview. No photos or tours = a negative transparency signal.

  • Includes
  • Video Tours
  • Virtual Walkthroughs
  • Photo Quantity
  • Photo Quality
04

Website & Operator Transparency 10%

Site quality and whether the operator publishes basic accountability information — staff names, contact details, ownership.

  • Includes
  • Website Content
  • Mobile Usability
  • Staff Info Available
  • Owner Info Available
05

Community Stability 10%

Operational signals indicating whether a community is well-run and meeting demand.

  • Includes
  • Occupancy Rate
  • Bed Options
06

Environment & Pricing 5%

Walkability and pricing transparency. Walk Score is weighted higher for Independent Living than for Memory Care, where most residents do not leave unaccompanied.

  • Includes
  • Walk Score
  • Pricing Transparency
No paid rankings Communities cannot pay to influence placement.
How we're paid: If we help you find a community and you move in, that community may pay us a referral fee. This never affects where they rank or what you pay. Learn more
Submit a correction

Nearby Cities

Who we are

Your Senior Care Partner, Every Step of the Way

We help families find affordable senior communities and unlock same day discounts, Medicaid, and Medicare options tailored to your needs.

Contact us Today