Total health inspections
7
Colorado average 4.8
Last Health inspection on Sep 2025

We arrange tours, appointments, and even moving support so you don’t have to
Thank you for your interest!
Our team will be in touch shortly to help with next steps.
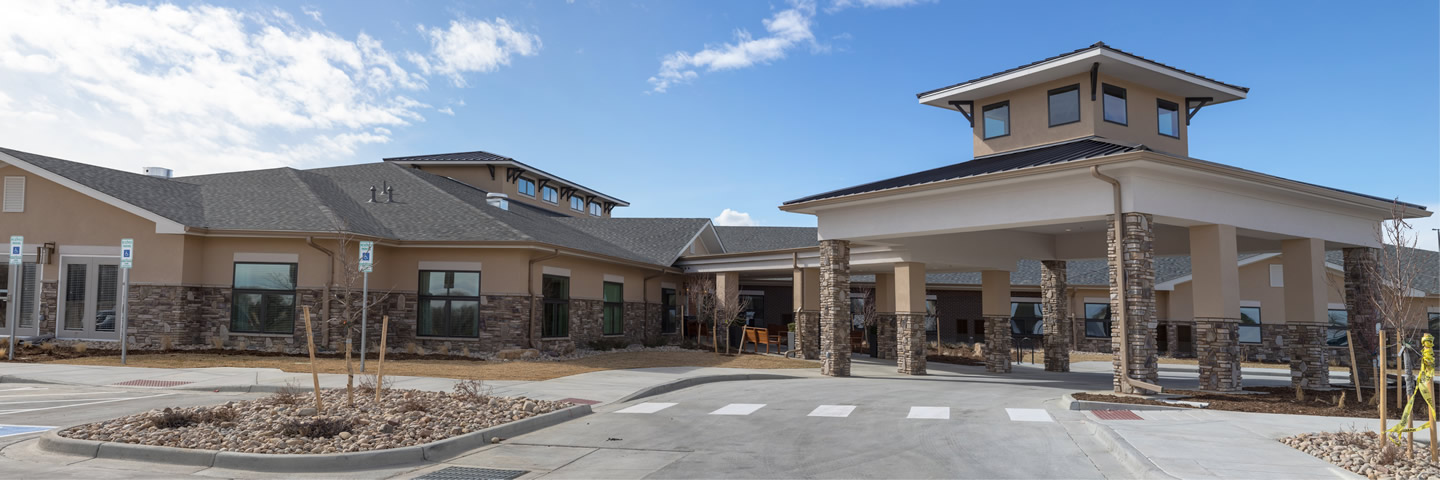


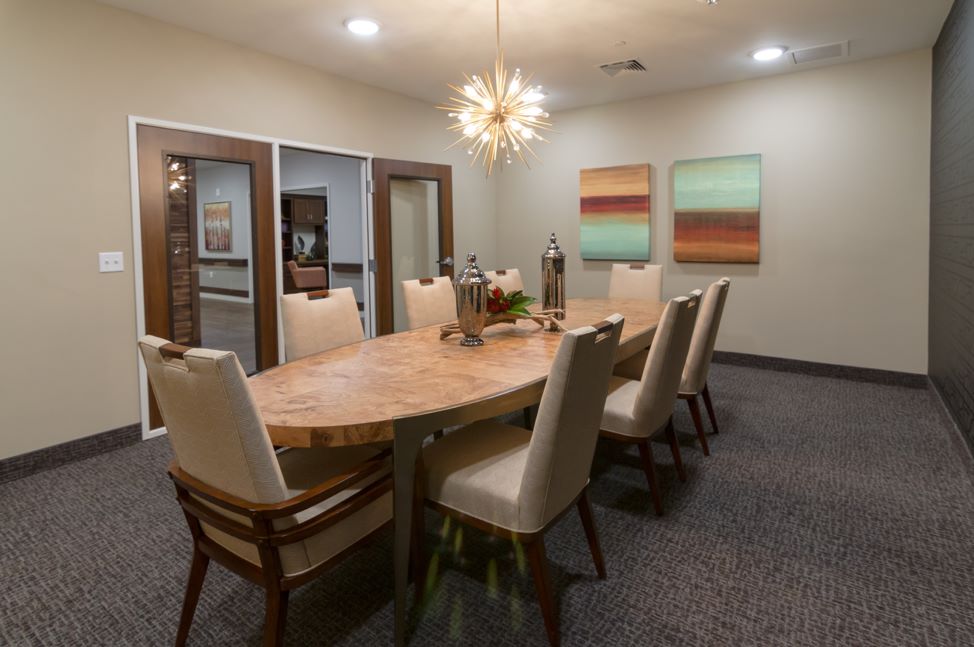
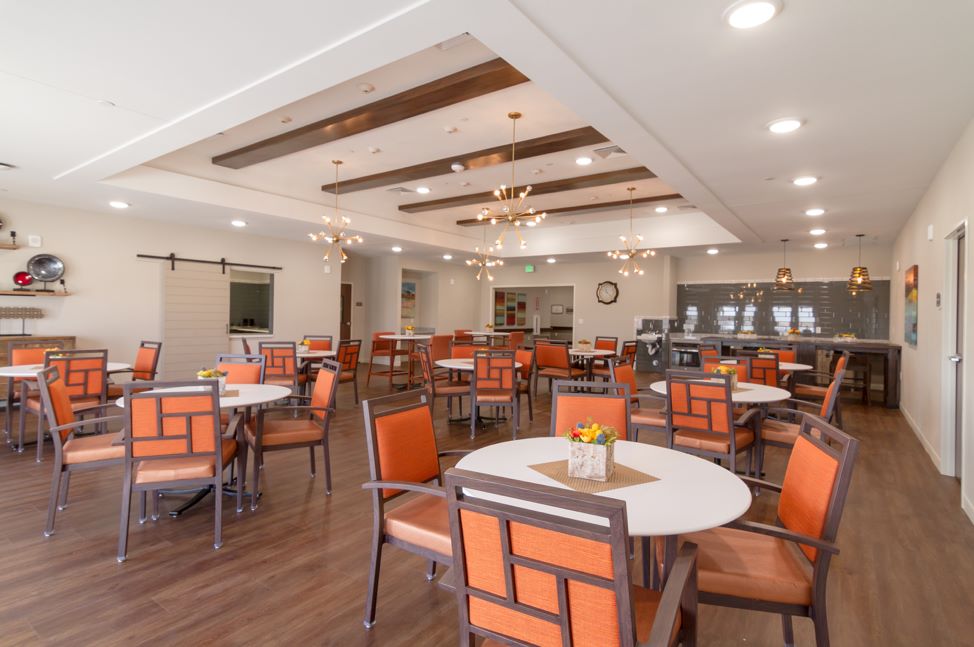
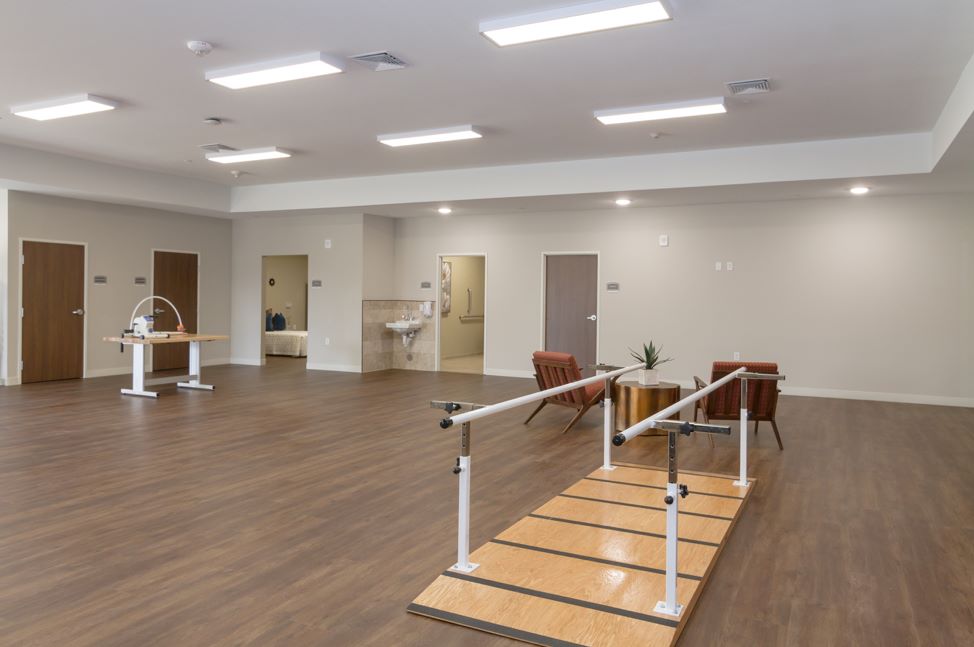
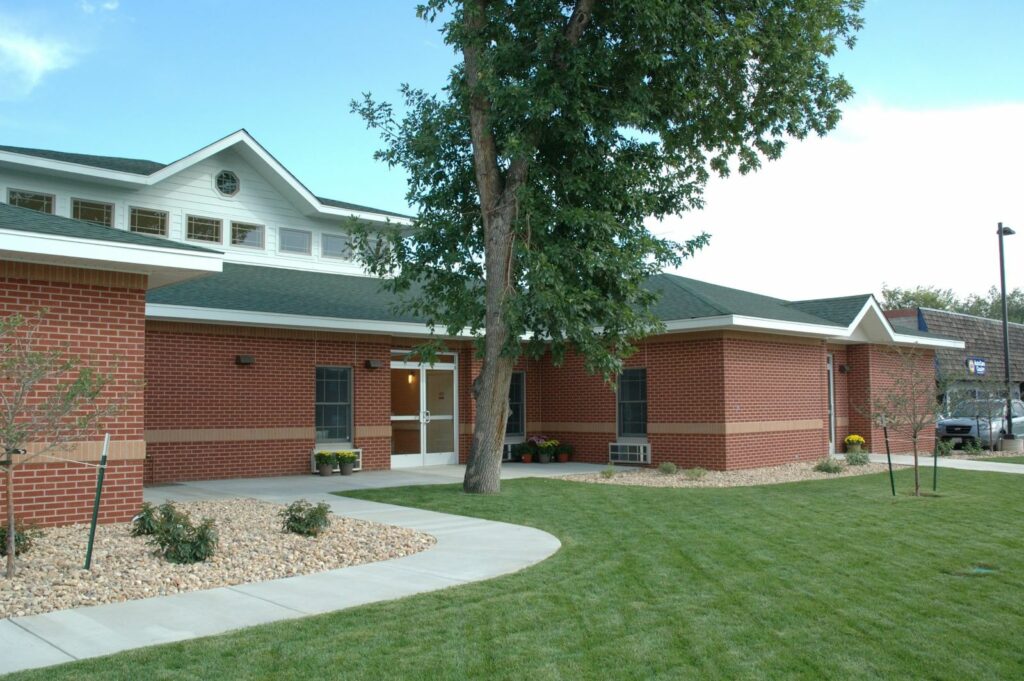
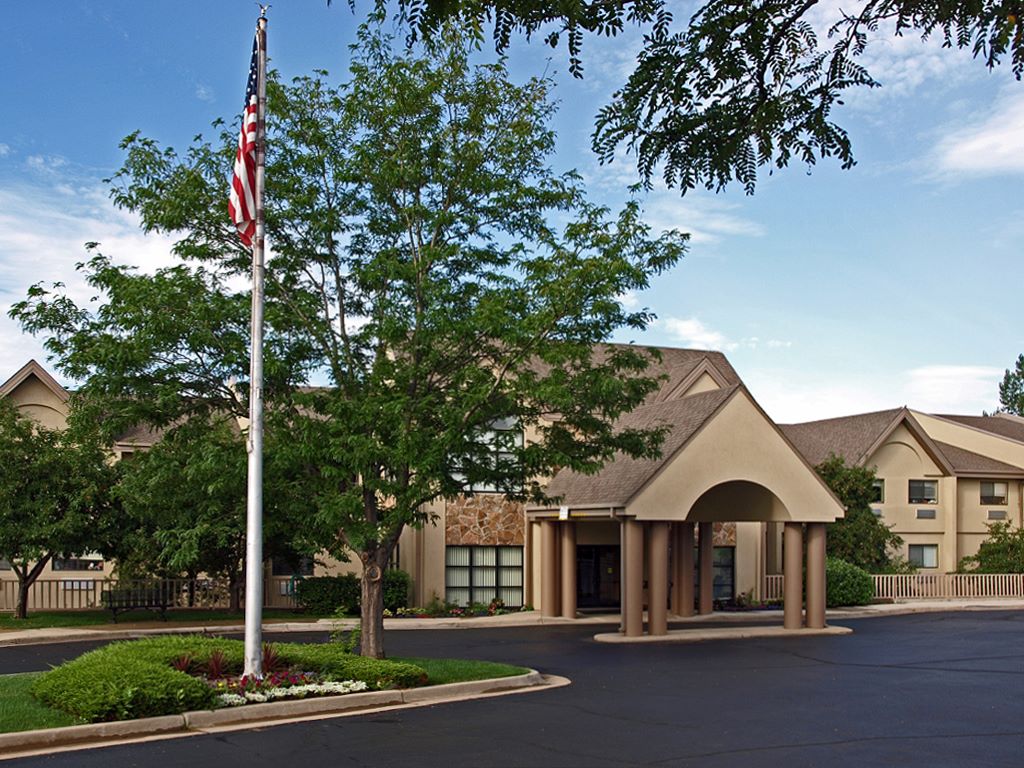
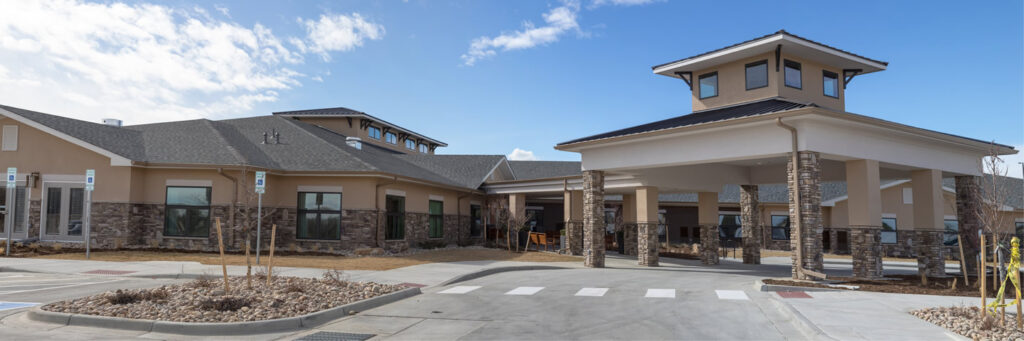
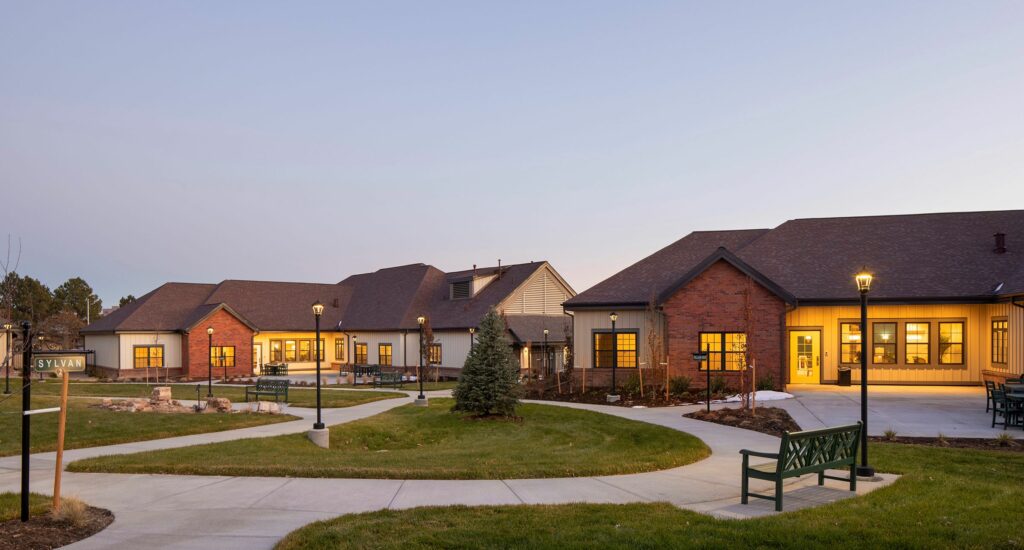
Accel at Longmont exemplifies premium services, setting a high standard in skilled nursing and rehabilitative healthcare. Their top-tier care is complemented by luxurious accommodations, providing a hotel-like experience for both clients and senior residents. With a focus on inpatient and outpatient rehab, location-based care, and skilled nursing, they have become a reliable choice for numerous families seeking exceptional support.
Their menu choices are not only delicious but also cater to individual dietary needs with professional counseling and management. They also go above and beyond by providing on-site pharmacy services, as well as access to podiatry, dentistry, and optometry services. Additionally, residents can enjoy the convenience of an on-site beauty and barber salon. The lush outdoor spaces, featuring meticulously landscaped grounds, provide a perfect retreat, all within electronically secured premises, ensuring a sense of safety and tranquility. Indeed, Accel at Longmont stands as a credible long-term care facility, covering all aspects to provide seniors with a comforting environment.
Offers a balance of services and community atmosphere.
Lower occupancy suggests more openings may be available.
Residents typically stay for brief periods, with frequent admissions and discharges throughout the year.
32% of new residents, usually for short-term rehab.
66% of new residents, often for short stays.
2% of new residents, often for long-term daily care.
Colorado average 4.8
Last Health inspection on Sep 2025
Colorado average 24.8
Colorado average 5.2
Health citations are formal notices following inspections when they fail to comply with safety and care standards.
36 of 53 citations resulted from standard inspections; and 17 of 53 resulted from complaint investigations.
Colorado average: 0.4
Colorado average: 2.1
Data sourced from CMS Health Deficiencies reports. Citation severity codes range from A (least serious) to L (most serious). Immediate Jeopardy (J-L) citations indicate situations where the facility's noncompliance has placed residents at risk of death or serious harm.
Assisted Living A licensed, long-term care setting for seniors or individuals with disabilities who need help with daily activities — like bathing, dressing, and medication management — but not 24-hour skilled nursing. Offers housing, meals, and around-the-clock support while aiming to maximize resident independence.
Independent Living Lifestyle-focused communities for older adults offering dining, activities, and transportation with minimal personal care. Best for active, independent seniors who want community without medical support.
Nursing Home Licensed facility providing 24/7 skilled nursing care for residents with complex, ongoing medical needs. Staffed by RNs, LPNs, and CNAs. Inspected and star-rated annually by CMS. Accepts Medicare (short-term rehab) and Medicaid (long-term care).
Nursing Home Licensed facility providing 24/7 skilled nursing care for residents with complex, ongoing medical needs. Staffed by RNs, LPNs, and CNAs. Inspected and star-rated annually by CMS. Accepts Medicare (short-term rehab) and Medicaid (long-term care).
Nursing Home Licensed facility providing 24/7 skilled nursing care for residents with complex, ongoing medical needs. Staffed by RNs, LPNs, and CNAs. Inspected and star-rated annually by CMS. Accepts Medicare (short-term rehab) and Medicaid (long-term care).
Respite Care Short-term temporary care — days to weeks — to give family caregivers a break. Full care provided during the stay. Often used after hospitalization or to trial a facility before a permanent placement decision.
Home Care Professional care delivered in the person's own home — from companionship and errands to skilled nursing and therapy. Allows seniors to age in place. Medicare covers skilled home health when medically necessary.
Nursing Home Licensed facility providing 24/7 skilled nursing care for residents with complex, ongoing medical needs. Staffed by RNs, LPNs, and CNAs. Inspected and star-rated annually by CMS. Accepts Medicare (short-term rehab) and Medicaid (long-term care).
Nursing Home Licensed facility providing 24/7 skilled nursing care for residents with complex, ongoing medical needs. Staffed by RNs, LPNs, and CNAs. Inspected and star-rated annually by CMS. Accepts Medicare (short-term rehab) and Medicaid (long-term care).
![]() 3.6 miles from city center — 9.89 miles to nearest hospital (Boulder Valley Anesthesiology, PLLC)
3.6 miles from city center — 9.89 miles to nearest hospital (Boulder Valley Anesthesiology, PLLC)
![]() 1960 S Fordham St, Longmont, CO 80503
1960 S Fordham St, Longmont, CO 80503
Add your location
This data corresponds to Q2 2025 and is based on CMS Payroll-Based Journal.
Colorado average ratio: 1.91:1
Colorado average: 8.3 hours
Manages medical care and health needs.
No contractors work on this role.
Assists with medical care and medications.
No contractors work on this role.
Helps with daily care and mobility.
No contractors work on this role.
Total hours from contractors
174 contractor hours this quarter
| Certified Nursing Assistant | 12 | 0 | 12 | 1,257 | 30 | 100% | 9.3 |
| Registered Nurse | 6 | 0 | 6 | 613 | 29 | 97% | 11.4 |
| Licensed Practical Nurse | 7 | 0 | 7 | 494 | 28 | 93% | 9.1 |
| Clinical Nurse Specialist | 2 | 0 | 2 | 186 | 17 | 57% | 8.1 |
| Other Dietary Services Staff | 1 | 0 | 1 | 175 | 23 | 77% | 7.6 |
| Administrator | 1 | 0 | 1 | 168 | 21 | 70% | 8 |
| Speech Language Pathologist | 0 | 1 | 1 | 130 | 21 | 70% | 6.2 |
| Nurse Practitioner | 2 | 0 | 2 | 80 | 10 | 33% | 8 |
| Physical Therapy Assistant | 0 | 1 | 1 | 24 | 4 | 13% | 5.9 |
| Respiratory Therapy Technician | 0 | 2 | 2 | 15 | 17 | 57% | 0.7 |
| Qualified Social Worker | 0 | 1 | 1 | 5 | 4 | 13% | 1.2 |
Source: CMS Long-Term Care Facility Characteristics (Data as of Jan 2026)
Residents meet regularly to discuss policies, care quality, and activities
Organized group of residents that meets regularly to discuss facility policies, quality of life, and activities.
Data sourced from CMS Long-Term Care Facility Characteristics quarterly report. Payer mix reflects the current resident census by primary payment source.
These measures show how residents usually do over time at this home, based on health outcomes and preventive care.
Colorado average: 9.0
Colorado average: 18.8
Colorado average: 16.0%
Colorado average: 17.0%
Colorado average: 23.2%
Colorado average: 3.3%
Colorado average: 3.9%
Colorado average: 1.4%
Colorado average: 5.2%
Colorado average: 7.2%
Colorado average: 18.8%
Colorado average: 93.3%
Colorado average: 94.7%
Colorado average: 76.6%
Colorado average: 1.4%
Colorado average: 75.6%
Colorado average: 20.3%
Colorado average: 12.8%
Colorado average: 0.8%
Colorado average: 53.7%
Colorado average: 50.6%
Quality measures are calculated from Minimum Data Set (MDS) assessments. For most measures, lower percentages indicate better care quality.
Federal penalties imposed by CMS for regulatory violations, including civil money penalties (fines) and denials of payment for new Medicare/Medicaid admissions.
Source: CMS Penalties Database (Data as of Jan 2026)
Colorado average: $40K
Colorado average: 2.2
Colorado average: 0.3
Penalties are imposed by CMS for violations of federal nursing home regulations.
Last updated: Jan 2026
Historical financial and operational data for Accel at Longmont based on CMS SNF Cost Reports.
Loading trend charts...
Care Cost Calculator: See Prices in Your Area
Nursing Home Data Explorer
Don’t Wait Too Long: 7 Red Flag Signs Your Parent Needs Assisted Living Now
The True Cost of Assisted Living in 2025 – And How Families Are Paying For It
Understanding Senior Living Costs: Pricing Models, Discounts & Financial Assistance

Touring a community? Use this expert-backed checklist to stay organized, ask the right questions, and find the perfect fit.
We'll send you a PDF version of the touring checklist.