


Total staff
72
Employees
60
Contractors
12
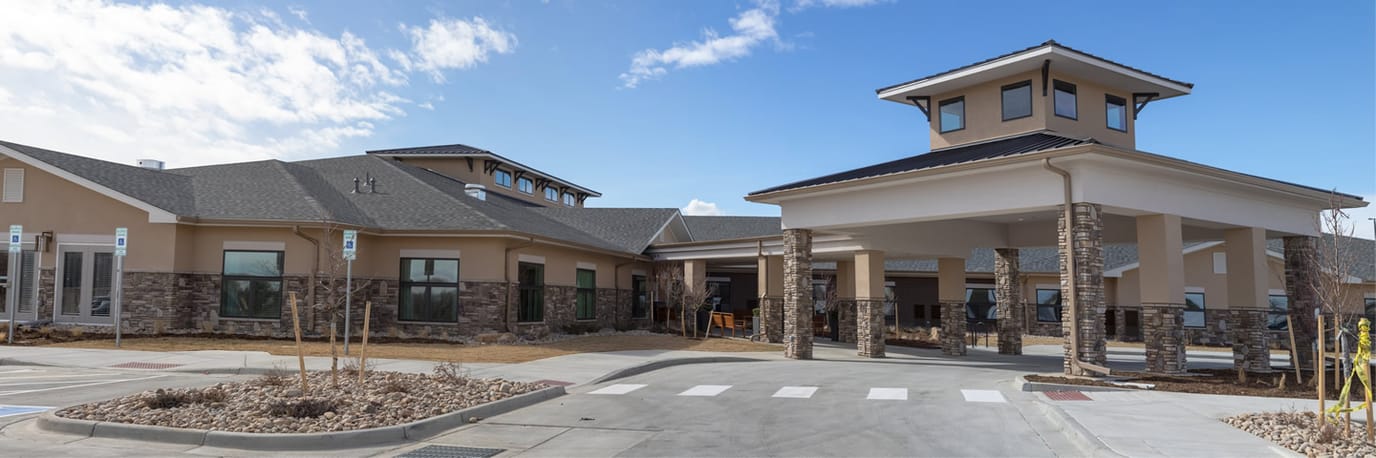


Accel at Longmont, a 116-bed skilled nursing and respite care facility at 1960 S Fordham St in Longmont, Boulder County, Colorado, is operated by Longmont Tc, LLC. It accepts Medicare, Medicaid, and private pay, with most residents staying an average of 38 days.
The community carries a 1-star CMS overall rating, with all three performance categories: health inspection, staffing, and quality measures scoring at the same 1-star level. Health inspection performance falls 68.2% below Colorado benchmarks.
Between 2023 and 2024, the facility received four separate federal penalties totaling $88,000, significantly exceeding the state average of two penalties per facility and $40,000 combined.
At 1 hour 14 minutes per resident per day, it ranks dead last among Colorado’s 177 skilled nursing facilities, falling far short of the state average of 3 hours 52 minutes. Weekend coverage drops further to 1 hour 7 minutes per resident per day, leaving just 66% of the state’s already-limited weekend baseline. The staff-to-resident ratio is 1.47:1.
Falls with serious injury occur at 9.3%; nearly three times the 3.3% state rate. Urinary tract infections affect 3.6% of residents, triple the Colorado average. High-risk residents develop pressure ulcers at 7.9%, double the benchmark.
The facility operates at an annual loss of $1.5 million on $9.1 million in revenue.
Occupancy stands at 37.9%, half the state average.
On-site pharmacy, dental, podiatry, and optometry services are available, along with beauty and barber facilities.
The facility’s current care model and staffing structure orient it toward short-term post-acute stays.
| Staff type | Hours / Day / Resident | vs state avg |
|---|---|---|
|
Registered Nurse (RN)
| 42m per day | ▼ 17% State avg: 50m per day · National avg: 41m per day |
|
LPN / LVN
| 36m per day | ▼ 12% State avg: 41m per day · National avg: 52m per day |
|
Nurse Aide
| 1h 59m per day | ▼ 10% State avg: 2h 13m per day · National avg: 2h 21m per day |
|
Weekend Total Nursing
| 2h 52m per day | ▼ 12% State avg: 3h 17m per day · National avg: 3h 26m per day |
|
Physical Therapist
| 1m per day | ▼ 84% State avg: 5m per day · National avg: 4m per day |
|
Weekend RN
| 49m per day | ▲ 36% State avg: 36m per day · National avg: 29m per day |
Reporting period: October 1 – December 31, 2025 (Q4 2025). Source: CMS Payroll-Based Journal report.
Manages medical care and health needs.
Assists with medical care and medications.
Helps with daily care and mobility.
Total hours from contractors
366 contractor hours this quarter
| Certified Nursing Assistant | 31 | 0 | 31 | 8,644 | 92 | 100% | 9.4 |
| Registered Nurse | 12 | 0 | 12 | 2,664 | 91 | 99% | 9.6 |
| Licensed Practical Nurse | 8 | 0 | 8 | 2,632 | 91 | 99% | 9.4 |
| Administrator | 4 | 0 | 4 | 485 | 49 | 53% | 8.4 |
| Other Dietary Services Staff | 2 | 0 | 2 | 476 | 61 | 66% | 7.8 |
| Clinical Nurse Specialist | 1 | 0 | 1 | 364 | 42 | 46% | 8.7 |
| Speech Language Pathologist | 0 | 3 | 3 | 192 | 30 | 33% | 3.8 |
| Mental Health Service Worker | 1 | 0 | 1 | 184 | 23 | 25% | 8 |
| Dental Services Staff | 1 | 0 | 1 | 168 | 21 | 23% | 8 |
| Physical Therapy Assistant | 0 | 3 | 3 | 61 | 33 | 36% | 1.8 |
| Respiratory Therapy Technician | 0 | 3 | 3 | 58 | 25 | 27% | 2.1 |
| Physical Therapy Aide | 0 | 1 | 1 | 44 | 27 | 29% | 1.6 |
| Qualified Social Worker | 0 | 2 | 2 | 11 | 25 | 27% | 0.4 |
Includes penalties issued in 2023-2024
Federal penalties imposed by CMS for regulatory violations, including civil money penalties (fines) and denials of payment for new Medicare/Medicaid admissions.
Source: CMS Penalties Database (Data as of Jan 2026)
Colorado average: $40K
Colorado average: 2.2
Colorado average: 0.3
Penalties are imposed by CMS for violations of federal nursing home regulations.
3 penalties in the past 3 years
Multiple penalties were reported in the last 3 years.
Last updated: Jan 2026
These measures show how residents usually do over time at this home, based on health outcomes and preventive care.
Colorado average: 9.0
Colorado average: 18.8
Colorado average: 16.0%
Colorado average: 17.0%
Colorado average: 23.2%
Colorado average: 3.3%
Colorado average: 3.9%
Colorado average: 1.4%
Colorado average: 5.2%
Colorado average: 7.2%
Colorado average: 18.8%
Colorado average: 93.3%
Colorado average: 94.7%
Colorado average: 76.6%
Colorado average: 1.4%
Colorado average: 75.6%
Colorado average: 20.3%
Colorado average: 12.8%
Colorado average: 0.8%
Colorado average: 53.7%
Colorado average: 50.6%
Quality measures are calculated from Minimum Data Set (MDS) assessments. For most measures, lower percentages indicate better care quality.
32% of new residents, usually for short-term rehab.
66% of new residents, often for short stays.
2% of new residents, often for long-term daily care.
Source: CMS Long-Term Care Facility Characteristics (Data as of Jan 2026)
Residents meet regularly to discuss policies, care quality, and activities
Organized group of residents that meets regularly to discuss facility policies, quality of life, and activities.
Data sourced from CMS Long-Term Care Facility Characteristics quarterly report. Payer mix reflects the current resident census by primary payment source.
Historical financial and operational data for Accel at Longmont from 2019–2023, based on CMS SNF Cost Reports.
Key figures below are for fiscal year ending in 12/2023.
Based on CMS SNF Cost Report for fiscal year ending in 12/2023.
Residents typically stay for brief periods, with frequent admissions and discharges throughout the year.
Most new residents arrive under private pay (66% of admissions), and a typical private pay stay runs around 1 - 2 months.
Coverage residents most often arrive under.
Coverage residents most often leave under.
![]() 3.6 miles from city center
3.6 miles from city center
![]() Estimated distance in miles from Longmont's city center to Accel at Longmont's address, calculated via Google Maps.
Estimated distance in miles from Longmont's city center to Accel at Longmont's address, calculated via Google Maps.
Add your location
The information below is reported by the Colorado Department of Public Health and Environment, Health Facilities Division.
| Hover Senior Living Community | NH AL IL SNF | Longmont | 25
Facility
25
CO AVG
76
Rank
#419 / 527 | - | - | 6.55
Facility
6.55
CO AVG
3.86
Rank
#5 / 211 | +39% | +70% | $42.1k
Facility
$42.1k
CO AVG
$39.2k
Rank
#175 / 217 | 7
Facility
7
CO AVG
24.8
Rank
#12 / 212 | 2.3
Facility
2.3
CO AVG
5.2
Rank
#10 / 212 | 2 | 25 | - |
46
Facility
46
CO AVG
51
Rank
#524 / 869 | Madelyn Chapman | $4.7MFiscal year ending 12/2023
Facility
$4.7MFiscal year ending 12/2023
CO AVG
$11.2M
Rank
#9 / 217 | $7.1MFiscal year ending 12/2023
Facility
$7.1MFiscal year ending 12/2023
CO AVG
$4.9M
Rank
#74 / 217 | 151.1%Fiscal year ending 12/2023
Facility
151.1%Fiscal year ending 12/2023
CO AVG
46.6%
Rank
#211 / 217 | 65395 | ||||
| Peaks Care Center | NH AL IL SNF | Longmont (Coffman Street) | 92
Facility
92
CO AVG
76
Rank
#189 / 527 | - | - | 3.50
Facility
3.50
CO AVG
3.86
Rank
#115 / 211 | +41% | -9% | $0
Facility
$0
CO AVG
$39.2k
Rank
#1 / 217 | 22
Facility
22
CO AVG
24.8
Rank
#95 / 212 | 4.4
Facility
4.4
CO AVG
5.2
Rank
#82 / 212 | 1 | 79 | A+ |
80
Facility
80
CO AVG
51
Rank
#107 / 869 | Bogie33 | $8.3MFiscal year ending 12/2023
Facility
$8.3MFiscal year ending 12/2023
CO AVG
$11.2M
Rank
#112 / 217 | $4.3MFiscal year ending 12/2023
Facility
$4.3MFiscal year ending 12/2023
CO AVG
$4.9M
Rank
#155 / 217 | 51.4%Fiscal year ending 12/2023
Facility
51.4%Fiscal year ending 12/2023
CO AVG
46.6%
Rank
#169 / 217 | 65189 | ||||
| Life Care Center of Longmont | NH SNF | Longmont | 187
Facility
187
CO AVG
76
Rank
#13 / 527 |
64.0%
Facility
64.0%
CO AVG
70.7
Rank
#103 / 149 | -9% | 3.48
Facility
3.48
CO AVG
3.86
Rank
#115 / 211 | +31% | -10% | $0
Facility
$0
CO AVG
$39.2k
Rank
#1 / 217 | 18
Facility
18
CO AVG
24.8
Rank
#74 / 212 | 3.6
Facility
3.6
CO AVG
5.2
Rank
#55 / 212 | 1 | 120 | - |
54
Facility
54
CO AVG
51
Rank
#429 / 869 | Jerusha Siegel | $18.5MFiscal year ending 06/2024
Facility
$18.5MFiscal year ending 06/2024
CO AVG
$11.2M
Rank
#23 / 217 | $11.7MFiscal year ending 06/2024
Facility
$11.7MFiscal year ending 06/2024
CO AVG
$4.9M
Rank
#12 / 217 | 63.2%Fiscal year ending 06/2024
Facility
63.2%Fiscal year ending 06/2024
CO AVG
46.6%
Rank
#112 / 217 | 65282 | ||||
| Accel at Longmont | NH RC | Longmont | 5
Facility
5
CO AVG
76
Rank
#523 / 527 | - | - | 1.23
Facility
1.23
CO AVG
3.86
Rank
#211 / 211 | +19% | -68% | $168.2k
Facility
$168.2k
CO AVG
$39.2k
Rank
#213 / 217 | 53
Facility
53
CO AVG
24.8
Rank
#204 / 212 | 7.6
Facility
7.6
CO AVG
5.2
Rank
#181 / 212 | 6 | 47 | - |
18
Facility
18
CO AVG
51
Rank
#762 / 869 | Longmont Tc, LLC | $7.7MFiscal year ending 12/2023
Facility
$7.7MFiscal year ending 12/2023
CO AVG
$11.2M
Rank
#156 / 217 | $3.4MFiscal year ending 12/2023
Facility
$3.4MFiscal year ending 12/2023
CO AVG
$4.9M
Rank
#197 / 217 | 44.5%Fiscal year ending 12/2023
Facility
44.5%Fiscal year ending 12/2023
CO AVG
46.6%
Rank
#200 / 217 | 65429 |
Accel at Longmont is located in Longmont, Colorado.
Here are the financial assistance programs available to residents in Colorado.
Accel at Longmont has a walk score of 18. Car-dependent. Most errands require a car, with limited nearby walkable options.
Accel at Longmont's occupancy is 37.9%.
No, Accel at Longmont has a no-pet policy.
Accel at Longmont is registered as a for-profit.
Yes — there are 6 photos of Accel at Longmont in the photo gallery on this page.
Accel at Longmont is located at 1960 S Fordham St, Longmont, CO 80503.
(720) 494-2624 will put you in contact with the team at Accel at Longmont.
Care Cost Calculator: See Prices in Your Area
Nursing Home Data Explorer
Don’t Wait Too Long: 7 Red Flag Signs Your Parent Needs Assisted Living Now
The True Cost of Assisted Living in 2025 – And How Families Are Paying For It
Understanding Senior Living Costs: Pricing Models, Discounts & Financial Assistance


