Peaks Care Center
Nursing Home, Independent Living, Assisted Living & Skilled Nursing · Longmont, CO
CMS overall rating Info The Overall CMS Rating is scored from 1 to 5 stars and combines results from health inspections, staffing levels, and quality measures. Health inspections carry the most weight. Staffing and quality scores can increase or decrease the final rating based on performance compared to state and national standards.

Peaks Care Center

Nursing Home, Independent Living, Assisted Living & Skilled Nursing · Longmont, CO
CMS overall rating Info The Overall CMS Rating is scored from 1 to 5 stars and combines results from health inspections, staffing levels, and quality measures. Health inspections carry the most weight. Staffing and quality scores can increase or decrease the final rating based on performance compared to state and national standards.
Calculator: See prices in your area
Peaks Care Center accepts Medicaid, Medicare, and private pay.

Overview of Peaks Care Center

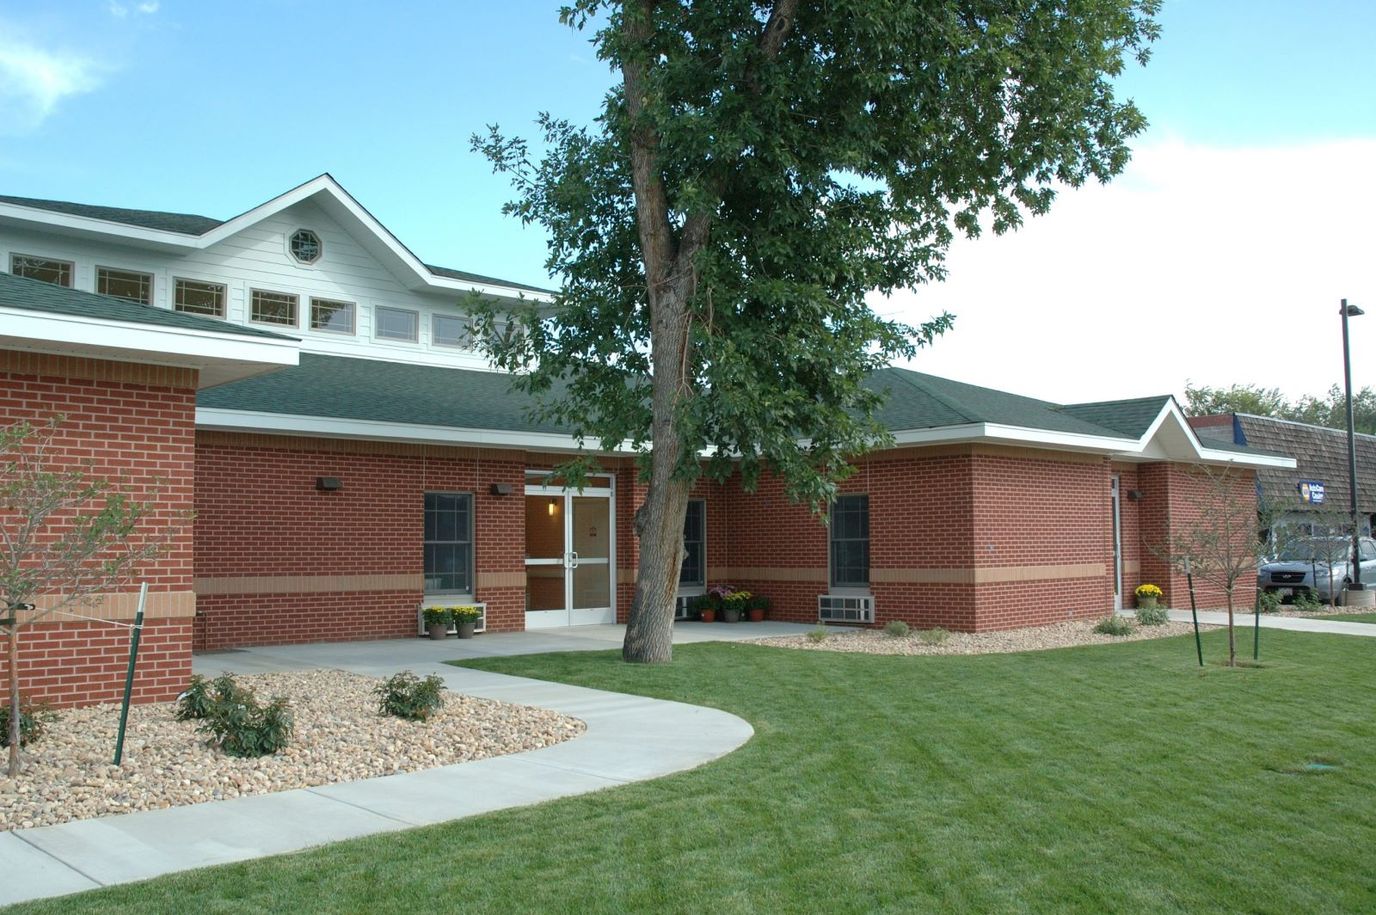
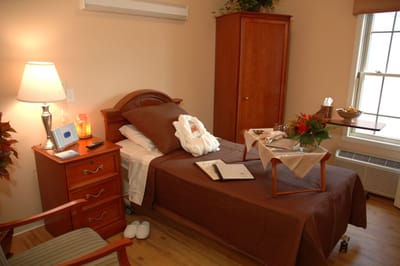
The Peaks Care Center stands out as a premier community, offering exceptional care services tailored to the evolving needs of individuals and couples facing the challenges of aging. This multi facility care center encompasses a wide spectrum of services, including frontier therapy, independent living, assisted living, and skilled nursing. Their dedicated professionals provide top-tier care, ensuring residents receive the highest standard of support and attention.

At the heart of their services is the Frontier Therapy Center, equipped with 21 beds for inpatient therapy, specifically designed to address the recovery needs of adults. The Peaks Care Center is renowned for its award-winning approach, delivering skilled nursing services that include wound care, IV therapy, medication management, nutritionally balanced meals, and respiratory support, among other essential offerings. With their nursing home qualifications and commitment to excellence, residents can trust in a compassionate and skilled environment tailored to their unique needs.

Quality ratings

Measured by Centers for Medicare & Medicaid Services (CMS)

Overall rating Info The Overall CMS Rating combines results from health inspections, staffing levels and quality measures. Health inspections carry the most weight. Staffing and quality scores can increase or decrease the final rating based on performance compared to state and national standards.
▲ 57.7% Above CO avg.
Health Inspection Info Based on the results of the facility's three most recent standard inspections and any complaint investigations. CMS reviews the number, scope, and severity of deficiencies, with more recent findings weighted more heavily.
▲ 78.6% Above CO avg.
Staffing Info Measures average nursing staff hours per resident per day, including Registered Nurses (RNs) and total nursing staff. Ratings are adjusted based on the level of care residents require and are compared to state and national benchmarks.
▼ 4.5% Below CO avg.
Quality Measures Info Based on clinical and physical health indicators reported to CMS, such as hospital readmissions, falls, pressure ulcers, and improvements in mobility. These measures reflect how well residents' health needs are being managed.
▼ 2.9% Below CO avg.

Staffing hours breakdown

Info Daily nursing hours per resident by staff type, reported to CMS. Higher is generally better — compare this facility to state and national averages to see where staffing stands.

Hours per resident per day — compared to Colorado state averages

Total nursing care / resident Info This home is ranked 98th out of 161 homes in Colorado.

Total adjusted nursing hours per resident per day, combining RN, LPN, and aide time. CMS adjusts this for case-mix so facilities can be fairly compared.
3h 30m per day
Rank #98 / 161Nurse hours — state benchmarkedThis home is ranked 98th out of 161 homes in Colorado.Shows adjusted nurse hours per resident per day benchmarked to the Colorado average, with a ranking across 161 Colorado SNFs. More hours mean more direct care. The national average is about 3.5 hrs; below 3.0 is a red flag.
This facility Colorado avg (3h 51m per day)
vs Colorado avg
-9%

4 of 6 metrics below state avg

Standout metric LPN / LVN is +17% above state avg
Staff typeHours / dayvs state avg
Registered Nurse (RN) Info RNs hold the highest nursing license and can assess residents, interpret test results, and direct care plans. More RN hours per day often signals stronger clinical oversight and faster response to health changes. 41m per day ▼ 18% State avg: 50m per day · National avg: 41m per day
LPN / LVN Info Licensed Practical Nurses (LPNs) or Licensed Vocational Nurses (LVNs) deliver routine hands-on care — medication administration, wound dressing, and monitoring vital signs. They work under RN supervision and make up a large share of daily bedside care. 48m per day ▲ 17% State avg: 41m per day · National avg: 52m per day
Nurse Aide Info Certified Nurse Aides (CNAs) provide the most direct day-to-day assistance: bathing, dressing, feeding, and mobility. Nurse aide hours are typically the largest staffing category and directly affect residents' quality of life. 1h 55m per day ▼ 14% State avg: 2h 13m per day · National avg: 2h 21m per day
Total Nursing (Weekend) Info Combined nursing hours (RN + LPN + Nurse Aide) per resident per day on weekends. Staffing often drops on weekends — this figure reveals whether the facility maintains adequate coverage outside of weekday hours. 2h 59m per day ▼ 9% State avg: 3h 17m per day · National avg: 3h 26m per day
Physical Therapist Info Hours per resident per day provided by licensed Physical Therapists (PTs) or PT Assistants. PT services help residents recover mobility after injury or illness and are especially important for post-acute (short-stay) rehabilitation. 4m per day ▼ 20% State avg: 5m per day · National avg: 4m per day
RN (Weekend) Info Registered nurse hours specifically on weekends. Facilities sometimes reduce RN presence on Saturdays and Sundays — a low weekend RN figure compared to weekday hours can indicate reduced clinical oversight when most administrative staff are absent. 36m per day ■ Avg State avg: 36m per day · National avg: 29m per day

Capacity and availability

Avg. Length of Stay
58 days

Who this home usually serves

TYPE OF STAY

Primarily short stays

Residents typically stay for brief periods, with frequent admissions and discharges throughout the year.

Breakdown by payment type

Medicare

25% of new residents, usually for short-term rehab.

Typical stay 19 days

Private pay

65% of new residents, often for short stays.

Typical stay 1 - 2 months

Medicaid

10% of new residents, often for long-term daily care.

Typical stay 12 months

Finances and operations

Privately-owned community
Operated by a partnership between two or more business owners.
Home revenue
$11.7M
Profit
$115.3K
Privately-owned community Operated by a partnership between two or more business owners.
Home revenue
$11.7M Rank #82 / 165Revenue — state benchmarkedThis home is ranked 82nd out of 165 homes in Colorado.Shows this facility's annual revenue compared to the Colorado SNF average. Higher revenue generally means more resources for staffing and capital — read alongside Payroll %.
Profit
$115.3K
Payroll costs Info The portion of the home's budget spent on staff, including nurses, caregivers, and other employees who support care and operations. Rank #115 / 165Payroll — state benchmarkedThis home is ranked 115th out of 165 homes in Colorado.Shows total annual staff payroll benchmarked to the Colorado average. Higher payroll investment relative to peers often signals better staffing and less reliance on cheaper contract labor.
$5.1M
43.5% of revenue Rank #143 / 165Payroll % — state benchmarkedThis home is ranked 143rd out of 165 homes in Colorado.Shows payroll as a percentage of revenue versus the Colorado average. Well-run SNFs often land around 55–65%. Below 25% may signal understaffing or heavy agency use — read with Staffing ratings.
Other operating costs Info All remaining costs needed to run the home, such as food, utilities, building maintenance, supplies and administrative expenses.
$6.5M
Total costs $11.6M
Bed community size
92-bed community
A larger shared setting that may offer more common spaces and organized community services.
Walk Score
Walk Score: 80 / 100 Rank #4 / 74Walk Score — state benchmarkedThis home is ranked 4th out of 74 homes in Colorado.Shows how walkable this facility's neighborhood is compared to the average Walk Score across Colorado SNFs. Higher scores benefit residents, families, and staff.
Very walkable. Most errands can be accomplished on foot, and many essentials are within a short walk.
BBB Rating
BBB Rating: A+ (Not Accredited)
An independent rating from the Better Business Bureau based on factors such as complaint history, transparency, and business practices.
How BBB ratings work

About this community

Occupancy

Occupancy rate
80%
Rank #69 / 165Occupancy rate — state benchmarkedThis home is ranked 69th out of 165 homes in Colorado.Shows this facility's occupancy rate versus the Colorado average, with its statewide rank out of 165. Higher occupancy signals strong local demand and financial stability.
Similar to the Colorado average: 76.5%
Occupied beds
74 / 92
Average residents per home in Colorado 72 per day

License Details

StatusActive
CMS Certification Number65189
AccreditationsFive-Star Quality, Great Place to Work, 2025 Bronze National Quality Award

Ownership & Operating Entity

Peaks Care Center is administrated by Julian Hazlett.

OwnerHEIGHTS HEALTHCARE COMPANY, LLC

Therapy & Rehabilitation

1 service
Rehabilitation Services

Staffing & Medical

1 service
24-Hour Staffing

Amenities & Lifestyle

Specific ProgramsFrontier Therapy
Operating HoursVisiting Hours 24/7

Types of Care at Peaks Care Center

Independent Living Assisted Living Skilled Nursing

Contact Peaks Care Center

Inspection History

In Colorado, the Department of Public Health and Environment, Health Facilities Division is the regulatory body that performs unannounced surveys and publishes facility inspection findings.

Since 2018 · 8 years of data 23 deficiencies

Inspection Scorecard Info This scorecard compares key inspection, citation, and complaint metrics at this facility against the Colorado state average. Metrics rated ≥15% worse than average are highlighted in red; those ≥15% better are highlighted in green.

Since 2018 vs. Colorado state average
Overall vs. CO average 0 Worse No metrics in this bucket. 2 Better Metrics better than Colorado average:
• Total deficiencies (23% below)
• Deficiencies per year (24% below)
Latest Inspection October 29, 2025 Complaint Investigation

Deficiencies Info Deficiencies are formal regulatory issues recorded during state inspections.

MetricThis FacilityCO Averagevs. CO Avg
Total deficiencies Info Formal regulatory issues recorded by inspectors across all inspection types. 2330 This facility has 23% fewer total deficiencies than a typical Colorado nursing home (23 vs. CO avg 30).↓ 23% better
Deficiencies per year Info Average deficiencies per year since 2018. 2.93.8 This facility has 24% fewer deficiencies per year than a typical Colorado nursing home (2.9 vs. CO avg 3.8).↓ 24% better

Inspection Reports Summary Info An editor-reviewed summary of the themes and findings across this facility's recent inspection reports.

This facility’s inspection record is mixed, showing repeated issues with fall prevention and medication communication despite some improvements. The most recent inspection on October 29, 2025, cited one deficiency for inadequate supervision and improper transfer techniques that caused a resident’s rib fractures. Previous complaint investigations in 2024 substantiated failures to assess residents after falls and to notify specialists about medication orders, indicating ongoing challenges with resident safety and care coordination.

Read the full inspection reports for this facility, including detailed findings and corrective actions.

Show Inspection Reports

Health Inspection History

Inspections
Total health inspections 5

Colorado average 4.8


Last Health inspection on Oct 2025

Total health citations
22 Rank #75 / 165Health citations — state benchmarkedThis home is ranked 75th out of 165 homes in Colorado.Shows this facility's total health deficiency citations benchmarked to the Colorado state average, with a ranking across all 165 CO SNFs. Lower citation counts earn a better rank.

Colorado average 24.8

Citations per inspection
4.4 Rank #70 / 165Citations per inspection — state benchmarkedThis home is ranked 70th out of 165 homes in Colorado.Shows average deficiency citations per CMS inspection for this facility versus the Colorado mean across 165 SNFs with citation data. Lower is better.

Colorado average 5.2


Health citations are formal notices following inspections when they fail to comply with safety and care standards.

20 of 22 citations resulted from standard inspections; and 2 of 22 resulted from complaint investigations.

Breakdown of citation severity (last 8 years)
Critical Health citations More info
0
100% better than Colorado average

Colorado average: 0.4


Serious Health citations More info 1
52% better than Colorado average

Colorado average: 2.1

0 critical citations More info Colorado average: 0.4

1 serious citation More info Colorado average: 2.1

20 moderate citations More info Colorado average: 22.2

1 minor citation More info Colorado average: 0.2
Citations history (last 8 years)
Quality of Care serious citation Info Issues related to how well residents receive appropriate treatment and support for their medical and daily care needs. Oct 29, 2025
Corrected

Quality of Care moderate citation Info Issues related to how well residents receive appropriate treatment and support for their medical and daily care needs. Aug 20, 2024
Corrected

Pharmacy moderate citation Info Issues related to medication management, including how drugs are stored, administered, and monitored. Feb 29, 2024
Corrected

Quality of Care moderate citation Info Issues related to how well residents receive appropriate treatment and support for their medical and daily care needs. Feb 29, 2024
Corrected

Financial Assistance for
Nursing Home in Colorado

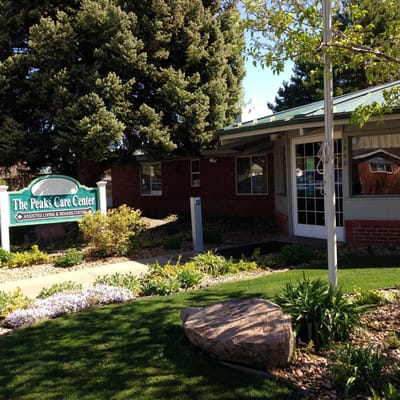
Peaks Care Center is located in Longmont, Colorado.
Here are the financial assistance programs available to residents in Colorado.

Get Financial aid guidance

Elderly, Blind, and Disabled Waiver

Colorado Medicaid EBD Waiver

Age 65+ or disabled
General Colorado resident, Medicaid- eligible, nursing home-level care need.
Income Limits (2025) ~$2,829/month 300% FBR, individual
Asset Limits $2,000 (individual), $3,000 (couple).
CO

Requires level-of-care assessment by case manager.

Benefits
Personal care (5-7 hours/day) Respite care (up to 240 hours/year) Adult day care ($65/day) Home modifications ($1,500 avg.)

Old Age Pension (OAP) Health Care Program

Colorado OAP

Age 60+
General Colorado resident.
Income Limits ~$1,215/month individual
Asset Limits $2,000 individual
CO

Supplements SSI; limited medical coverage.

Benefits
Cash (~$100-$800/month) Limited in-home care (2-3 hours/week) Medical assistance

Program of All-Inclusive Care for the Elderly (PACE)

Colorado Medicaid PACE

Age 55+
General Colorado resident, nursing home-level care need, safe with PACE support.
Income Limits (2025) ~$2,829/month 300% FBR
Asset Limits $2,000 (individual), $3,000 (couple).
CO

Limited to specific regions (e.g., Denver, Pueblo).

Benefits
All-inclusive care—personal care (5-7 hours/day) Meals Transportation Therapy Medical visits

Home Care Allowance (HCA)

Colorado Home Care Allowance (HCA)

Age
General Seniors typically 65+, Age 5+ with disability, Colorado resident, financial/functional need.
Income Limits (2025) ~$1,004/month individual, stricter than waivers
Asset Limits $2,000 (individual), $3,000 (couple).
CO

Must need help with ADLs; not Medicaid-waiver eligible.

Benefits
Personal care (~4-6 hours/day, paid to provider) E.g. Bathing Dressing

Places of interest near Peaks Care Center

Address 1.4 miles from city center Info Estimated distance in miles from Longmont's city center to Peaks Care Center's address, calculated via Google Maps. — 0.89 miles to nearest hospital (NextCare Urgent Care Longmont)

Calculate Travel Distance to Peaks Care Center

Add your location

Address

Staffing Data (Q2 2025)

This data corresponds to Q2 2025 and is based on CMS Payroll-Based Journal.

Total staff 105
Employees 83
Contractors 22
Staff to resident ratio 1.64:1
14% worse than Colorado average

Colorado average ratio: 1.91:1

Avg staff/day 35
Average shift 9 hours
8% better than Colorado average

Colorado average: 8.3 hours

Total staff hours (quarter) 28,579

Nursing staff breakdown

Registered Nurse

Manages medical care and health needs.

Total count 19
Average shift length Info Average shift length. Calculated as total hours divided by days worked and average staff per day. 10.3 hours

No contractors work on this role.

Licensed Practical Nurse

Assists with medical care and medications.

Total count 16
Average shift length Info Average shift length. Calculated as total hours divided by days worked and average staff per day. 10.3 hours

No contractors work on this role.

Certified Nursing Assistant

Helps with daily care and mobility.

Total count 42
Average shift length Info Average shift length. Calculated as total hours divided by days worked and average staff per day. 9.1 hours

No contractors work on this role.

Contractor staffing

Total hours from contractors

10.6%

3,016 contractor hours this quarter

Speech Language Pathologist: 6 Physical Therapy Aide: 4 Physical Therapy Assistant: 3 Respiratory Therapy Technician: 3 Qualified Social Worker: 1 Therapeutic Recreation Specialist: 1 Occupational Therapy Aide: 1 Occupational Therapy Assistant: 1 Medical Director: 1 Mental Health Service Worker: 1

Staff by category

Certified Nursing Assistant4204212,65991100%9.1
Licensed Practical Nurse160165,20891100%10.3
Registered Nurse190194,71091100%10.3
Other Dietary Services Staff2029837886%7.8
Speech Language Pathologist0667396571%7
Physical Therapy Assistant0335716875%7.8
Physical Therapy Aide0445596571%6.8
Respiratory Therapy Technician0335205965%8.8
Administrator1015126470%8
RN Director of Nursing1015096066%8.5
Nurse Practitioner1015066673%7.7
Dental Services Staff1014766066%7.9
Qualified Social Worker0113715763%6.5
Occupational Therapy Aide0111762629%6.8
Occupational Therapy Assistant011391112%3.5
Therapeutic Recreation Specialist0111633%5.4
Medical Director01114910%1.6
Mental Health Service Worker0111222%6
42 Certified Nursing Assistant
% of Days 100%
16 Licensed Practical Nurse
% of Days 100%
19 Registered Nurse
% of Days 100%
2 Other Dietary Services Staff
% of Days 86%
6 Speech Language Pathologist
% of Days 71%
3 Physical Therapy Assistant
% of Days 75%
4 Physical Therapy Aide
% of Days 71%
3 Respiratory Therapy Technician
% of Days 65%
1 Administrator
% of Days 70%
1 RN Director of Nursing
% of Days 66%
1 Nurse Practitioner
% of Days 73%
1 Dental Services Staff
% of Days 66%
1 Qualified Social Worker
% of Days 63%
1 Occupational Therapy Aide
% of Days 29%
1 Occupational Therapy Assistant
% of Days 12%
1 Therapeutic Recreation Specialist
% of Days 3%
1 Medical Director
% of Days 10%
1 Mental Health Service Worker
% of Days 2%

Facility Characteristics

Source: CMS Long-Term Care Facility Characteristics (Data as of Jan 2026)

Total residents 64
Medicare
8
12.5% of residents
Medicaid
38
59.4% of residents
Private pay or other
18
28.1% of residents
Programs & Services
Residents Group

Residents meet regularly to discuss policies, care quality, and activities

Family Member Group

Family members meet regularly to discuss policies, care quality, and activities

CCRC

Part of a Continuing Care Retirement Community offering multiple care levels

Active Family Council

Organized group of family members that meets regularly to discuss facility policies, resident care, and activities.

Active Resident Council

Organized group of residents that meets regularly to discuss facility policies, quality of life, and activities.

Quality of care over time

These measures show how residents usually do over time at this home, based on health outcomes and preventive care.

High-risk clinical events score Info A composite score based on pressure ulcers, falls with injury, weight loss, walking ability decline, and activities of daily living decline. 13.5
50% worse than Colorado average

Colorado average: 9.0

Functional decline score Info A composite score based on activities of daily living decline, walking ability decline, and incontinence. 25.8
37% worse than Colorado average

Colorado average: 18.8

Long-stay resident measures
Above average Colorado avg: 3.9 Info CMS star rating based on long-stay quality measure performance. 5 stars = significantly above average, 1 star = significantly below average.
Need for Help with Daily Activities Increased Info Percent of long-stay residents whose need for help with daily activities has increased 19.8%
23% worse than Colorado average

Colorado average: 16.0%

Walking Ability Worsened Info Percent of long-stay residents whose ability to move independently worsened 30.2%
78% worse than Colorado average

Colorado average: 17.0%

Low Risk Residents with Bowel/Bladder Incontinence Info Percent of low risk long-stay residents who lose control of their bowels or bladder 27.3%
18% worse than Colorado average

Colorado average: 23.2%

Falls with Major Injury Info Percent of long-stay residents experiencing one or more falls with major injury 2.3%
32% better than Colorado average

Colorado average: 3.3%

High Risk Residents with Pressure Ulcers Info Percent of long-stay high risk residents with pressure ulcers 2.7%
30% better than Colorado average

Colorado average: 3.9%

Urinary Tract Infection Info Percent of long-stay residents with a urinary tract infection 0.9%
36% better than Colorado average

Colorado average: 1.4%

Lost Too Much Weight Info Percent of long-stay residents who lose too much weight 12.6%
143% worse than Colorado average

Colorado average: 5.2%

Depressive Symptoms Info Percent of long-stay residents who have depressive symptoms 17.4%
142% worse than Colorado average

Colorado average: 7.2%

Antipsychotic Use Info Percent of long-stay residents who received an antipsychotic medication 16.8%
10% better than Colorado average

Colorado average: 18.8%

Pneumococcal Vaccine Info Percent of long-stay residents assessed and appropriately given the pneumococcal vaccine 86.8%
7% worse than Colorado average

Colorado average: 93.3%

Influenza Vaccine Info Percent of long-stay residents assessed and appropriately given the seasonal influenza vaccine 98.3%
In line with Colorado average

Colorado average: 94.7%

Hospitalizations per 1,000 days Info Number of hospitalizations per 1,000 long-stay resident days. 1.72
32% worse than Colorado average

Colorado average: 1.30

ED visits per 1,000 days Info Number of outpatient emergency department visits per 1,000 long-stay resident days. 1.27
24% better than Colorado average

Colorado average: 1.67

Short-stay resident measures
Above average Colorado avg: 2.7 Info CMS star rating based on short-stay quality measure performance. 5 stars = much above average, 1 star = much below average.
Pneumococcal Vaccine Info Percent of short-stay residents assessed and appropriately given the pneumococcal vaccine 66.7%
13% worse than Colorado average

Colorado average: 76.6%

Antipsychotic medication increase Info Percent of short-stay residents who newly received an antipsychotic medication 0.0%
100% better than Colorado average

Colorado average: 1.4%

Influenza Vaccine Info Percent of short-stay residents assessed and appropriately given the seasonal influenza vaccine 86.1%
14% better than Colorado average

Colorado average: 75.6%

Re-hospitalized after SNF stay Info Percentage of short-stay residents who were re-hospitalized after their nursing home admission. 30.2%
49% worse than Colorado average

Colorado average: 20.3%

Emergency department visits Info Percentage of short-stay residents who had an outpatient emergency department visit. 7.4%
42% better than Colorado average

Colorado average: 12.8%

Falls with major injury Info Percentage of SNF residents who experience falls with major injury during their stay. 0.0%
100% better than Colorado average

Colorado average: 0.8%

Ability to care for self at discharge Info Percentage of residents at or above expected ability to care for themselves at discharge. 42.7%
21% worse than Colorado average

Colorado average: 53.7%

Successful return to home or community Info Rate of successful return to home or community from a skilled nursing facility. 67.1%
33% better than Colorado average

Colorado average: 50.6%

Penalties and fines

Federal penalties imposed by CMS for regulatory violations, including civil money penalties (fines) and denials of payment for new Medicare/Medicaid admissions.

Source: CMS Penalties Database

No penalties in the past 3 years

No civil money penalties or payment denials were reported in the last 3 years.

Compare Nursing Home around Longmont

The information below is reported by the Colorado Department of Public Health and Environment, Health Facilities Division.

3 facilities compared · CMS & CO Dept. of Health data · Updated May 2026

Filter by care type
Peaks Care Center
NH

Nursing Home Licensed facility providing 24/7 skilled nursing care for residents with complex, ongoing medical needs. Staffed by RNs, LPNs, and CNAs. Inspected and star-rated annually by CMS. Accepts Medicare (short-term rehab) and Medicaid (long-term care).

AL

Assisted Living A licensed, long-term care setting for seniors or individuals with disabilities who need help with daily activities — like bathing, dressing, and medication management — but not 24-hour skilled nursing. Offers housing, meals, and around-the-clock support while aiming to maximize resident independence.

IL

Independent Living Lifestyle-focused communities for older adults offering dining, activities, and transportation with minimal personal care. Best for active, independent seniors who want community without medical support.

Longmont (Coffman Street)92 80.1% +5%3.50 +34%-9%0224.4177A+ 80 Bogie33$11.7M$3.7M31.3%65189
Life Care Center of Longmont
NH

Nursing Home Licensed facility providing 24/7 skilled nursing care for residents with complex, ongoing medical needs. Staffed by RNs, LPNs, and CNAs. Inspected and star-rated annually by CMS. Accepts Medicare (short-term rehab) and Medicaid (long-term care).

Longmont187 77.3% +1%3.48 +36%-10%0183.61115- 54 Jerusha Siegel$22.3M$10.0M44.6%65282
Accel at Longmont
NH

Nursing Home Licensed facility providing 24/7 skilled nursing care for residents with complex, ongoing medical needs. Staffed by RNs, LPNs, and CNAs. Inspected and star-rated annually by CMS. Accepts Medicare (short-term rehab) and Medicaid (long-term care).

RC

Respite Care Short-term temporary care — days to weeks — to give family caregivers a break. Full care provided during the stay. Often used after hospitalization or to trial a facility before a permanent placement decision.

Longmont116 37.9% -50%1.23 +24%-68%4537.6625- 18 Longmont Tc, LLC$9.1M$3.0M33.5%65429

Guides for Better Senior Living

Care Cost Calculator: See Prices in Your Area

Nursing Home Data Explorer

Don’t Wait Too Long: 7 Red Flag Signs Your Parent Needs Assisted Living Now

The True Cost of Assisted Living in 2025 – And How Families Are Paying For It

Understanding Senior Living Costs: Pricing Models, Discounts & Financial Assistance

Frequently Asked Questions about Peaks Care Center

What neighborhood is Peaks Care Center in?

Peaks Care Center is in the Coffman Street neighborhood of Longmont.

Who is the owner of Peaks Care Center?

The legal owner and operator of Peaks Care Center is Heights Healthcare Company, Llc.

Is Peaks Care Center in a walkable area?

Peaks Care Center has a walk score of 80. Very walkable. Most errands can be accomplished on foot, and many essentials are within a short walk.

What is the occupancy rate at Peaks Care Center?

Peaks Care Center's occupancy is 80%.

Who is the administrator of Peaks Care Center?

Julian Hazlett is the administrator of Peaks Care Center.

How many beds does Peaks Care Center have?

Peaks Care Center has 92 beds.

Are there photos of Peaks Care Center?

Yes — there are 6 photos of Peaks Care Center in the photo gallery on this page.

Explore Open Rooms
1 Contact details
2 What type of senior care service are you looking for?
3 What budget do you have in mind for senior care?
4 How soon do you need to find care?
5 Additional details

Thank you for your interest!

Our team will be in touch shortly to help with next steps.