ADDOLORATA VILLA (Assisted Lvg)
Nursing Home, Assisted Living, Independent Living, Memory Care & Nursing Care · Wheeling, IL
CMS overall rating Info CMS (the Centers for Medicare & Medicaid Services) is the federal agency that rates nursing home quality. Its Overall Rating runs from 1 to 5 stars, combining health inspections, staffing, and quality measures, with inspections weighted most heavily.

ADDOLORATA VILLA (Assisted Lvg)

Nursing Home, Assisted Living, Independent Living, Memory Care & Nursing Care · Wheeling, IL
CMS overall rating Info CMS (the Centers for Medicare & Medicaid Services) is the federal agency that rates nursing home quality. Its Overall Rating runs from 1 to 5 stars, combining health inspections, staffing, and quality measures, with inspections weighted most heavily.
Calculator: See prices in your area
ADDOLORATA VILLA (Assisted Lvg) accepts Medicare, Medicaid, and private pay.

Overview of Addolorata Villa (assisted Lvg)

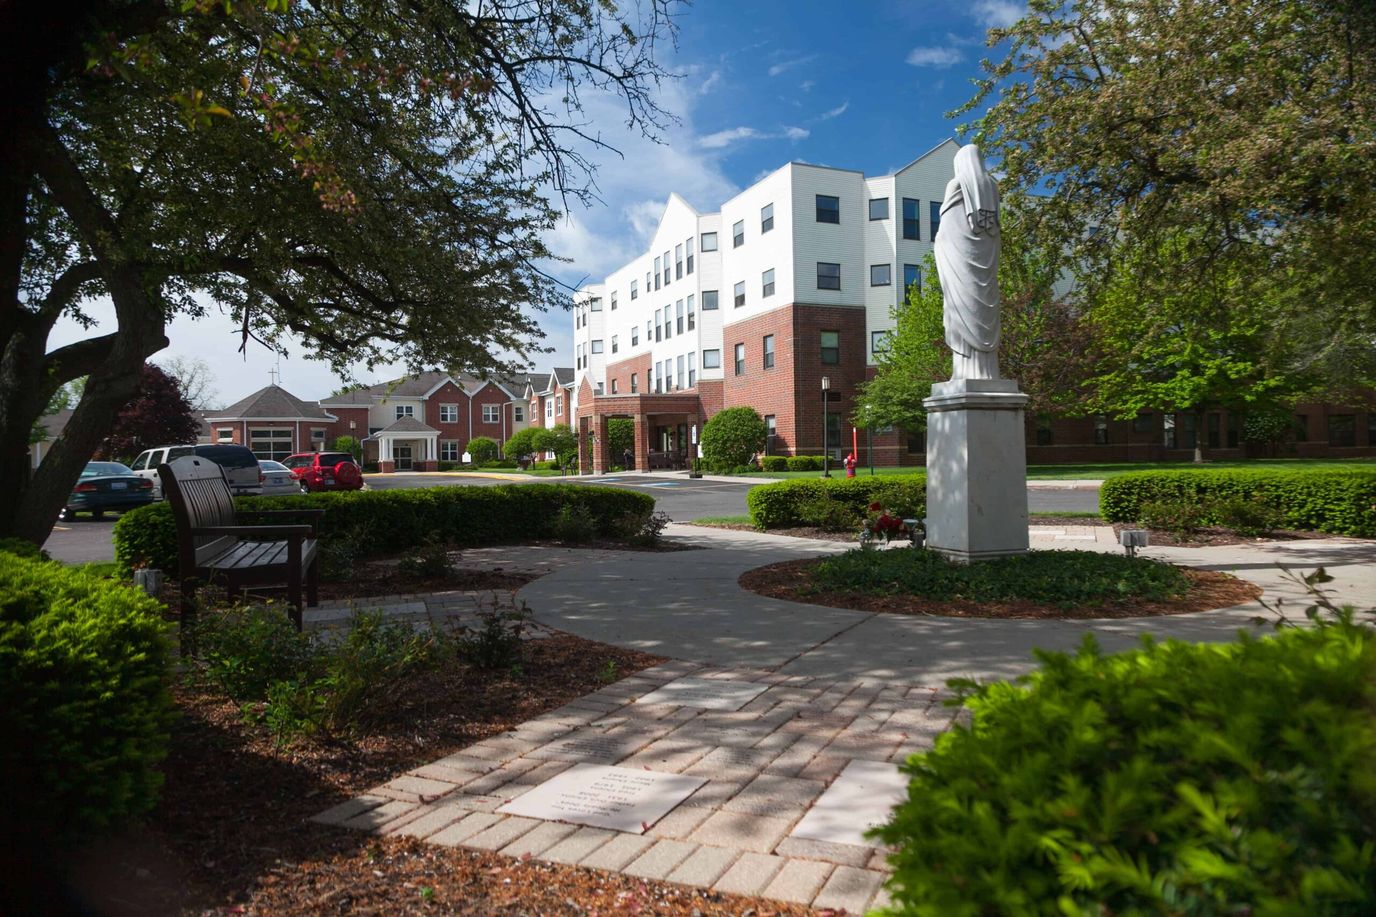
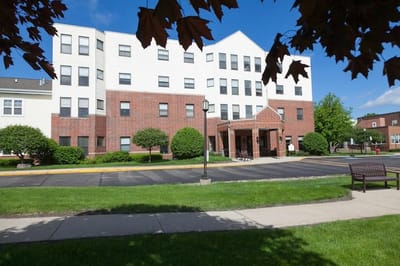
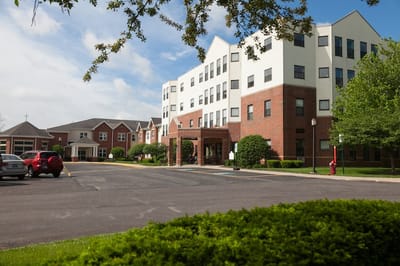
Addolorata Villa is a 61-bed nonprofit continuing care retirement community (CCRC) at 553 McHenry Road in Wheeling, Illinois. Operated by Franciscan Communities, Inc., the 17-acre campus provides a full continuum of care, including independent living, assisted living, memory care, and 24-hour skilled nursing. The community is rooted in a faith-based mission and accepts Medicare, Medicaid, and private pay.

The campus operates as a hospital-affiliated governmental entity, providing high-acuity medical oversight and localized care coordination. CMS currently awards the skilled nursing component a 5-star overall rating as of 2026, reflecting performance significantly above state averages in staffing and clinical quality measures. While the community maintains a citations-per-inspection rate of zero based on its most recent complaint investigations, the historical record for the nursing center includes $156,000 in civil money penalties over the past three years, primarily related to abuse reporting and pharmacy services. Current occupancy for the nursing unit is approximately 61.7%.

Direct bedside support is exceptionally robust, with total nursing hours reaching 5 hours and 14 minutes per resident per day, 33% above the Illinois average. The clinical model is a primary strength, featuring core nursing roles that are 100% staffed by employees rather than contractors. Quality outcomes are notable as the facility reports a zero rate for urinary tract infections among long-stay residents and falls with major injury, 61% better than state norms. Additionally, pressure ulcer prevention is 53% better than the Illinois average, and antipsychotic medication use is 44% lower than average. The community also maintains a 100% vaccination rate for both influenza and pneumococcal vaccines among long-stay residents.

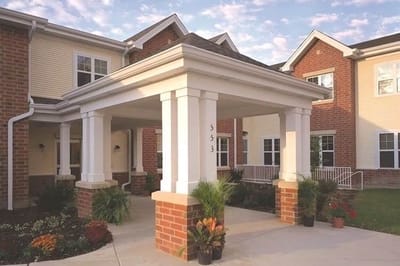
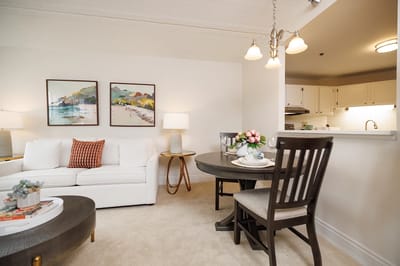
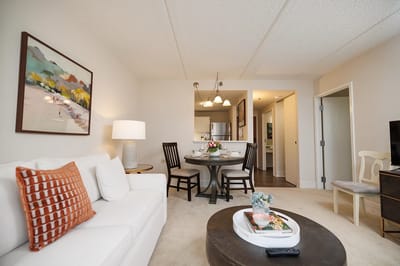
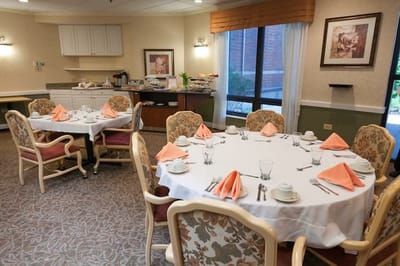
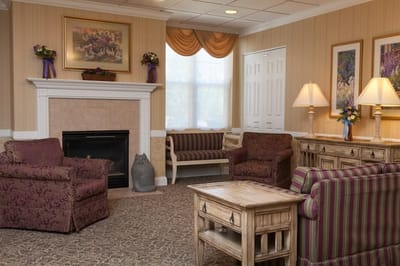
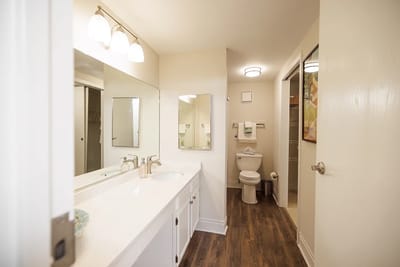
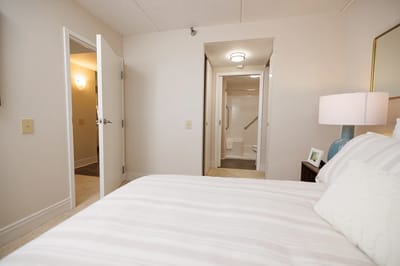
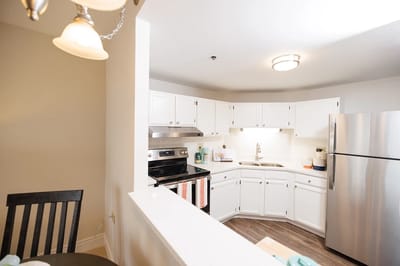
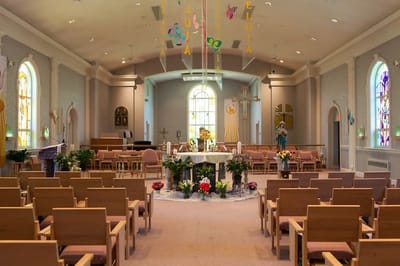
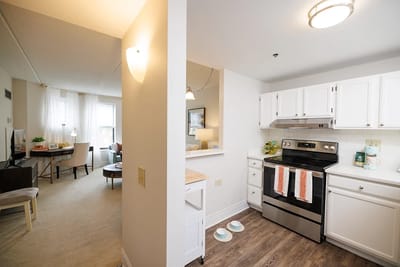
The facility features private apartments and garden homes equipped with kitchenettes, fireplaces, and emergency call systems. All-inclusive monthly services cover chef-prepared meals in a restaurant-style dining room or casual bistro, alongside housekeeping and scheduled transportation. Shared community spaces include a wellness center, an indoor swimming pool, a library, and an on-site chapel supporting its Franciscan identity. The social calendar is managed by on-site staff to provide cognitive engagement, fitness programming, and live entertainment. The facility holds a Walk Score of 36, ensuring residents remain connected to the nearby Wheeling city center for errands and social outings.

Those seeking a well-staffed environment with a mission-driven nonprofit operator and exceptional clinical outcomes may find this setting appropriate. Prospective residents and their representatives should discuss current abuse prevention protocols and the specific corrective actions taken to address past CMS penalty patterns with the administrator to assess 2026 performance firsthand.

Quality ratings

Measured by Centers for Medicare & Medicaid Services (CMS)

Overall rating Info The Overall CMS Rating combines results from health inspections, staffing levels and quality measures. Health inspections carry the most weight. Staffing and quality scores can increase or decrease the final rating based on performance compared to state and national standards.
Health Inspection Info Based on the results of the facility's three most recent standard inspections and any complaint investigations. CMS reviews the number, scope, and severity of deficiencies, with more recent findings weighted more heavily.
Staffing Info Measures average nursing staff hours per resident per day, including Registered Nurses (RNs) and total nursing staff. Ratings are adjusted based on the level of care residents require and are compared to state and national benchmarks.
Quality Measures Info Based on clinical and physical health indicators reported to CMS, such as hospital readmissions, falls, pressure ulcers, and improvements in mobility. These measures reflect how well residents' health needs are being managed.

Staffing hours breakdown

Info Daily nursing hours per resident by staff type, reported to CMS. Higher is generally better — compare this facility to state and national averages to see where staffing stands.

Hours per resident per day — compared to state averages

Total nursing care / resident Info Total adjusted nursing hours per resident per day, combining RN, LPN, and aide time. CMS adjusts this for case-mix so facilities can be fairly compared.
5h 14m per day
Rank #15 / 172Nurse hours — State benchmarkedThis home is ranked 15th out of 172 homes in Illinois. Shows adjusted nurse hours per resident per day benchmarked to the Illinois average, with a ranking across 172 Illinois facilities. More hours mean more direct care. The national average is about 3.5 hrs; below 3.0 is a red flag.Rankings are based only on facilities in Illinois that report data for that category. Facilities without available data are excluded from the ranking.Click the rank badge to see the full State ranking.Click here to see the full State ranking.
vs avg
Staff typeHours / Day / Residentvs state avg
Registered Nurse (RN) Info RNs hold the highest nursing license and can assess residents, interpret test results, and direct care plans. More RN hours per day often signals stronger clinical oversight and faster response to health changes. 1h 30m per day
LPN / LVN Info Licensed Practical Nurses (LPNs) or Licensed Vocational Nurses (LVNs) deliver routine hands-on care — medication administration, wound dressing, and monitoring vital signs. They work under RN supervision and make up a large share of daily bedside care. 25m per day
Nurse Aide Info Certified Nurse Aides (CNAs) provide the most direct day-to-day assistance: bathing, dressing, feeding, and mobility. Nurse aide hours are typically the largest staffing category and directly affect residents' quality of life. 3h 5m per day
Weekend Total Nursing Info Combined nursing hours (RN + LPN + Nurse Aide) per resident per day on weekends. Staffing often drops on weekends — this figure reveals whether the facility maintains adequate coverage outside of weekday hours. 4h 34m per day
Physical Therapist Info Hours per resident per day provided by licensed Physical Therapists (PTs) or PT Assistants. PT services help residents recover mobility after injury or illness and are especially important for post-acute (short-stay) rehabilitation. 2m per day
Weekend RN Info Registered nurse hours specifically on weekends. Facilities sometimes reduce RN presence on Saturdays and Sundays — a low weekend RN figure compared to weekday hours can indicate reduced clinical oversight when most administrative staff are absent. 1h 12m per day

Capacity and availability

Avg. Length of Stay
167 days
Bed community size
61-bed community Rank #250 / 426Bed count — State benchmarkedThis home is ranked 250th out of 426 homes in Illinois. Shows this facility's certified or reported bed count compared to other Illinois facilities. Larger communities may offer more amenities, programs, and on-site services for residents and families.Rankings are based only on facilities in Illinois that report data for that category. Facilities without available data are excluded from the ranking.Click the rank badge to see the full State ranking.Click here to see the full State ranking.
A moderately sized community that may balance personal attention with shared amenities and social activities.
Walk Score
Walk Score: 36 / 100 Rank #448 / 648Walk Score — State benchmarkedThis home is ranked 448th out of 648 homes in Illinois. Shows how walkable this facility's neighborhood is compared to the average Walk Score across Illinois facilities. Higher scores benefit residents, families, and staff.Rankings are based only on facilities in Illinois that report data for that category. Facilities without available data are excluded from the ranking.Click the rank badge to see the full State ranking.Click here to see the full State ranking.
Somewhat walkable. A few nearby services may be reachable on foot, but most trips require transportation.

About this community

Occupancy

Occupancy rate
62%
Rank #151 / 204Occupancy rate — State benchmarkedThis home is ranked 151st out of 204 homes in Illinois. Shows this facility's occupancy rate versus the Illinois average, with its Statewide rank out of 204. Higher occupancy signals strong local demand and financial stability.Rankings are based only on facilities in Illinois that report data for that category. Facilities without available data are excluded from the ranking.Click the rank badge to see the full State ranking.Click here to see the full State ranking.
Lower than the Illinois average: 69.3%
Occupied beds
38 / 61
Average occupied beds in Illinois homes 93 beds

License Details

Facility TypeAssisted Living/shared Housing Establishment
StatusActive
IssuanceJanuary 29, 2026
ExpirationJanuary 28, 2027
CountyCook
License Number5100562

Ownership & Operating Entity

Owner NameFranciscan Communities, Inc

Therapy & Rehabilitation

2 services
Rehabilitation Services
Respite Care

Contact Information

Amenities & Lifestyle

ActivitiesActivities designed to enrich overall quality of life, focusing on social, physical, intellectual, and spiritual wellness
Specific ProgramsFranciscan Care Solutions

Contact ADDOLORATA VILLA (Assisted Lvg)

Inspection History

In Illinois, the Department of Public Health, Office of Health Care Regulation conducts annual unannounced surveys to assess compliance with state and federal healthcare facility standards.

Since 2013 · 13 years of data 2 deficiencies 4 inspections

Inspection Scorecard Info This scorecard compares key inspection, deficiency, and complaint metrics at this facility against the Illinois state average. Metrics rated ≥15% worse than average are highlighted in red; those ≥15% better are highlighted in green.

Since 2013 vs. Illinois state average
Overall vs. IL average 0 Worse No metrics in this bucket. 4 Better Metrics better than Illinois average:
• Total deficiencies (71% below)
• Deficiencies per year (60% below)
• Deficiencies per inspection (44% below)
• Total inspections (50% below)
Latest Inspection January 15, 2026 Annual Licensure Only Survey Inspection

Deficiencies Info Deficiencies are formal regulatory issues recorded during state inspections.

This FacilityIL Averagevs. IL Avg
Total deficiencies Info Formal regulatory issues recorded by inspectors across all inspection types. 27 This facility has 71% fewer total deficiencies than a typical Illinois assisted living residence (2 vs. IL avg 7).↓ 71% better
Deficiencies per year Info Average deficiencies per year since 2013. 0.20.5 This facility has 60% fewer deficiencies per year than a typical Illinois assisted living residence (0.2 vs. IL avg 0.5).↓ 60% better
Deficiencies per inspection Info Average deficiencies per inspection. 0.50.9 This facility has 44% fewer deficiencies per inspection than a typical Illinois assisted living residence (0.5 vs. IL avg 0.9).↓ 44% better

Inspections Info State inspections evaluate whether the facility meets health and safety standards.

This FacilityIL Averagevs. IL Avg
Total inspections Info Combined count of all routine and focused inspections. Excludes complaint investigations. 48 This facility has 50% fewer total inspections than a typical Illinois assisted living residence (4 vs. IL avg 8).↓ 50% better

Inspection Reports Summary Info An editor-reviewed summary of the themes and findings across this facility's recent inspection reports.

  • January 7, 2025 inspection found one deficiency for emotional/mental abuse of a resident by a staff member, resulting in that employee’s suspension and termination.
  • The facility violated Resident Rights under Section 295.6000 by depriving a resident of the right to be free from abuse, with no fine imposed despite the gravity.
  • No other deficiencies or complaints were noted in the January 7, 2025 annual survey beyond the single abuse-related citation.

Health Inspection History

Inspections since 2023
Total health inspections 7

State average N/A


Last Health inspection on Aug 2025

Total health citations
22 Rank #51 / 172Health citations — State benchmarkedThis home is ranked 51st out of 172 homes in Illinois. Shows this facility's total health deficiency citations benchmarked to the Illinois State average, with a ranking across all 172 IL facilities. Lower citation counts earn a better rank.Rankings are based only on facilities in Illinois that report data for that category. Facilities without available data are excluded from the ranking.Click the rank badge to see the full State ranking.Click here to see the full State ranking.

State average N/A

Citations per inspection
3.14 Rank #58 / 172Citations per inspection — State benchmarkedThis home is ranked 58th out of 172 homes in Illinois. Shows average deficiency citations per CMS inspection for this facility versus the Illinois mean across 172 facilities with citation data. Lower is better.Rankings are based only on facilities in Illinois that report data for that category. Facilities without available data are excluded from the ranking.Click the rank badge to see the full State ranking.Click here to see the full State ranking.

State average N/A


Health citations are formal notices following inspections when they fail to comply with safety and care standards.

14 of 22 citations resulted from standard inspections; 5 of 22 resulted from complaint investigations; and 3 of 22 came from combined inspections (standard and complaint).

Breakdown of citation severity (last 3 years)
Critical health citations
0
In line with State average

State average: N/A


Serious health citations
6
In line with State average

State average: N/A

0 critical citations State average: N/A

6 serious citations State average: N/A

16 moderate citations State average: N/A

0 minor citations State average: N/A
Citations history (last 3 years)
Abuse/Neglect moderate citation Aug 14, 2025
Corrected

Abuse/Neglect moderate citation Aug 14, 2025
Corrected

Nutrition moderate citation Jan 16, 2025
Corrected

Quality of Care serious citation Jan 16, 2025
Corrected

Staffing Data

Reporting period: October 1 – December 31, 2025 (Q4 2025). Source: CMS Payroll-Based Journal report.

Total staff 128
Employees 107
Contractors 21
Staff to resident ratio 1.71 : 1
0% compared with State average

State average ratio: 0 : 0

Avg staff/day 53
Average shift 7.8 hours
0% compared with State average

State average: 0 hours

Total staff hours (quarter) 38,204

Nursing staff breakdown

Q4 2025 · Oct 1 – Dec 31 More info This data comes from the CMS Payroll-Based Journal report covering October 1 – December 31, 2025.
Registered Nurse

Manages medical care and health needs.

RN Staff Info All 27 RN Staff are full-time employees. No contractors work on this role. 27
Average shift length Info Average shift length. Calculated as total hours divided by days worked and average staff per day. 8.5 hours
Licensed Practical Nurse

Assists with medical care and medications.

LPN Staff Info All 9 LPN Staff are full-time employees. No contractors work on this role. 9
Average shift length Info Average shift length. Calculated as total hours divided by days worked and average staff per day. 8 hours
Certified Nursing Assistant

Helps with daily care and mobility.

CNA Staff Info All 53 CNA Staff are full-time employees. No contractors work on this role. 53
Average shift length Info Average shift length. Calculated as total hours divided by days worked and average staff per day. 8 hours

Contractor staffing

Q4 2025 · Oct 1 – Dec 31 More info This data comes from the CMS Payroll-Based Journal report covering October 1 – December 31, 2025.

Total hours from contractors

6.1%

2,344 contractor hours this quarter

Speech Language Pathologist: 5 Physical Therapy Assistant: 5 Physical Therapy Aide: 4 Respiratory Therapy Technician: 2 Qualified Social Worker: 2 Medical Director: 1 Occupational Therapy Aide: 1 Occupational Therapy Assistant: 1

Staff by category

Q4 2025 · Oct 1 – Dec 31 More info This data comes from the CMS Payroll-Based Journal report covering October 1 – December 31, 2025.
Certified Nursing Assistant5305319,37192100%8
Registered Nurse270277,20092100%8.5
Other Dietary Services Staff8082,64892100%7.3
Licensed Practical Nurse9092,1279199%8
Clinical Nurse Specialist4041,7177582%7.2
Administrator2028806368%8
Occupational Therapy Aide0115126470%8
RN Director of Nursing1015025964%8.5
Nurse Practitioner1014966267%8
Mental Health Service Worker1014806065%8
Dietitian1014405560%8
Physical Therapy Aide0444336267%6.8
Physical Therapy Assistant0554216571%6.3
Speech Language Pathologist0553926773%5.4
Qualified Social Worker0223406368%5.3
Respiratory Therapy Technician0221885661%3.4
Occupational Therapy Assistant011353740%0.9
Medical Director011242426%1
53 Certified Nursing Assistant
% of Days 100%
27 Registered Nurse
% of Days 100%
8 Other Dietary Services Staff
% of Days 100%
9 Licensed Practical Nurse
% of Days 99%
4 Clinical Nurse Specialist
% of Days 82%
2 Administrator
% of Days 68%
1 Occupational Therapy Aide
% of Days 70%
1 RN Director of Nursing
% of Days 64%
1 Nurse Practitioner
% of Days 67%
1 Mental Health Service Worker
% of Days 65%
1 Dietitian
% of Days 60%
4 Physical Therapy Aide
% of Days 67%
5 Physical Therapy Assistant
% of Days 71%
5 Speech Language Pathologist
% of Days 73%
2 Qualified Social Worker
% of Days 68%
2 Respiratory Therapy Technician
% of Days 61%
1 Occupational Therapy Assistant
% of Days 40%
1 Medical Director
% of Days 26%

Penalties and fines

Includes penalties issued in 2023-2025

Federal penalties imposed by CMS for regulatory violations, including civil money penalties (fines) and denials of payment for new Medicare/Medicaid admissions.

Source: CMS Penalties Database (Data as of Jan 2026)

Total fines amount $156K Rank #134 / 173Federal fines — State benchmarkedThis home is ranked 134th out of 173 homes in Illinois. Shows this facility's cumulative CMS federal fine dollars versus the Illinois average among facilities with fines, and where it ranks among 173 facilities in the pool. Lower total dollars mean a better rank.Rankings are based only on facilities in Illinois that report data for that category. Facilities without available data are excluded from the ranking.Click the rank badge to see the full State ranking.Click here to see the full State ranking.
9% higher than State average

State average: $143K

Number of fines 5
69% more fines than State average

State average: 3.0

Payment Denials Info Serious action where Medicare and/or Medicaid temporarily stops payments for new residents until issues are fixed. 0
100% fewer payment denials than State average

State average: 1.1

Fines amount comparison
This facility $156K
State average $143K
Penalty History

Penalties are imposed by CMS for violations of federal nursing home regulations.

4 penalties in the past 3 years

Multiple penalties were reported in the last 3 years.

Civil Money Penalty Info Fines imposed for noncompliance, which can be assessed per day or per instance of violation. Jan 16, 2025
$41K
Civil Money Penalty Info Fines imposed for noncompliance, which can be assessed per day or per instance of violation. Mar 27, 2024
$64K
Civil Money Penalty Info Fines imposed for noncompliance, which can be assessed per day or per instance of violation. Feb 8, 2024
$27K
Civil Money Penalty Info Fines imposed for noncompliance, which can be assessed per day or per instance of violation. Aug 25, 2023
$11K

Last updated: Jan 2026

Quality of care over time

These measures show how residents usually do over time at this home, based on health outcomes and preventive care.

High-risk clinical events score Info A composite score based on pressure ulcers, falls with injury, weight loss, walking ability decline, and activities of daily living decline. 6.9
28% better than State average

State average: 9.7

Functional decline score Info A composite score based on activities of daily living decline, walking ability decline, and incontinence. 12.7
32% better than State average

State average: 18.6

Long-stay resident measures
Need for Help with Daily Activities Increased Info Percent of long-stay residents whose need for help with daily activities has increased 6.8%
56% better than State average

State average: 15.5%

Walking Ability Worsened Info Percent of long-stay residents whose ability to move independently worsened 15.6%
15% better than State average

State average: 18.4%

Low Risk Residents with Bowel/Bladder Incontinence Info Percent of low risk long-stay residents who lose control of their bowels or bladder 15.8%
27% better than State average

State average: 21.6%

Falls with Major Injury Info Percent of long-stay residents experiencing one or more falls with major injury 1.3%
61% better than State average

State average: 3.4%

High Risk Residents with Pressure Ulcers Info Percent of long-stay high risk residents with pressure ulcers 2.5%
53% better than State average

State average: 5.3%

Urinary Tract Infection Info Percent of long-stay residents with a urinary tract infection 0.4%
76% better than State average

State average: 1.8%

Lost Too Much Weight Info Percent of long-stay residents who lose too much weight 8.5%
30% worse than State average

State average: 6.5%

Depressive Symptoms Info Percent of long-stay residents who have depressive symptoms 15.4%
68% better than State average

State average: 48.1%

Antipsychotic Use Info Percent of long-stay residents who received an antipsychotic medication 11.4%
44% better than State average

State average: 20.2%

Pneumococcal Vaccine Info Percent of long-stay residents assessed and appropriately given the pneumococcal vaccine 100.0%
12% better than State average

State average: 89.2%

Influenza Vaccine Info Percent of long-stay residents assessed and appropriately given the seasonal influenza vaccine 100.0%
9% better than State average

State average: 91.6%

Short-stay resident measures
Pneumococcal Vaccine Info Percent of short-stay residents assessed and appropriately given the pneumococcal vaccine 95.1%
39% better than State average

State average: 68.3%

Antipsychotic medication increase Info Percent of short-stay residents who newly received an antipsychotic medication 0.0%
100% better than State average

State average: 2.3%

Influenza Vaccine Info Percent of short-stay residents assessed and appropriately given the seasonal influenza vaccine 96.5%
53% better than State average

State average: 63.0%

Breakdown by payment type

Medicare

60% of new residents, usually for short-term rehab.

Typical stay 1 - 2 months

Private pay

31% of new residents, often for short stays.

Typical stay 11 - 12 months

Medicaid

9% of new residents, often for long-term daily care.

Typical stay 2 - 3 years

Facility Characteristics

Source: CMS Long-Term Care Facility Characteristics (Data as of Jan 2026)

Total residents 75
Medicare
7
9.3% of residents
Medicaid
35
46.7% of residents
Private pay or other
33
44% of residents
Programs & Services
Residents Group

Residents meet regularly to discuss policies, care quality, and activities

CCRC

Part of a Continuing Care Retirement Community offering multiple care levels

Active Resident Council

Organized group of residents that meets regularly to discuss facility policies, quality of life, and activities.

Finances and operations

Based on CMS SNF Cost Report for fiscal year ending in 06/2024.

For-profit
Corporation
Net patient revenue Info Net patient revenue — what the home actually collects for resident care, after contractual allowances, bad debt and discounts are subtracted from its gross charges (CMS cost report, Worksheet G-3). It covers resident care only; money the home earns from other sources is shown separately as "Other income."
$22.9M
Net patient income Info Net patient income: net patient revenue minus the home's total operating expenses. A positive figure means it earns more from resident care than it spends to deliver it; a negative figure means the opposite. It excludes non-operating "other income."
-$179.8K
For-profit Corporation
Net patient revenue Info Net patient revenue — what the home actually collects for resident care, after contractual allowances, bad debt and discounts are subtracted from its gross charges (CMS cost report, Worksheet G-3). It covers resident care only; money the home earns from other sources is shown separately as "Other income."
$22.9M Rank #9 / 171Revenue — State benchmarkedThis home is ranked 9th out of 171 homes in Illinois. Shows this facility's annual revenue compared to the Illinois average. Higher revenue generally means more resources for staffing and capital — read alongside Payroll %.Rankings are based only on facilities in Illinois that report data for that category. Facilities without available data are excluded from the ranking.Click the rank badge to see the full State ranking.Click here to see the full State ranking.
Net patient income Info Net patient income: net patient revenue minus the home's total operating expenses. A positive figure means it earns more from resident care than it spends to deliver it; a negative figure means the opposite. It excludes non-operating "other income."
-$179.8K
Other income Info Money the home earns outside of resident care — such as investments, grants, rentals and other non-operating sources (CMS cost report, Worksheet G-3). It is tracked separately from net patient revenue: it is not part of that figure, and it is not included in net patient income.
$139.7K
Payroll costs Info Staff salaries plus wage-related costs — benefits such as payroll taxes, health insurance and retirement — from the home's own accounting records (CMS cost report, Worksheet A). Contract or agency labor is counted separately, under other operating costs. Rank #38 / 171Payroll — State benchmarkedThis home is ranked 38th out of 171 homes in Illinois. Shows total annual staff payroll benchmarked to the Illinois average. Higher payroll investment relative to peers often signals better staffing and less reliance on cheaper contract labor.Rankings are based only on facilities in Illinois that report data for that category. Facilities without available data are excluded from the ranking.Click the rank badge to see the full State ranking.Click here to see the full State ranking.
$10.2M 44.4% of net patient revenue Info Payroll as a share of revenue: staff salaries and wage-related benefits divided by net patient revenue. A higher figure means more of each revenue dollar goes to staff pay. Rank #166 / 171Payroll % — State benchmarkedThis home is ranked 166th out of 171 homes in Illinois. Shows payroll as a percentage of revenue versus the Illinois average. Well-run Illinois facilities typically land around 54–67% — the top third Statewide. Below 25% may signal understaffing or heavy agency use — read with Staffing ratings.Rankings are based only on facilities in Illinois that report data for that category. Facilities without available data are excluded from the ranking.Click the rank badge to see the full State ranking.Click here to see the full State ranking.
Other operating costs Info Everything it costs to run the home apart from payroll — food, utilities, supplies, maintenance, contract labor and administration. Calculated as total operating expense minus payroll (staff salaries and wage-related benefits).
$12.9M
Total costs Info The home's total operating expense for the year — all the costs of running it, salaries included (CMS cost report, Worksheet G-3).
$23.1M

Who this home usually serves

TYPE OF STAY

Mostly short-term rehab stays

Most residents typically stay for a few weeks or months before returning home or moving on.

Most new residents arrive under Medicare (60% of admissions), and a typical Medicare stay runs around 1 - 2 months.

Admissions
155 total

Coverage residents most often arrive under.

Medicare 60%
Private pay 31%
Medicaid 9%
Discharges
252 total

Coverage residents most often leave under.

Medicare 58%
Private pay 37%
Medicaid 4%

Places of interest near ADDOLORATA VILLA (Assisted Lvg)

Address 0.7 miles from city center Info Estimated distance in miles from Wheeling's city center to ADDOLORATA VILLA (Assisted Lvg)'s address, calculated via Google Maps.

Calculate Travel Distance to ADDOLORATA VILLA (Assisted Lvg)

Add your location

Address

Compare Nursing Homes around the area

The information below is reported by the Illinois Department of Public Health, Office of Health Care Regulation.

ADDOLORATA VILLA (Assisted Lvg)
NH
AL
IL
MC
NC
Wheeling (Wheeling Township) -61 - 36 -
GreenFields of Geneva
NH
AL
IL
MC
Geneva -77 A+ 6 Studio / 1 Bed / 2 Bed
Vi at The Glen
NH
AL
IL
MC
Glenview -36 A+ 52 1 Bed / 2 Bed / Villa
Avantara Elgin
NH
AL
Elgin (Country Knolls) -112 A+ 45 -
Franciscan Village of Lemont
NH
AL
IL
MC
NC
Lemont -47 A+ 4 -

Frequently Asked Questions about ADDOLORATA VILLA (Assisted Lvg)

What neighborhood is ADDOLORATA VILLA (Assisted Lvg) in?

ADDOLORATA VILLA (Assisted Lvg) is in the Wheeling Township neighborhood of Wheeling.

Who is the owner of ADDOLORATA VILLA (Assisted Lvg)?

ADDOLORATA VILLA (Assisted Lvg) is legally operated by Franciscan Communities, Inc..

Is ADDOLORATA VILLA (Assisted Lvg) in a walkable area?

ADDOLORATA VILLA (Assisted Lvg) has a walk score of 36. Somewhat walkable. A few nearby services may be reachable on foot, but most trips require transportation.

What is the license number of ADDOLORATA VILLA (Assisted Lvg)?

According to IL state health department records, ADDOLORATA VILLA (Assisted Lvg)'s license number is 5100562.

When does ADDOLORATA VILLA (Assisted Lvg)'s license expire?

According to IL state health department records, ADDOLORATA VILLA (Assisted Lvg)'s license expires on January 28, 2027.

What is the occupancy rate at ADDOLORATA VILLA (Assisted Lvg)?

ADDOLORATA VILLA (Assisted Lvg)'s occupancy is 62%.

What is the best email address for ADDOLORATA VILLA (Assisted Lvg)?

The team at ADDOLORATA VILLA (Assisted Lvg) can be reached at npronek@franciscancommunities.org.

Guides for Better Senior Living

Care Cost Calculator: See Prices in Your Area

Nursing Home Data Explorer

Don’t Wait Too Long: 7 Red Flag Signs Your Parent Needs Assisted Living Now

The True Cost of Assisted Living in 2025 – And How Families Are Paying For It

Understanding Senior Living Costs: Pricing Models, Discounts & Financial Assistance