Alden Des Plaines Rehabilitation & Health Care Center
Nursing Home · Mount Prospect, IL
CMS overall rating Info The Overall CMS Rating is scored from 1 to 5 stars and combines results from health inspections, staffing levels, and quality measures. Health inspections carry the most weight. Staffing and quality scores can increase or decrease the final rating based on performance compared to state and national standards.

Alden Des Plaines Rehabilitation & Health Care Center

Nursing Home · Mount Prospect, IL
CMS overall rating Info The Overall CMS Rating is scored from 1 to 5 stars and combines results from health inspections, staffing levels, and quality measures. Health inspections carry the most weight. Staffing and quality scores can increase or decrease the final rating based on performance compared to state and national standards.
Calculator: See prices in your area
Alden Des Plaines Rehabilitation & Health Care Center accepts Medicare, Medicaid, and private pay.

Overview of Alden Des Plaines Rehabilitation & Health Care Center

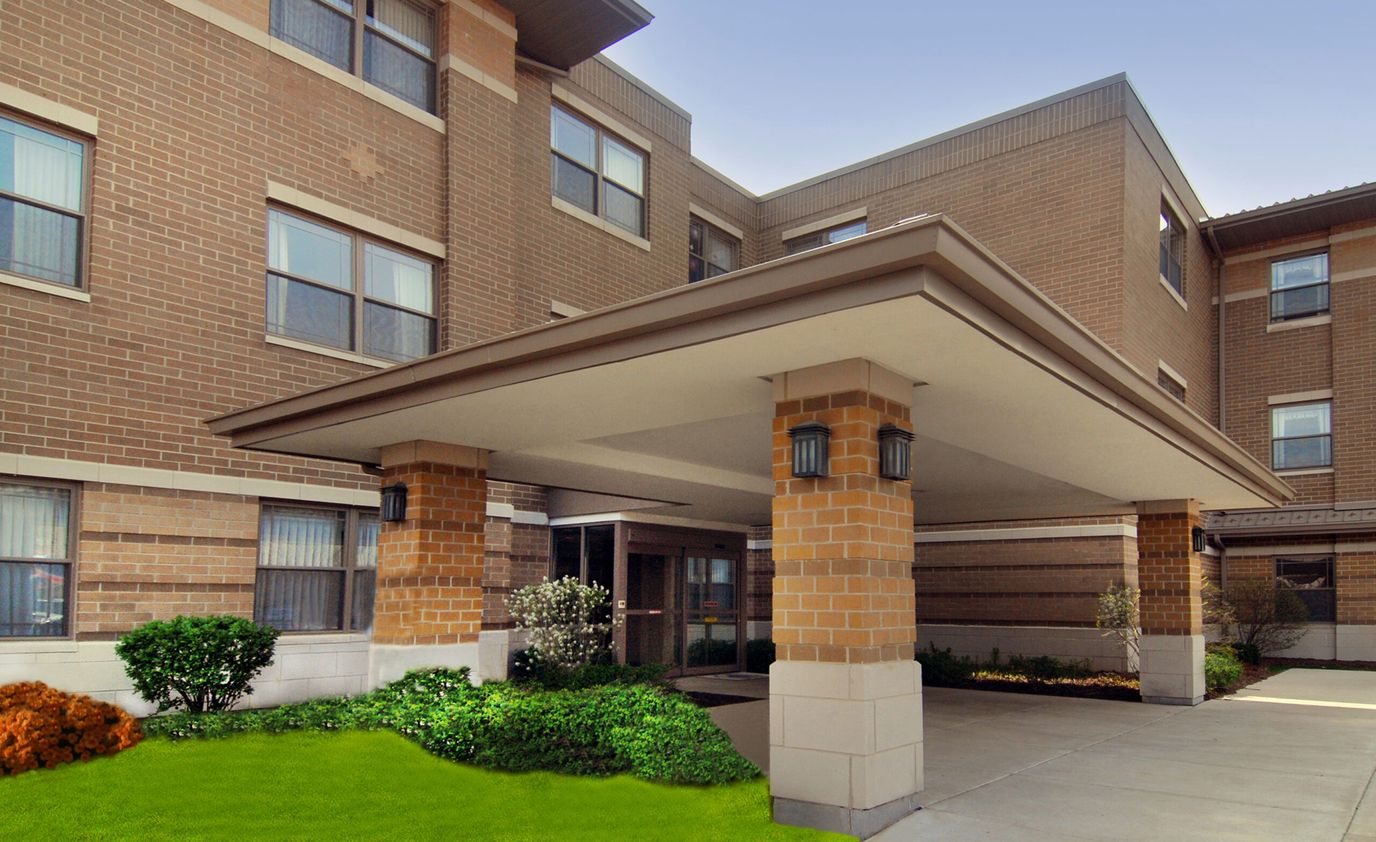
Alden Des Plaines Rehabilitation & Healthcare is a nursing home in Des Plaines, IL, specializing in rehabilitation. Featuring upscale amenities in a clean and supportive setting, the community ensures older adults can feel at ease throughout their stay. Restaurant-style dining, a comprehensive therapy program, and recreational opportunities also ensure residents can focus on their recovery and rehabilitation. Through a holistic approach to care, the community ensures residents receive the utmost attention to live comfortably in retirement.

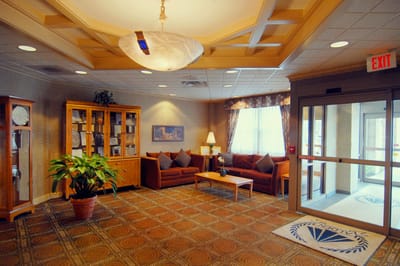
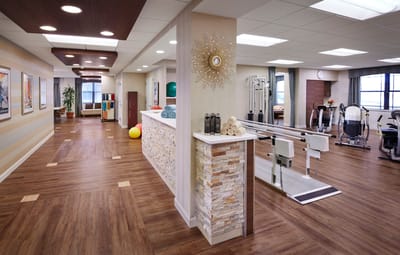
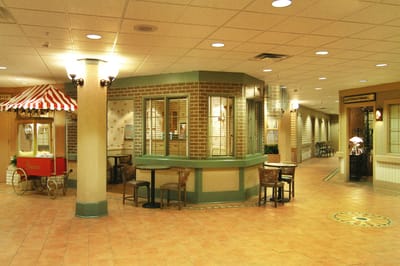
Beauty services, social events, and exercises encourage residents to live actively and have fun. A state-of-the-art therapy room, a lively dining room, and spacious common areas are among the top-notch amenities dedicated to residents’ relaxation and wellness. Residents also have quick access to medical care and other necessities, with the Holy Family Medical Center and various local amenities in the area. As one of the trusted options for senior living in Illinois, this nursing home continuously provides excellent services for older adults’ welfare.

(847) 768-1300

Quality ratings

Measured by Centers for Medicare & Medicaid Services (CMS)

Overall rating Info The Overall CMS Rating combines results from health inspections, staffing levels and quality measures. Health inspections carry the most weight. Staffing and quality scores can increase or decrease the final rating based on performance compared to state and national standards.
▲ 58.7% Above IL avg.
Health Inspection Info Based on the results of the facility's three most recent standard inspections and any complaint investigations. CMS reviews the number, scope, and severity of deficiencies, with more recent findings weighted more heavily.
▲ 44.1% Above IL avg.
Staffing Info Measures average nursing staff hours per resident per day, including Registered Nurses (RNs) and total nursing staff. Ratings are adjusted based on the level of care residents require and are compared to state and national benchmarks.
▼ 53.2% Below IL avg.
Quality Measures Info Based on clinical and physical health indicators reported to CMS, such as hospital readmissions, falls, pressure ulcers, and improvements in mobility. These measures reflect how well residents' health needs are being managed.
▲ 77.6% Above IL avg.

Staffing hours breakdown

Info Daily nursing hours per resident by staff type, reported to CMS. Higher is generally better — compare this facility to state and national averages to see where staffing stands.

Hours per resident per day — compared to Illinois state averages

Total nursing care / resident Info Total adjusted nursing hours per resident per day, combining RN, LPN, and aide time. CMS adjusts this for case-mix so facilities can be fairly compared.
3h 2m per day
This facility Illinois avg (3h 6m per day)
vs Illinois avg
-2%
Staff typeHours / dayvs state avg
Total Nursing (Weekend) Info Combined nursing hours (RN + LPN + Nurse Aide) per resident per day on weekends. Staffing often drops on weekends — this figure reveals whether the facility maintains adequate coverage outside of weekday hours. 3h 22m per day

Capacity and availability

This home usually has availability

Occupancy lower than 85% suggests more openings may be available.

Lower occupancy than the Illinois average: 69.3%
Occupancy rate 61.9%
Avg. Length of Stay 42 days
Occupancy rate
61.9%
Avg. Length of Stay
42 days

Who this home usually serves

TYPE OF STAY

Mix of rehab and long-term care

This home supports both short-term rehab and long-term care, with residents staying for a wide range of durations.

Breakdown by payment type

Medicare

25% of new residents, usually for short-term rehab.

Typical stay 1 - 2 months

Private pay

42% of new residents, often for short stays.

Typical stay 28 days

Medicaid

33% of new residents, often for long-term daily care.

Typical stay 2 - 3 months

Finances and operations

Privately-owned community
Operated by a business corporation.
Home revenue
$11.6M
Operating loss
-$3.4M
Privately-owned community Operated by a business corporation.
Home revenue
$11.6M
Operating loss
-$3.4M
Payroll costs Info The portion of the home's budget spent on staff, including nurses, caregivers, and other employees who support care and operations.
$7.3M
63.1% of revenue
Other operating costs Info All remaining costs needed to run the home, such as food, utilities, building maintenance, supplies and administrative expenses.
$7.7M
Total costs $15.0M
Walk Score
Walk Score: 42 / 100
Somewhat walkable. A few nearby services may be reachable on foot, but most trips require transportation.

What does this home offer?

Housing options icon

Housing Options: Private/Semi-Private Rooms

Building type icon
Building type icon

Building Type: 3-story

On-site medical care and health services icon

On-site Medical Care and Health Services

Rehabilitative support icon

Rehabilitative Support

Beauty services icon

Beauty Services

Dining services icon

Dining Services

Types of Care at Alden Des Plaines Rehabilitation & Health Care Center

Nursing Home

Contact Alden Des Plaines Rehabilitation & Health Care Center

Health Inspection History

Inspections
Total health inspections 8

Illinois average 10.4


Last Health inspection on Sep 2025

Total health citations
13

Illinois average 36.8

Citations per inspection
1.62

Illinois average 3.68


Health citations are formal notices following inspections when they fail to comply with safety and care standards.

3 of 13 citations resulted from standard inspections; and 10 of 13 resulted from complaint investigations.

Breakdown of citation severity (last 4 years)
Critical Health citations More info
0
100% better than Illinois average

Illinois average: 0.7


Serious Health citations More info 2
44% better than Illinois average

Illinois average: 3.6

0 critical citations More info Illinois average: 0.7

2 serious citations More info Illinois average: 3.6

11 moderate citations More info Illinois average: 32

0 minor citations More info Illinois average: 0.5
Citations history (last 4 years)
Quality of Care moderate citation Info Issues related to how well residents receive appropriate treatment and support for their medical and daily care needs. Sep 16, 2025
Corrected

Quality of Care moderate citation Info Issues related to how well residents receive appropriate treatment and support for their medical and daily care needs. Sep 04, 2025
Corrected

Quality of Care moderate citation Info Issues related to how well residents receive appropriate treatment and support for their medical and daily care needs. May 15, 2025
Corrected

Quality of Care moderate citation Info Issues related to how well residents receive appropriate treatment and support for their medical and daily care needs. May 15, 2025
Corrected

Financial Assistance for
Nursing Home in Illinois

Alden Des Plaines Rehabilitation & Health Care Center is located in Des Plaines, Illinois.
Here are the financial assistance programs available to residents in Illinois.

Get Financial aid guidance

Community Care Program

Illinois CCP

Age 60+
General Illinois resident, at risk of nursing home placement.
Income Limits (2025) ~$1,215/month individual
Asset Limits $17,500 individual, excludes home, car
IL

High demand in urban areas; waitlists possible.

Benefits
In-home care (3-5 hours/day) Adult day services ($65/day) Emergency home response systems ($30/month)

Illinois Respite Program

IL Respite (via NFCSP)

Age Caregiver of someone 60+ (or with dementia)
General Illinois resident.
Income Limits No strict limit; prioritizes low-income.
Asset Limits Not applicable.
IL

Limited slots; urban/rural balance.

Benefits
In-home respite (4-6 hours/day) Adult day care (~$65/day) Short-term facility care (up to 5 days)

Supportive Living Program (SLP)

Illinois Medicaid Supportive Living Program

Age 65+ or 22-64 with disability
General Illinois resident, Medicaid-eligible, needs moderate assistance (not nursing home-level).
Income Limits (2025) ~$2,829/month (300% FBR, individual); QIT allowed.
Asset Limits $2,000 (individual), $3,000 (couple) (excludes home, car).
IL

~200 SLP sites statewide; room/board not covered.

Benefits
Personal care (5-7 hours/day, e.g., bathing, mobility) Meals Housekeeping Medication management Respite (~240 hours/year)

Persons Who Are Elderly Waiver

Illinois Medicaid Elderly Waiver

Age 65+
General Illinois resident, Medicaid-eligible, nursing home-level care need.
Income Limits (2025) ~$2,829/month 300% FBR, individual
Asset Limits $2,000 (individual), $3,000 (couple).
IL

Part of HealthChoice Illinois; consumer-directed options available.

Benefits
Personal care (5-7 hours/day, e.g., dressing, eating) Homemaker Adult day care (~$60/day) Respite (240 hours/year) Home mods ($1,000 avg.)

Medicare Savings Program (MSP)

Illinois Medicare Savings Program

Age 65+ or disabled
General Illinois resident, Medicare Part A/B.
Income Limits (2025) ~$2,510/month (QMB), ~$3,380/month (SLMB), ~$3,598/month (QI)—individual.
Asset Limits $9,430 (individual), $14,130 (couple).
IL

Three tiers; no waitlist.

Benefits
Covers Part B premiums ($174.70/month) Deductibles ($240/year) Copays (~20%)

Optional State Supplementation (OSS)

Illinois Optional State Supplementation

Age 65+ or disabled
General Illinois resident, in approved facility, SSI recipient or low-income.
Income Limits (2025) ~$1,004/month including SSI
Asset Limits $2,000 (individual), $3,000 (couple).
IL

~$50-$500/month based on facility type.

Benefits
Cash (~$50-$500/month) for room/board in personal care homes or SLFs

VA Aid and Attendance (A&A) and Housebound Benefits

Illinois VA Aid and Attendance/Housebound

Age 65+ or disabled veteran/spouse
General Illinois resident, wartime service, need for ADL help (A&A) or homebound.
Income Limits (2025) Net income < ~$1,984/month (veteran with dependent, A&A); pension offsets income.
Asset Limits ~$155,356 net worth limit
IL

High veteran demand in urban/rural areas.

Benefits
Cash (~$1,433-$2,642/month veteran, ~$951-$1,318 spouse) for care costs (e.g., in-home, assisted living)

Places of interest near Alden Des Plaines Rehabilitation & Health Care Center

Address 1.5 miles from city center Info Estimated distance in miles from Des Plaines's city center to Alden Des Plaines Rehabilitation & Health Care Center's address, calculated via Google Maps.

Calculate Travel Distance to Alden Des Plaines Rehabilitation & Health Care Center

Add your location

Address

Staffing Data (Q2 2025)

This data corresponds to Q2 2025 and is based on CMS Payroll-Based Journal.

Total staff 272
Employees 104
Contractors 168
Staff to resident ratio 3.16:1
67% better than Illinois average

Illinois average ratio: 1.90:1

Avg staff/day 56
Average shift 7.8 hours
0% compared with Illinois average

Illinois average: 7.6 hours

Total staff hours (quarter) 39,567

Nursing staff breakdown

Registered Nurse

Manages medical care and health needs.

Total count 27
Average shift length Info Average shift length. Calculated as total hours divided by days worked and average staff per day. 7.2 hours

This role is partially covered by contractors.

Licensed Practical Nurse

Assists with medical care and medications.

Total count 35
Average shift length Info Average shift length. Calculated as total hours divided by days worked and average staff per day. 8.4 hours

This role is partially covered by contractors.

Certified Nursing Assistant

Helps with daily care and mobility.

Total count 157
Average shift length Info Average shift length. Calculated as total hours divided by days worked and average staff per day. 7.8 hours

This role is partially covered by contractors.

Contractor staffing

Total hours from contractors

19.3%

7,637 contractor hours this quarter

Certified Nursing Assistant: 102 Licensed Practical Nurse: 20 Qualified Activities Professional: 10 Speech Language Pathologist: 7 Registered Nurse: 6 Respiratory Therapy Technician: 5 Physical Therapy Aide: 5 Qualified Social Worker: 3 Medical Director: 3 Physical Therapy Assistant: 2 Occupational Therapy Aide: 2 Nurse Practitioner: 1 Therapeutic Recreation Specialist: 1 Other Social Services Staff: 1

Staff by category

Certified Nursing Assistant5510215717,46391100%7.8
Licensed Practical Nurse1520357,28691100%8.4
Registered Nurse216274,70591100%7.2
Qualified Activities Professional010102,25091100%9
Other Dietary Services Staff6061,35791100%7.3
Speech Language Pathologist0771,1098796%7.5
Mental Health Service Worker2027117279%7.3
Respiratory Therapy Technician05562791100%5.9
Physical Therapy Aide0555316673%7.5
Physical Therapy Assistant0224916268%7.9
Qualified Social Worker0334866369%7.7
Nurse Practitioner1124776369%7.6
Dietitian1014516066%7.5
Administrator1014405560%8
RN Director of Nursing1014406167%7.2
Clinical Nurse Specialist1014025864%6.9
Occupational Therapy Aide0222425257%4.7
Medical Director033881314%2.4
Therapeutic Recreation Specialist011811%8
Other Social Services Staff011211%2
157 Certified Nursing Assistant
% of Days 100%
35 Licensed Practical Nurse
% of Days 100%
27 Registered Nurse
% of Days 100%
10 Qualified Activities Professional
% of Days 100%
6 Other Dietary Services Staff
% of Days 100%
7 Speech Language Pathologist
% of Days 96%
2 Mental Health Service Worker
% of Days 79%
5 Respiratory Therapy Technician
% of Days 100%
5 Physical Therapy Aide
% of Days 73%
2 Physical Therapy Assistant
% of Days 68%
3 Qualified Social Worker
% of Days 69%
2 Nurse Practitioner
% of Days 69%
1 Dietitian
% of Days 66%
1 Administrator
% of Days 60%
1 RN Director of Nursing
% of Days 67%
1 Clinical Nurse Specialist
% of Days 64%
2 Occupational Therapy Aide
% of Days 57%
3 Medical Director
% of Days 14%
1 Therapeutic Recreation Specialist
% of Days 1%
1 Other Social Services Staff
% of Days 1%

Facility Characteristics

Source: CMS Long-Term Care Facility Characteristics (Data as of Jan 2026)

Total residents 86
Medicare
24
27.9% of residents
Medicaid
58
67.4% of residents
Private pay or other
4
4.7% of residents
Programs & Services
Residents Group

Residents meet regularly to discuss policies, care quality, and activities

Active Resident Council

Organized group of residents that meets regularly to discuss facility policies, quality of life, and activities.

Quality of care over time

These measures show how residents usually do over time at this home, based on health outcomes and preventive care.

High-risk clinical events score Info A composite score based on pressure ulcers, falls with injury, weight loss, walking ability decline, and activities of daily living decline. 6.4
35% better than Illinois average

Illinois average: 9.7

Functional decline score Info A composite score based on activities of daily living decline, walking ability decline, and incontinence. 12.5
33% better than Illinois average

Illinois average: 18.6

Long-stay resident measures
Need for Help with Daily Activities Increased Info Percent of long-stay residents whose need for help with daily activities has increased 9.3%
40% better than Illinois average

Illinois average: 15.5%

Walking Ability Worsened Info Percent of long-stay residents whose ability to move independently worsened 8.9%
52% better than Illinois average

Illinois average: 18.4%

Low Risk Residents with Bowel/Bladder Incontinence Info Percent of low risk long-stay residents who lose control of their bowels or bladder 19.3%
10% better than Illinois average

Illinois average: 21.6%

Falls with Major Injury Info Percent of long-stay residents experiencing one or more falls with major injury 1.3%
62% better than Illinois average

Illinois average: 3.4%

High Risk Residents with Pressure Ulcers Info Percent of long-stay high risk residents with pressure ulcers 10.0%
90% worse than Illinois average

Illinois average: 5.3%

Urinary Tract Infection Info Percent of long-stay residents with a urinary tract infection 1.3%
28% better than Illinois average

Illinois average: 1.8%

Lost Too Much Weight Info Percent of long-stay residents who lose too much weight 2.3%
65% better than Illinois average

Illinois average: 6.5%

Depressive Symptoms Info Percent of long-stay residents who have depressive symptoms 7.7%
84% better than Illinois average

Illinois average: 48.1%

Antipsychotic Use Info Percent of long-stay residents who received an antipsychotic medication 8.7%
57% better than Illinois average

Illinois average: 20.2%

Pneumococcal Vaccine Info Percent of long-stay residents assessed and appropriately given the pneumococcal vaccine 89.7%
In line with Illinois average

Illinois average: 89.2%

Influenza Vaccine Info Percent of long-stay residents assessed and appropriately given the seasonal influenza vaccine 91.8%
In line with Illinois average

Illinois average: 91.6%

Short-stay resident measures
Pneumococcal Vaccine Info Percent of short-stay residents assessed and appropriately given the pneumococcal vaccine 48.0%
30% worse than Illinois average

Illinois average: 68.3%

Antipsychotic medication increase Info Percent of short-stay residents who newly received an antipsychotic medication 0.7%
72% better than Illinois average

Illinois average: 2.3%

Influenza Vaccine Info Percent of short-stay residents assessed and appropriately given the seasonal influenza vaccine 38.1%
40% worse than Illinois average

Illinois average: 63.0%

Penalties and fines

Federal penalties imposed by CMS for regulatory violations, including civil money penalties (fines) and denials of payment for new Medicare/Medicaid admissions.

Source: CMS Penalties Database (Data as of Jan 2026)

Total fines amount $44K
69% lower than Illinois average

Illinois average: $143K

Number of fines 1
66% fewer fines than Illinois average

Illinois average: 3.0

Payment Denials Info Serious action where Medicare and/or Medicaid temporarily stops payments for new residents until issues are fixed. 0
100% fewer payment denials than Illinois average

Illinois average: 1.1

Fines amount comparison
This facility $44K
Illinois average $143K
Penalty History

Penalties are imposed by CMS for violations of federal nursing home regulations.

1 penalty in the past 3 years

Sep 12, 2024 · $44K

Civil Money Penalty Info Fines imposed for noncompliance, which can be assessed per day or per instance of violation. Sep 12, 2024
$44K

Last updated: Jan 2026

Compare Nursing Home around Mount Prospect

The information below is reported by the Illinois Department of Public Health, Office of Health Care Regulation.

2 facilities compared · CMS & IL Dept. of Health data · Updated May 2026

Filter by care type
Citadel of Northbrook
AL

Assisted Living A licensed, long-term care setting for seniors or individuals with disabilities who need help with daily activities — like bathing, dressing, and medication management — but not 24-hour skilled nursing. Offers housing, meals, and around-the-clock support while aiming to maximize resident independence.

HC

Home Care Professional care delivered in the person's own home — from companionship and errands to skilled nursing and therapy. Allows seniors to age in place. Medicare covers skilled home health when medically necessary.

MC

Memory Care Secured, specialized care for people living with Alzheimer's or dementia. Staff trained in cognitive impairment, with higher staff-to-resident ratios and an environment designed to reduce confusion and wandering risk.

NH

Nursing Home Licensed facility providing 24/7 skilled nursing care for residents with complex, ongoing medical needs. Staffed by RNs, LPNs, and CNAs. Inspected and star-rated annually by CMS. Accepts Medicare (short-term rehab) and Medicaid (long-term care).

RC

Respite Care Short-term temporary care — days to weeks — to give family caregivers a break. Full care provided during the stay. Often used after hospitalization or to trial a facility before a permanent placement decision.

Northbrook158 86.9% +25%2.91 -29%-6%2264.35133 56 -$27.9M$7.6M27.1%145982
Alden Des Plaines Rehabilitation & Health Care Center
NH

Nursing Home Licensed facility providing 24/7 skilled nursing care for residents with complex, ongoing medical needs. Staffed by RNs, LPNs, and CNAs. Inspected and star-rated annually by CMS. Accepts Medicare (short-term rehab) and Medicaid (long-term care).

Des Plaines110 61.9% -11%3.03 -30%-2%1131.6283 42 Joseph Rusinak$11.6M$6.5M56%145998

Guides for Better Senior Living

Care Cost Calculator: See Prices in Your Area

Nursing Home Data Explorer

Don’t Wait Too Long: 7 Red Flag Signs Your Parent Needs Assisted Living Now

The True Cost of Assisted Living in 2025 – And How Families Are Paying For It

Understanding Senior Living Costs: Pricing Models, Discounts & Financial Assistance

Frequently Asked Questions about Alden Des Plaines Rehabilitation & Health Care Center

Is Alden Des Plaines Rehabilitation & Health Care Center in a walkable area?

Alden Des Plaines Rehabilitation & Health Care Center has a walk score of 42. Somewhat walkable. A few nearby services may be reachable on foot, but most trips require transportation.

What is the address of Alden Des Plaines Rehabilitation & Health Care Center?

Alden Des Plaines Rehabilitation & Health Care Center is located at 1221 E Golf Rd, Des Plaines, IL 60016.

What is the phone number of Alden Des Plaines Rehabilitation & Health Care Center?

(847) 768-1300 will put you in contact with the team at Alden Des Plaines Rehabilitation & Health Care Center.

Is Alden Des Plaines Rehabilitation & Health Care Center Medicare or Medicaid certified?

Yes — Alden Des Plaines Rehabilitation & Health Care Center is a CMS-certified provider of Medicare and Medicaid.

Explore Open Rooms
1 Contact details
2 What type of senior care service are you looking for?
3 What budget do you have in mind for senior care?
4 How soon do you need to find care?
5 Additional details

Thank you for your interest!

Our team will be in touch shortly to help with next steps.