


Loading preview…
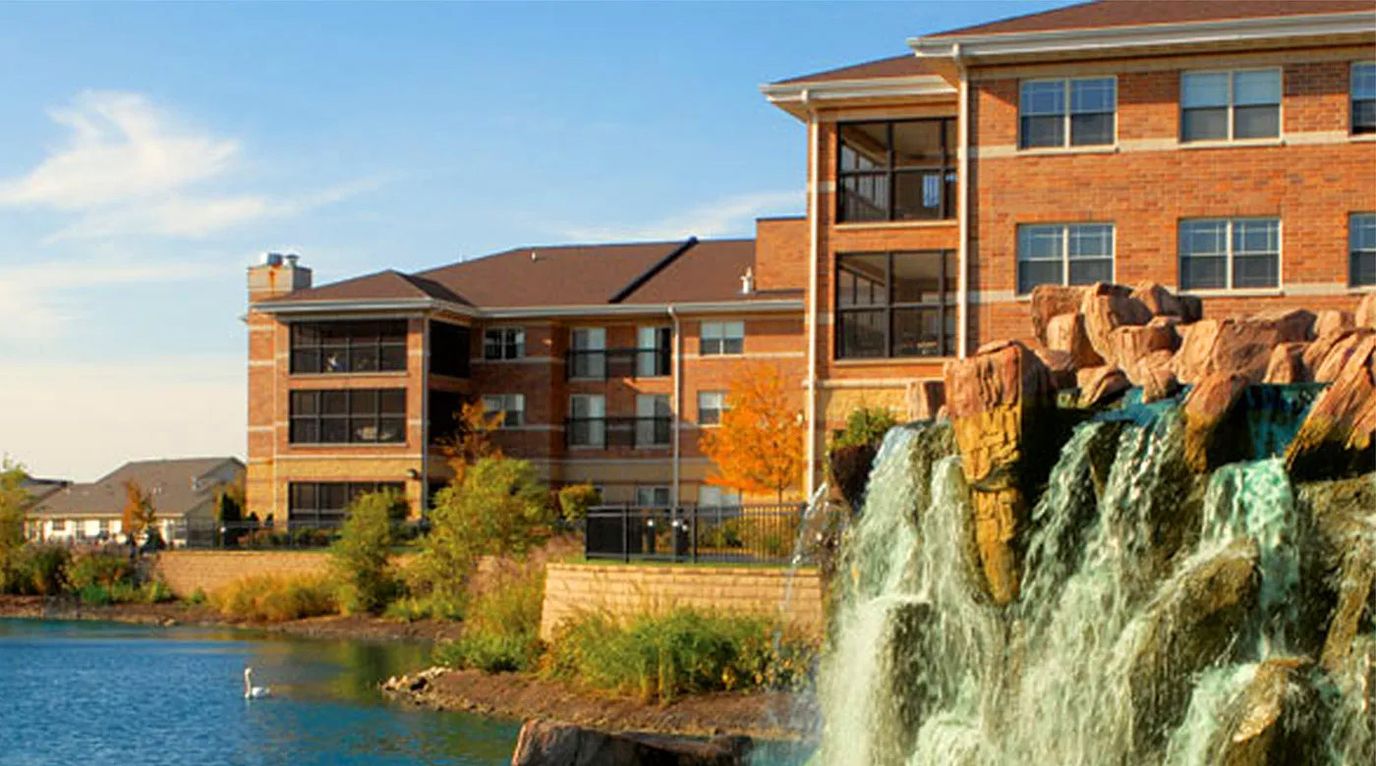
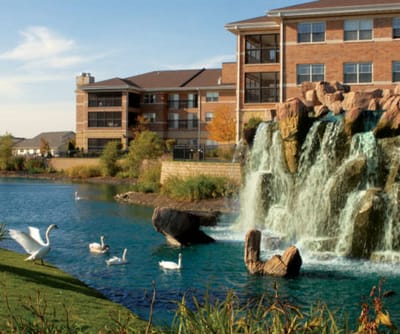
Alden Gardens of Waterford
Assisted Living & Respite Care · Aurora, IL


Alden Gardens of Waterford
Assisted Living & Respite Care · Aurora, IL
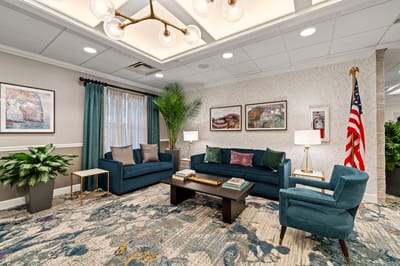
Alden Gardens of Waterford offers exceptional personal care for residents of assisted living. Expect nothing but elegance and luxury for seniors who want assisted living at its best. The spirited community performs nothing less than exceptional service offered by its professional and compassionate staff. Alden Gardens is the home for seniors looking to thrive in the community.
Life at Alden Gardens is all about satisfying the wellness of each senior; their personalized care is inclusive of daily health checks and medication management, housekeeping, ADLs, and scheduled activities. Respite stays are allowed.
18 years in operation Rank #77 / 177Years in operation — State benchmarkedThis home is ranked 77th out of 177 homes in Illinois for years in operation. Shows how long this facility has been in operation compared to other Illinois facilities. Longer operating histories may benefit residents, families, and staff.Facilities with the same value for a metric share the same rank. Rankings are based only on facilities in Illinois that report data for that category. Facilities without available data are excluded from the ranking.Click the rank badge to see the full State ranking.Click here to see the full State ranking.
A longer operating history, which may indicate experience navigating regulations and delivering ongoing care.
Walk Score: 39 / 100 Rank #430 / 634Walk Score — State benchmarkedThis home is ranked 430th out of 634 homes in Illinois for walk score. Shows how walkable this facility's neighborhood is compared to the average walk score across Illinois facilities. Higher scores benefit residents, families, and staff.Facilities with the same value for a metric share the same rank. Rankings are based only on facilities in Illinois that report data for that category. Facilities without available data are excluded from the ranking.Click the rank badge to see the full State ranking.Click here to see the full State ranking.
Somewhat walkable. A few nearby services may be reachable on foot, but most trips require transportation.
BBB Rating: A+ (Not Accredited)
An independent rating from the Better Business Bureau based on factors such as complaint history, transparency, and business practices.
How BBB ratings work
How BBB ratings work
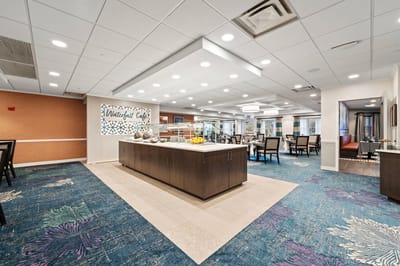
About this community
CMS Certification Number146182
Emergency SystemsYes
Safety FeaturesEmergency call systems in each resident apartment.
Rehabilitation Services
Respite Care
Nursing Services
24-Hour Staffing
Fitness Center
Wellness Center
Emergency Call System
Transportation
Housekeeping
Laundry
Activities
ActivitiesFull activity schedule helping residents stay physically, mentally, and emotionally engaged
Specific ProgramsMedical Care and Services
What does this home offer?
Minimum Age: 65
No pets allowed
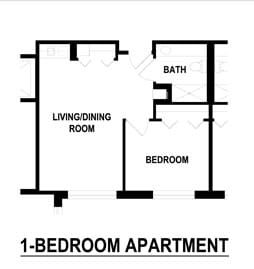
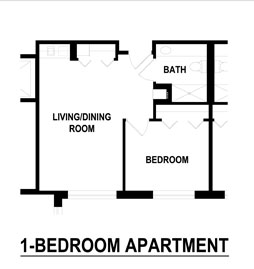
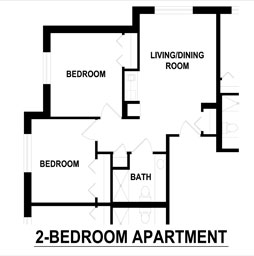
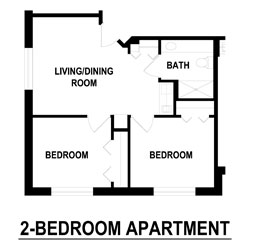
Housing Options: Studio / 1 bed / 2 bed
Building Type: Apartment
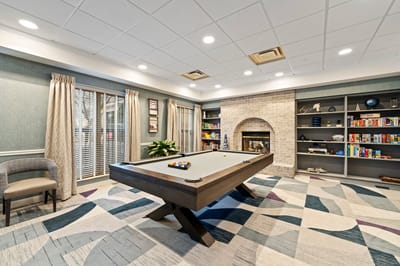
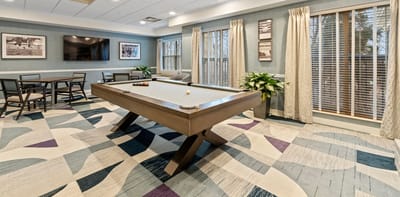
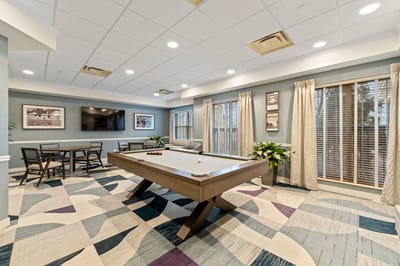
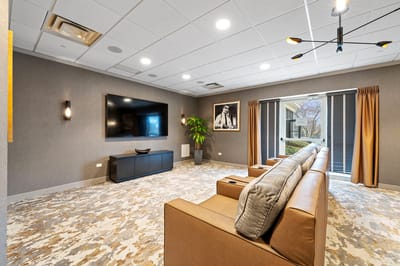
Fitness and Recreation
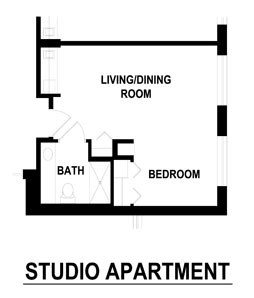
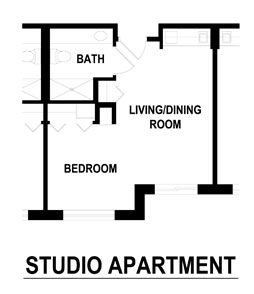
Living Spaces & Floor Plans for Alden Gardens of Waterford
Places of interest near Alden Gardens of Waterford
![]() 2.9 miles from city center
2.9 miles from city center
![]() Estimated distance in miles from Aurora's city center to Alden Gardens of Waterford's address, calculated via Google Maps.
— 0.68 miles to nearest hospital (Rush Copley Medical Center)
Estimated distance in miles from Aurora's city center to Alden Gardens of Waterford's address, calculated via Google Maps.
— 0.68 miles to nearest hospital (Rush Copley Medical Center)
Calculate Travel Distance to Alden Gardens of Waterford
Add your location
Compare Assisted Living around Aurora
Info below is compiled from the IL Dept. of Public Health (IDPH), senior community websites & trusted data sources such as Walk Score & BBB.
Communities are listed from highest to lowest based on our ranking methodology.
| Brighton Gardens of St. Charles | AL MC RC | St. Charles (Surrey Woods) | 104
Facility
104
IL AVG
85
Rank
#114 / 418 | Yes |
66
Facility
66
IL AVG
52
Rank
#187 / 634 | 18
Facility
18
IL AVG
17
Rank
#77 / 177 | A+ | Sjv 1 St. Charles Opco LLC | 14 | 5
Facility
5
IL AVG
7
Rank
#168 / 276 | 0.4
Facility
0.4
IL AVG
0.8
Rank
#124 / 276 | 3
Facility
3
IL AVG
3
Rank
#202 / 315 | 6
Facility
6
IL AVG
1.9
Rank
#292 / 315 | 1 Bed |
| Prairie Pointe Assisted Living and Memory Care | AL MC | Sugar Grove | 71
Facility
71
IL AVG
85
Rank
#209 / 418 | No |
41
Facility
41
IL AVG
52
Rank
#412 / 634 | - | - | Mcc Of Sugar Grove, LLC | 6 | 2
Facility
2
IL AVG
7
Rank
#88 / 276 | 0.3
Facility
0.3
IL AVG
0.8
Rank
#101 / 276 | 1
Facility
1
IL AVG
3
Rank
#62 / 315 | 3
Facility
3
IL AVG
1.9
Rank
#222 / 315 | Private Rooms |
| Alden Courts of Waterford | AL MC NH RC SNF | Aurora | 60
Facility
60
IL AVG
85
Rank
#248 / 418 | No |
58
Facility
58
IL AVG
52
Rank
#253 / 634 | 24
Facility
24
IL AVG
17
Rank
#53 / 177 | A+ | - | 5 | 20
Facility
20
IL AVG
7
Rank
#244 / 276 | 4.0
Facility
4.0
IL AVG
0.8
Rank
#258 / 276 | 2
Facility
2
IL AVG
3
Rank
#142 / 315 | 0
Facility
0
IL AVG
1.9
Rank
#1 / 315 | Private Rooms / Semi-Private Rooms |
| Bardwell Residences | AL IL MC RC | Aurora | 37
Facility
37
IL AVG
85
Rank
#358 / 418 | Yes |
56
Facility
56
IL AVG
52
Rank
#272 / 634 | - | - | Fox Valley Developers, LLC | 8 | 3
Facility
3
IL AVG
7
Rank
#120 / 276 | 0.4
Facility
0.4
IL AVG
0.8
Rank
#124 / 276 | 2
Facility
2
IL AVG
3
Rank
#142 / 315 | 3
Facility
3
IL AVG
1.9
Rank
#222 / 315 | Studio / 1 Bed / 2 Bed |
| Alden Gardens of Waterford | AL RC | Aurora | - | No |
39
Facility
39
IL AVG
52
Rank
#430 / 634 | 18
Facility
18
IL AVG
17
Rank
#77 / 177 | A+ | - | - | - | - | - | - | Studio / 1 bed / 2 bed |
Financial Assistance for
Assisted Living in Illinois
Alden Gardens of Waterford is located in Aurora, Illinois.
Here are the financial assistance programs available to residents in Illinois.
Frequently Asked Questions about Alden Gardens of Waterford
Is Alden Gardens of Waterford in a walkable area?
Alden Gardens of Waterford has a walk score of 39. Somewhat walkable. A few nearby services may be reachable on foot, but most trips require transportation.
How long has Alden Gardens of Waterford been in business?
Alden Gardens of Waterford has been operating for approximately 18 years, based on available licensing and registration records.
Does Alden Gardens of Waterford have different floorplan options?
Yes — see the floorplan options available at Alden Gardens of Waterford on this page.
Are pets allowed at Alden Gardens of Waterford?
No, Alden Gardens of Waterford has a no-pet policy.
Are there photos of Alden Gardens of Waterford?
Yes — there are 21 photos of Alden Gardens of Waterford in the photo gallery on this page.
What is the address of Alden Gardens of Waterford?
Alden Gardens of Waterford is located at 1955 Randi Dr, Aurora, IL 60504.
What is the phone number of Alden Gardens of Waterford?
(630) 851-1880 will put you in contact with the team at Alden Gardens of Waterford.
Guides for Better Senior Living
Care Cost Calculator: See Prices in Your Area
Assisted Living Explorer
Don’t Wait Too Long: 7 Red Flag Signs Your Parent Needs Assisted Living Now
The True Cost of Assisted Living in 2025 – And How Families Are Paying For It
Understanding Senior Living Costs: Pricing Models, Discounts & Financial Assistance


Updated on
