Explore Open Rooms

1 Contact details
2 What type of senior care service are you looking for?
3 What budget do you have in mind for senior care?
4 How soon do you need to find care?
5 Additional details

Thank you for your interest!

Our team will be in touch shortly to help with next steps.

Nursing Home in Reno

CMS overall rating Info The Overall CMS Rating combines results from health inspections, staffing levels and quality measures. Health inspections carry the most weight. Staffing and quality scores can increase or decrease the final rating based on performance compared to state and national standards.

Alta Skilled Nursing and Rehabilitation Center

555 Hammill Ln, Reno, NV 89511 View map
Overview of Alta Skilled Nursing and Rehabilitation Center

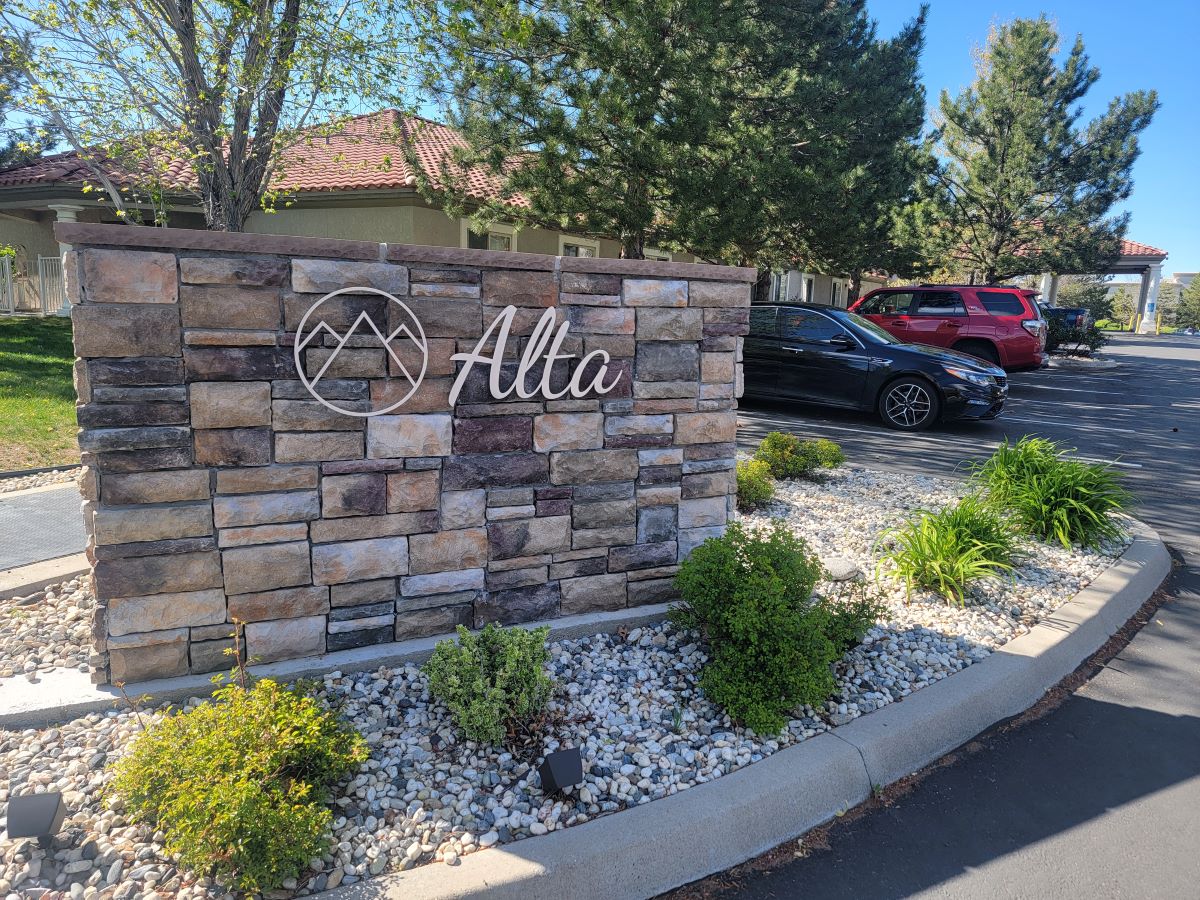
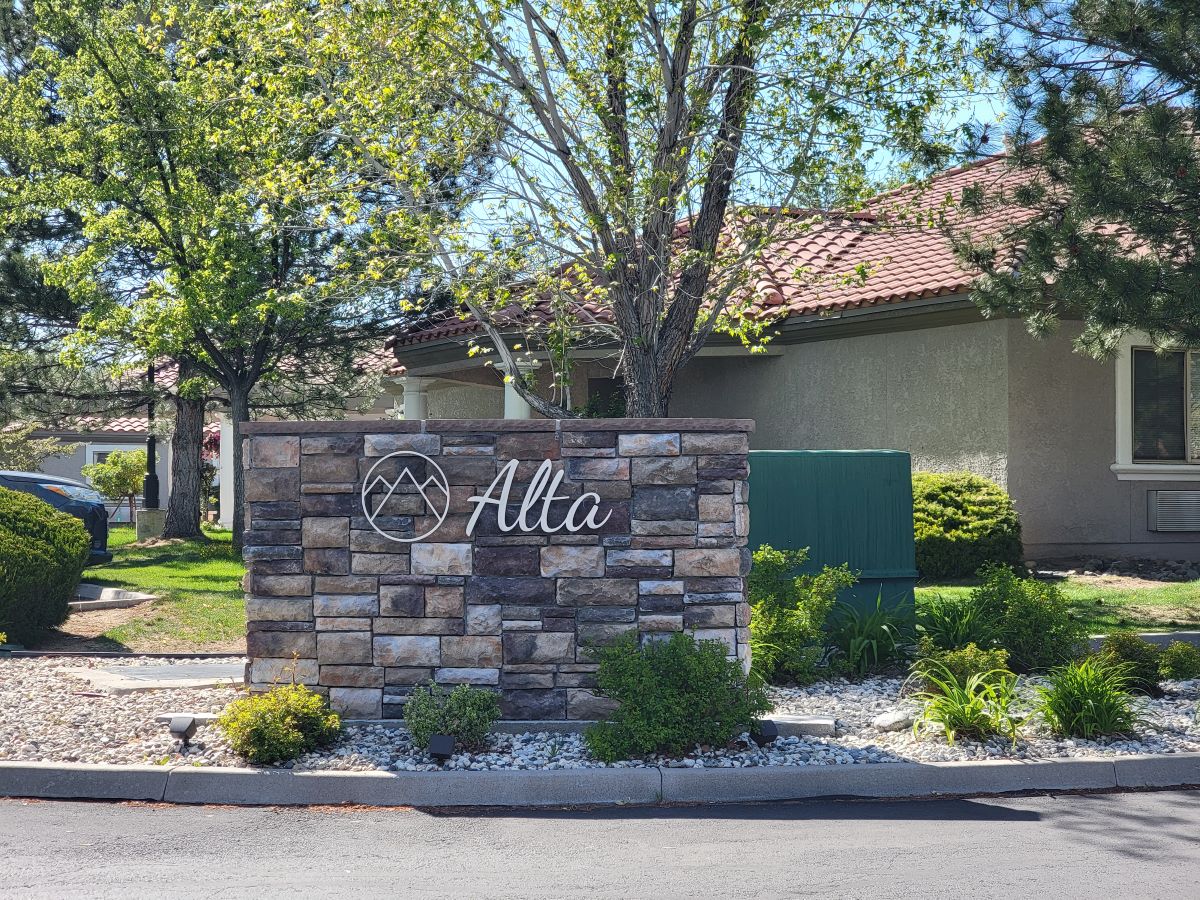
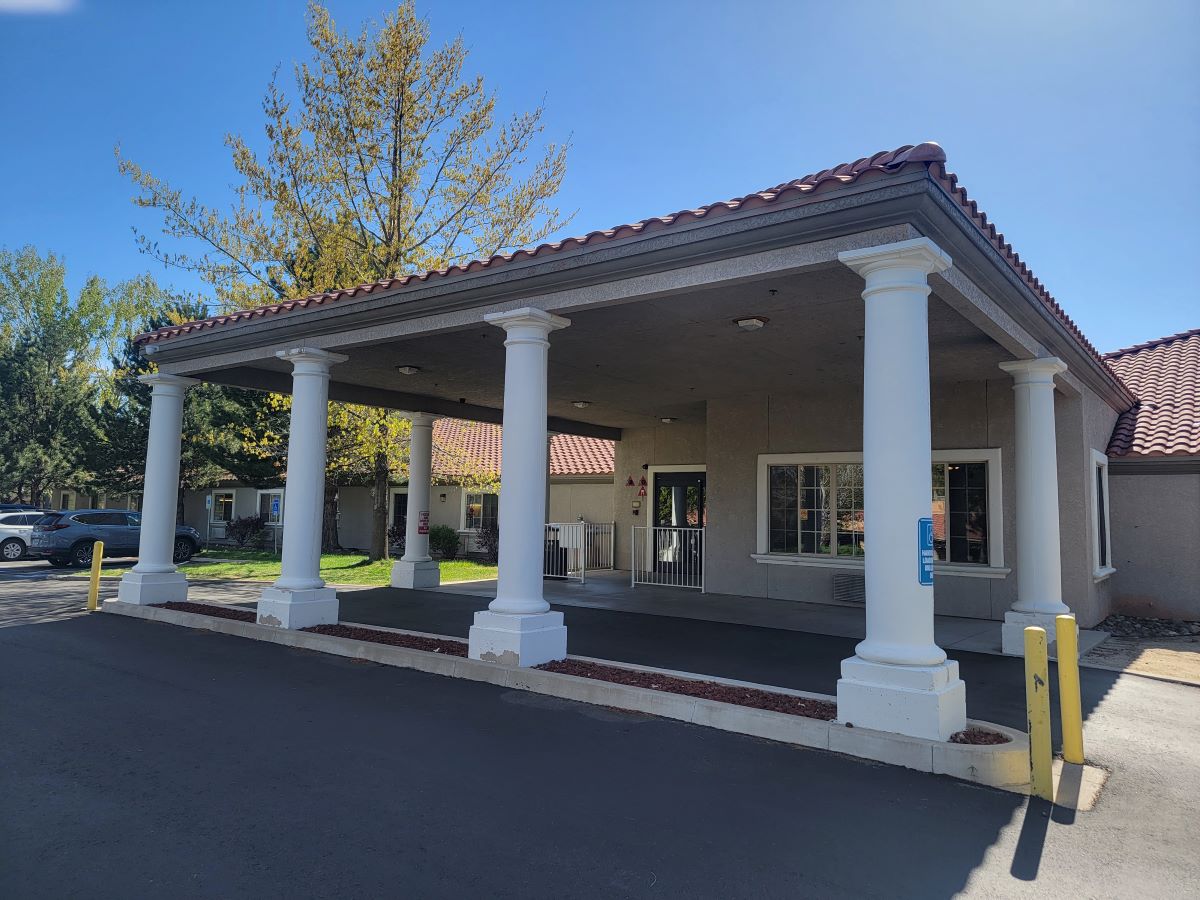
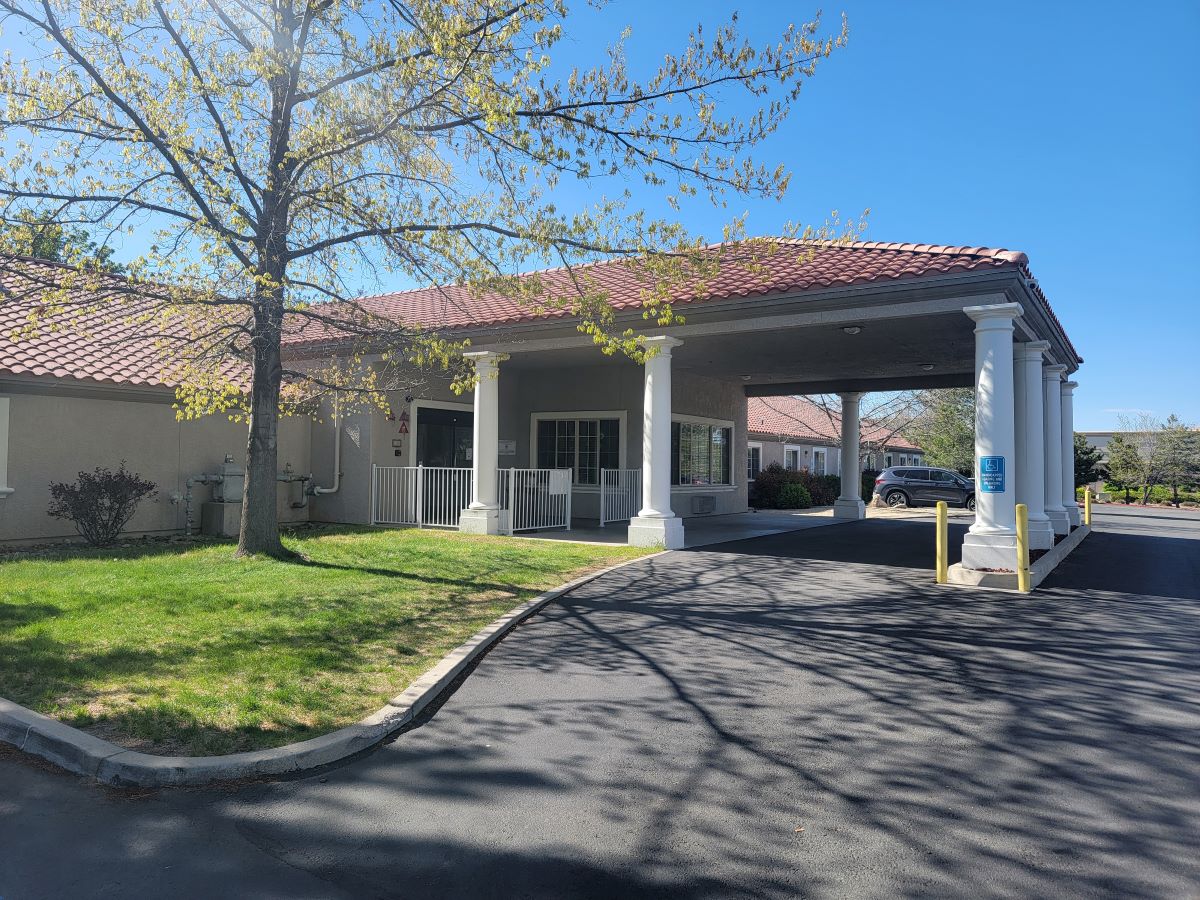
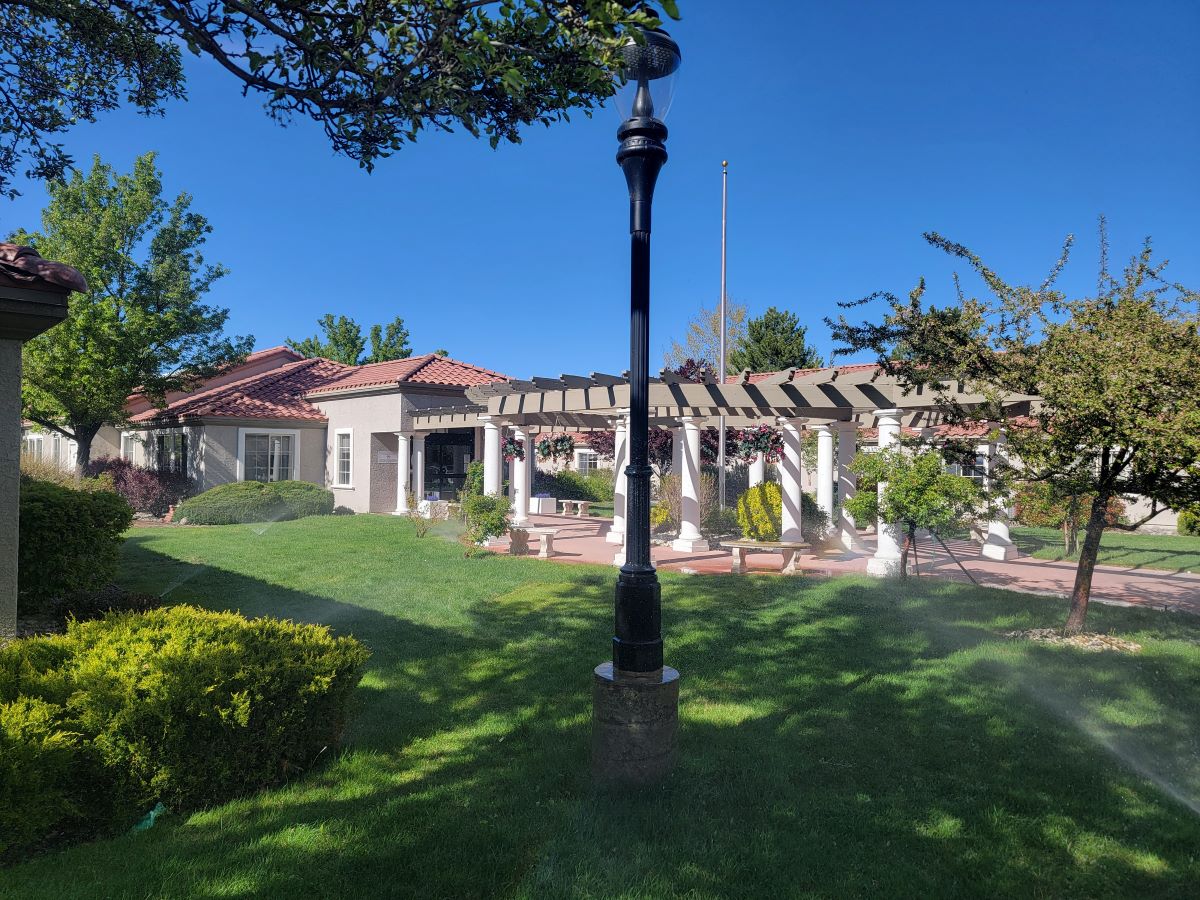
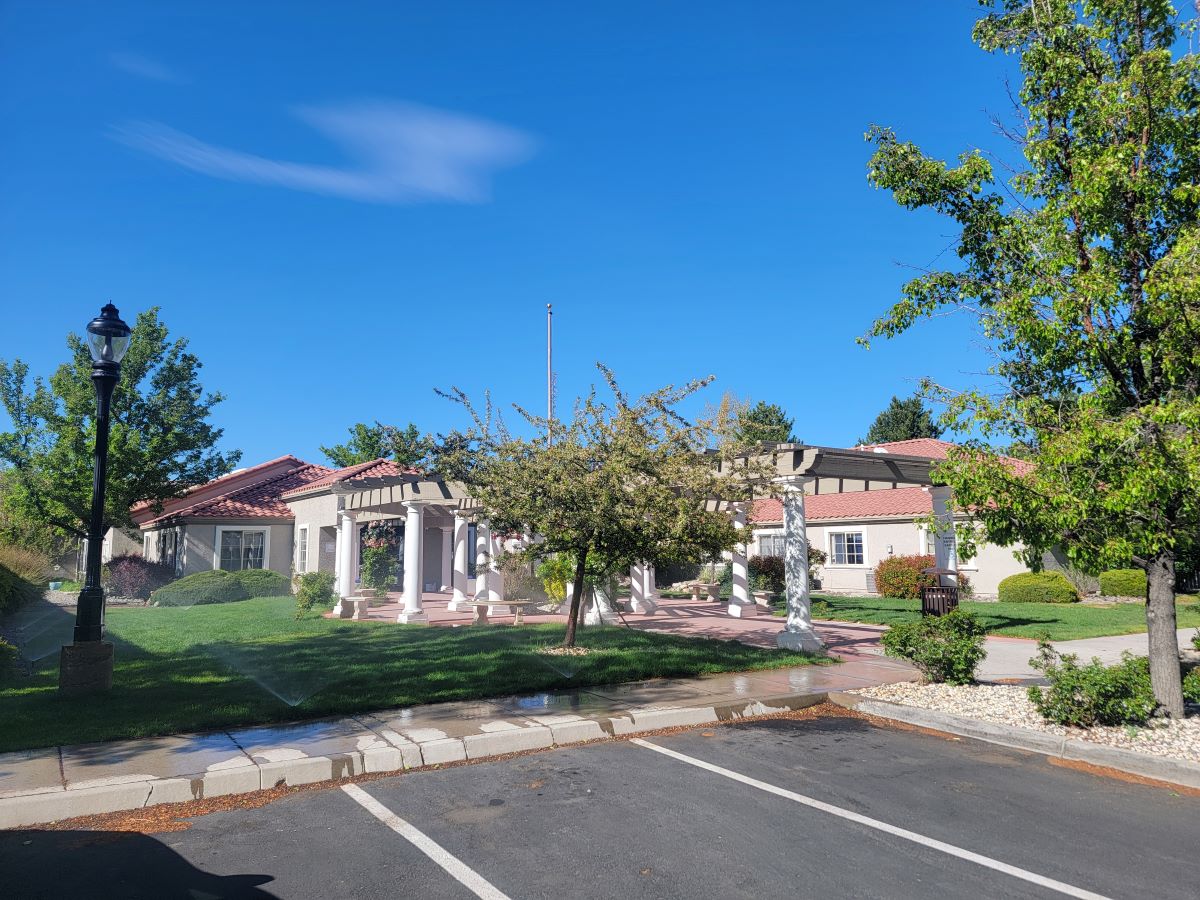
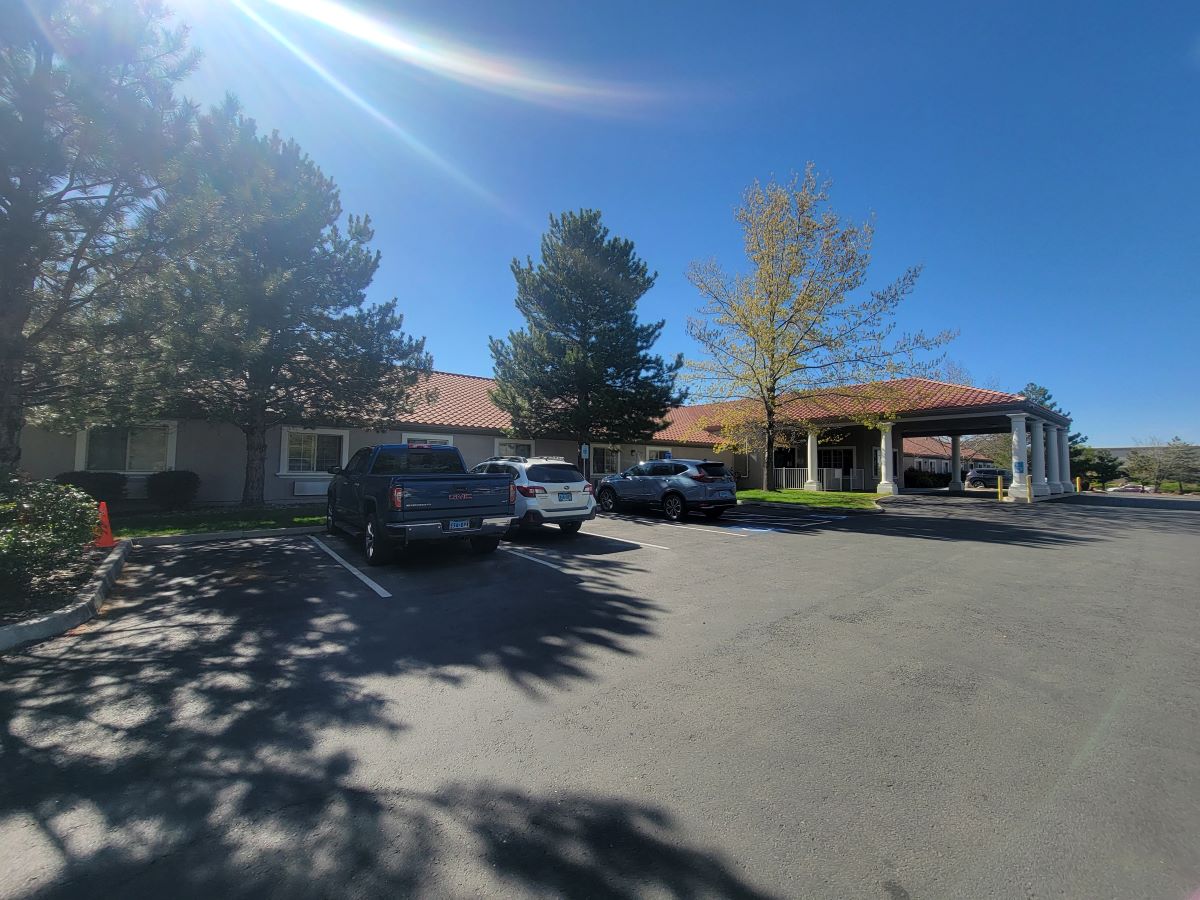
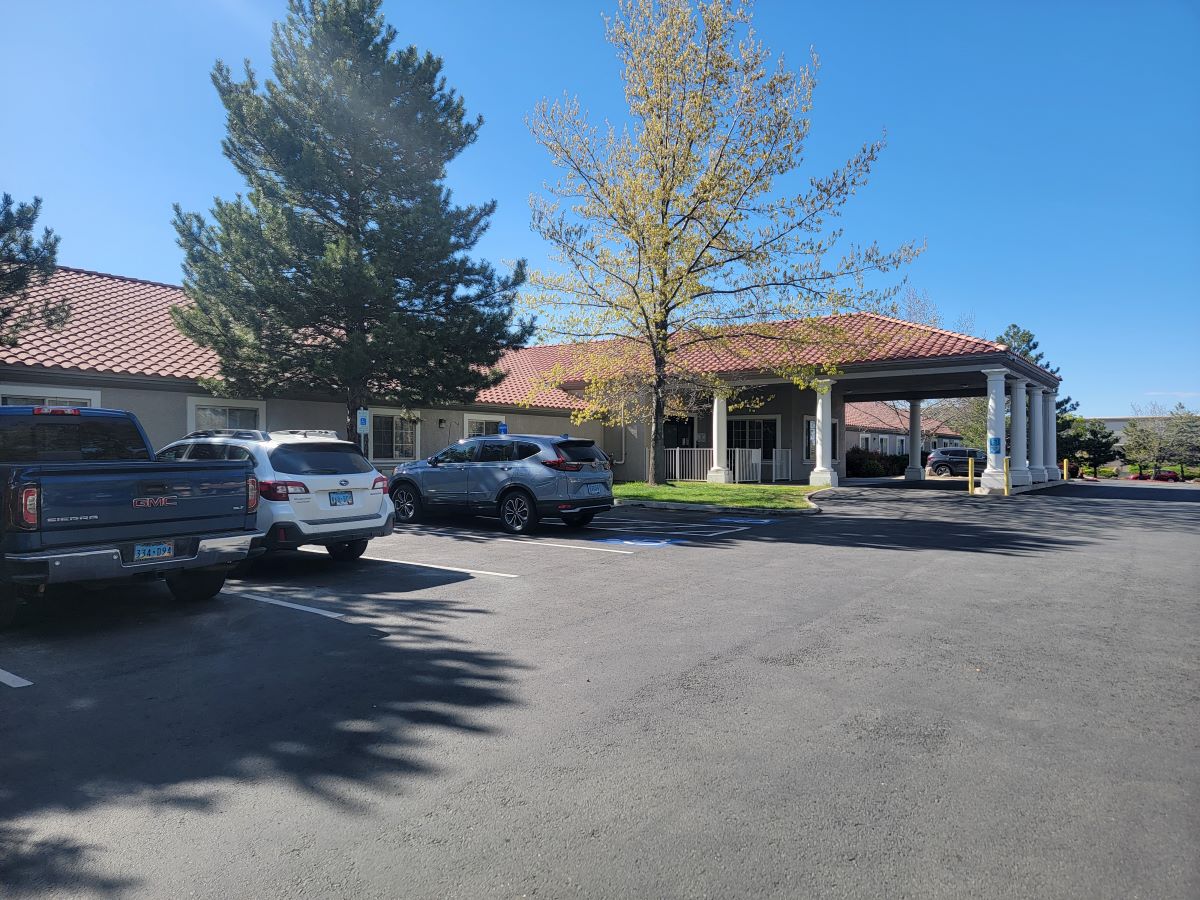
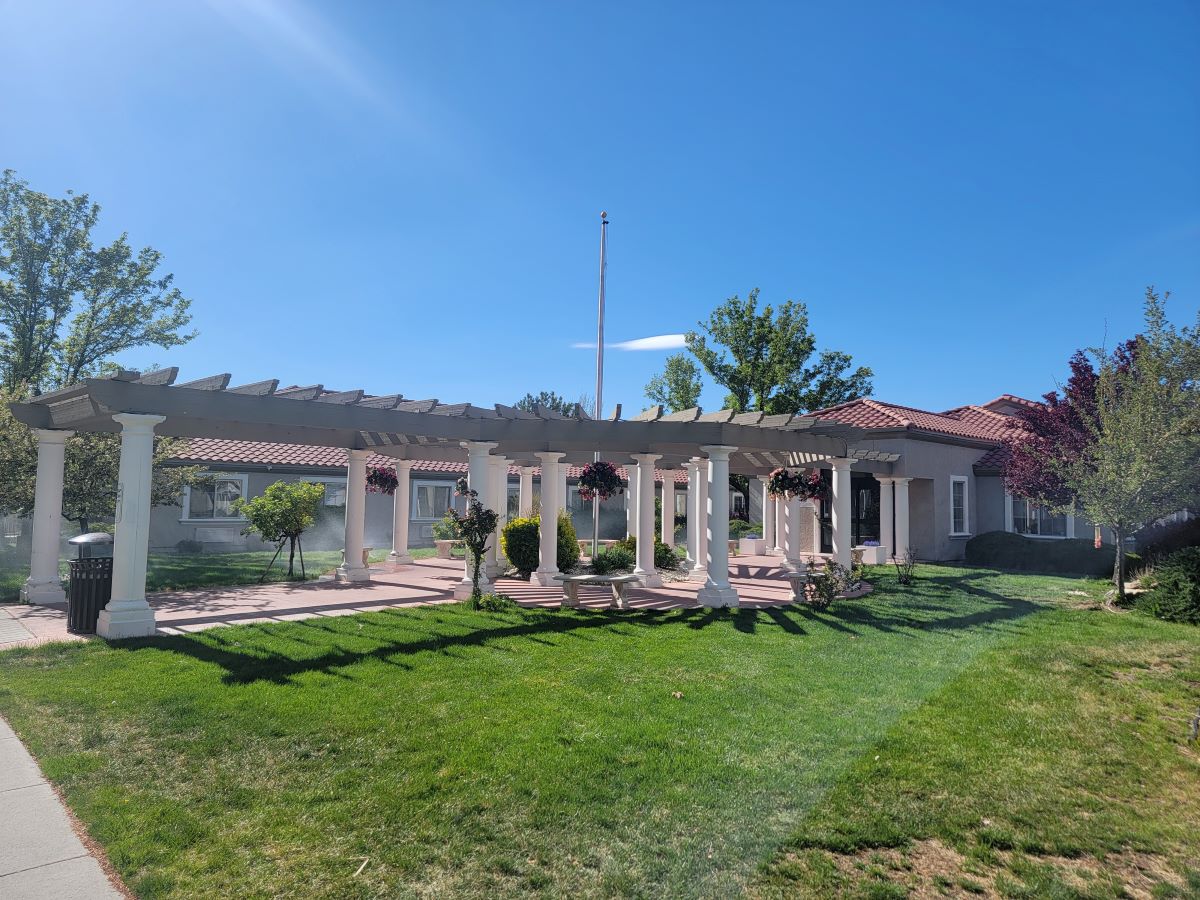
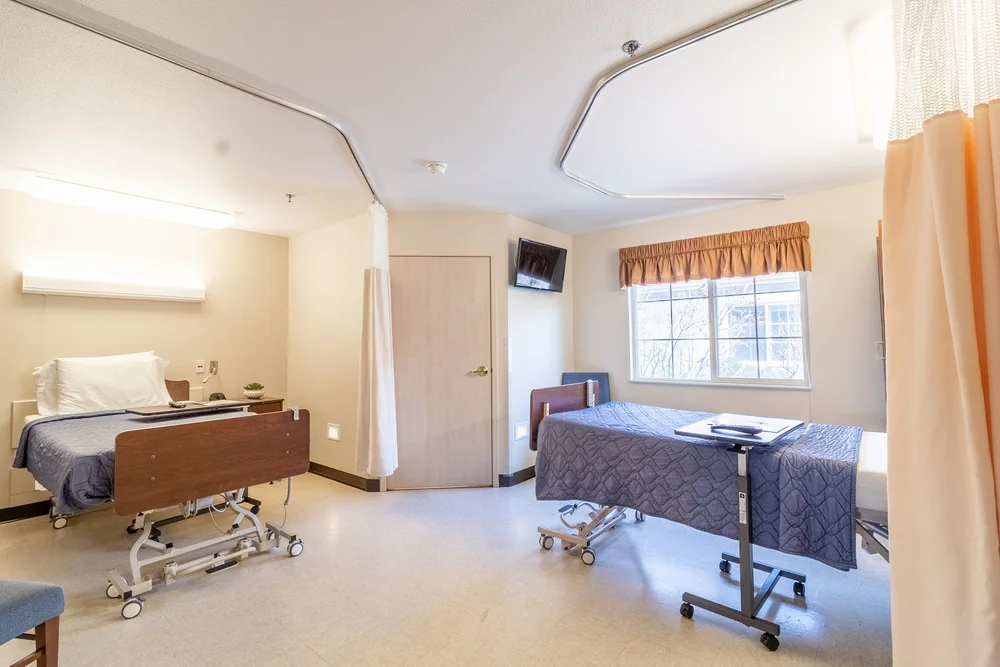
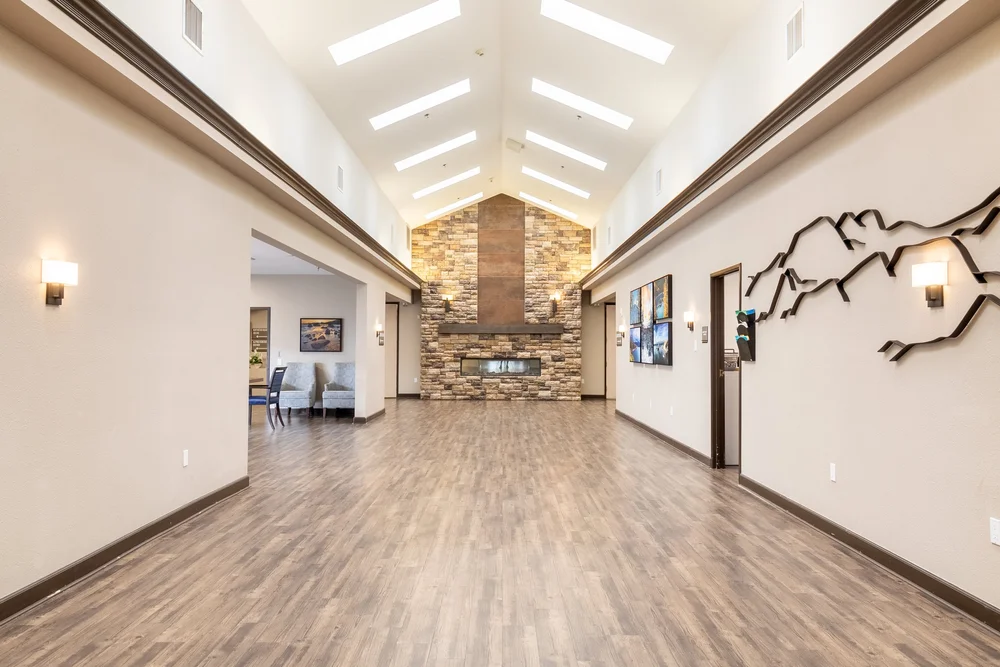
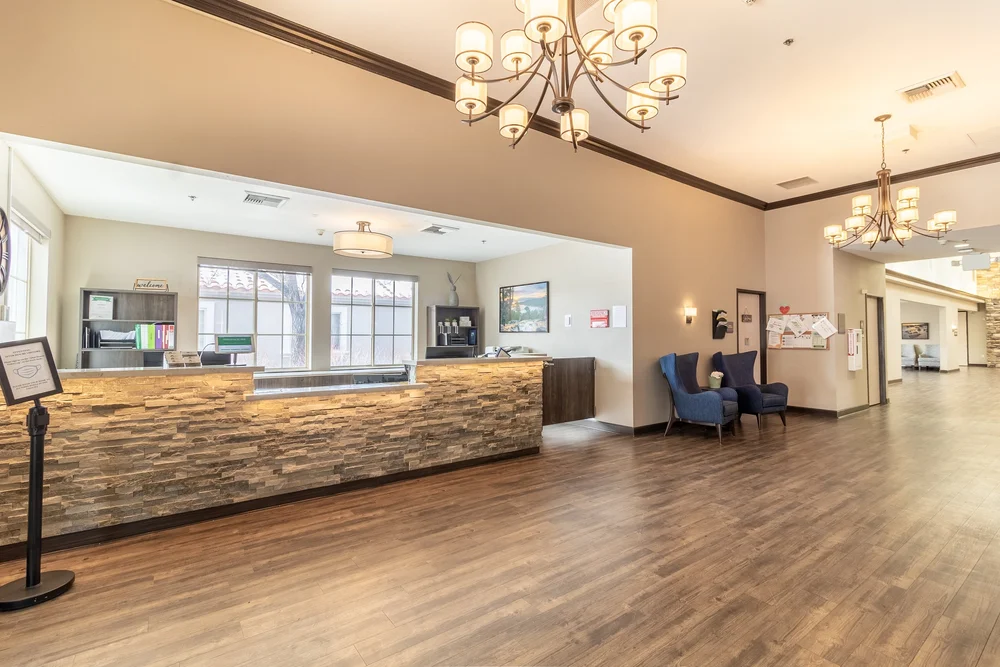
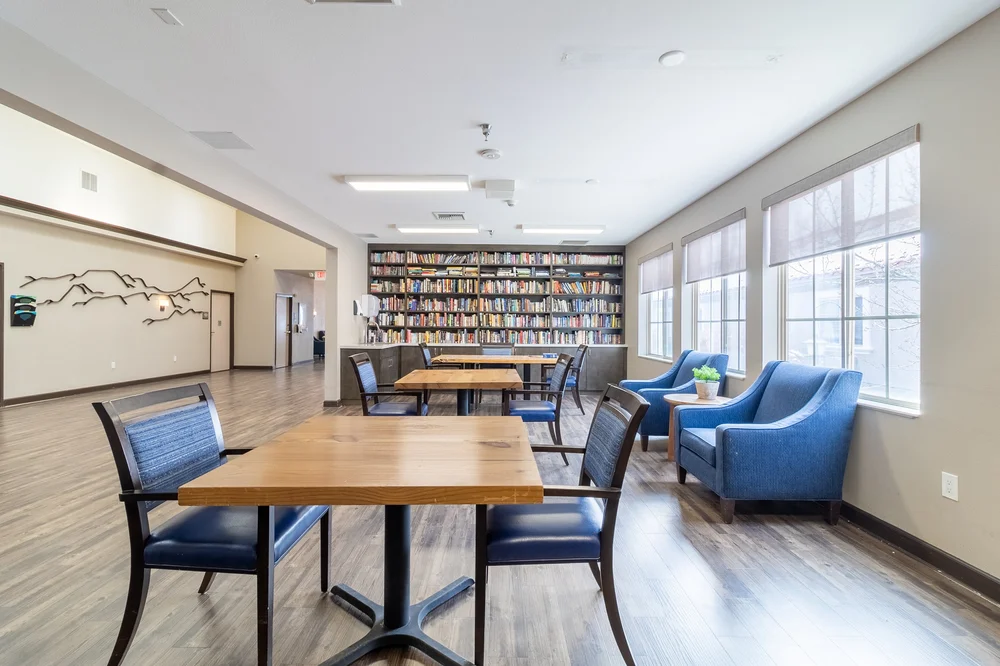
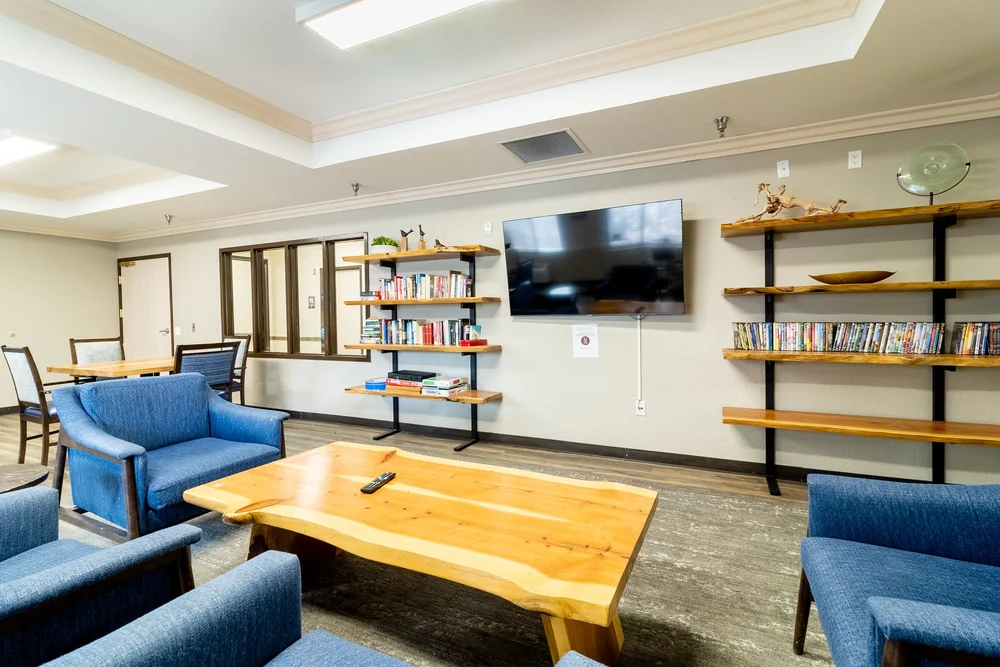
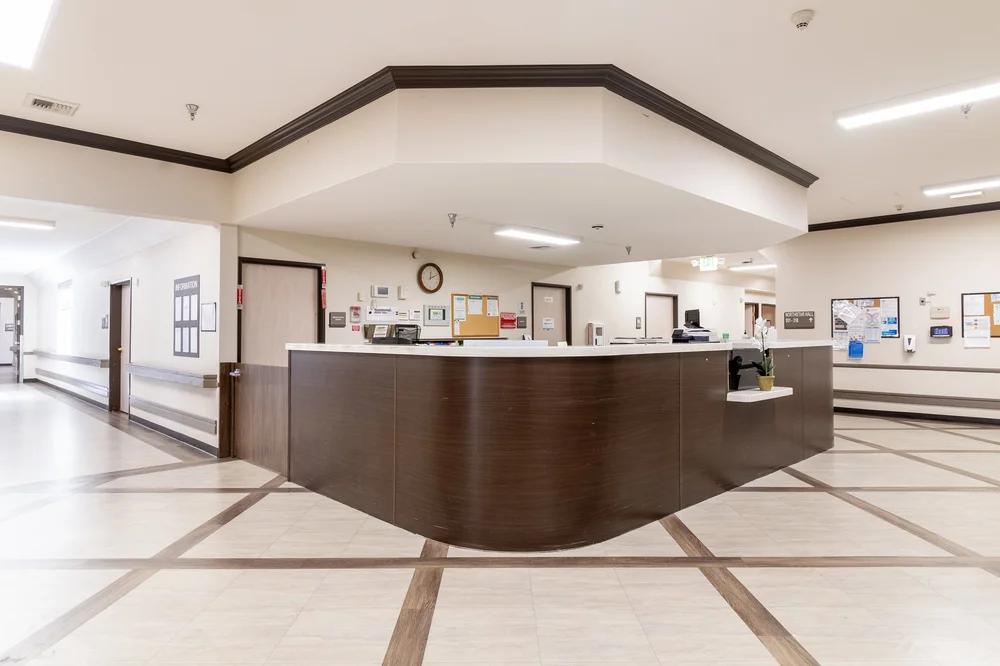
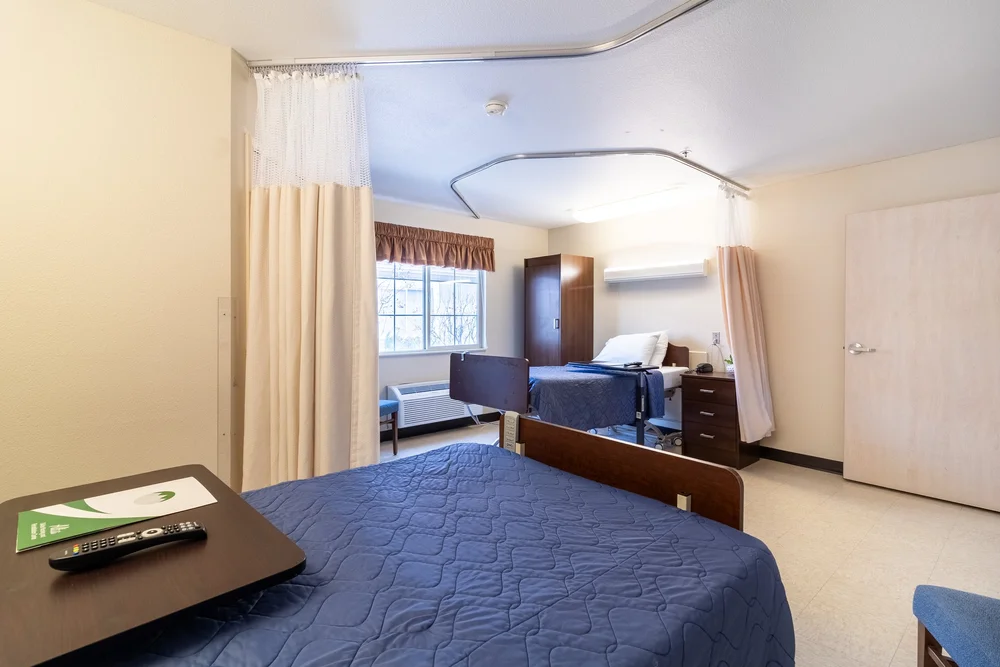
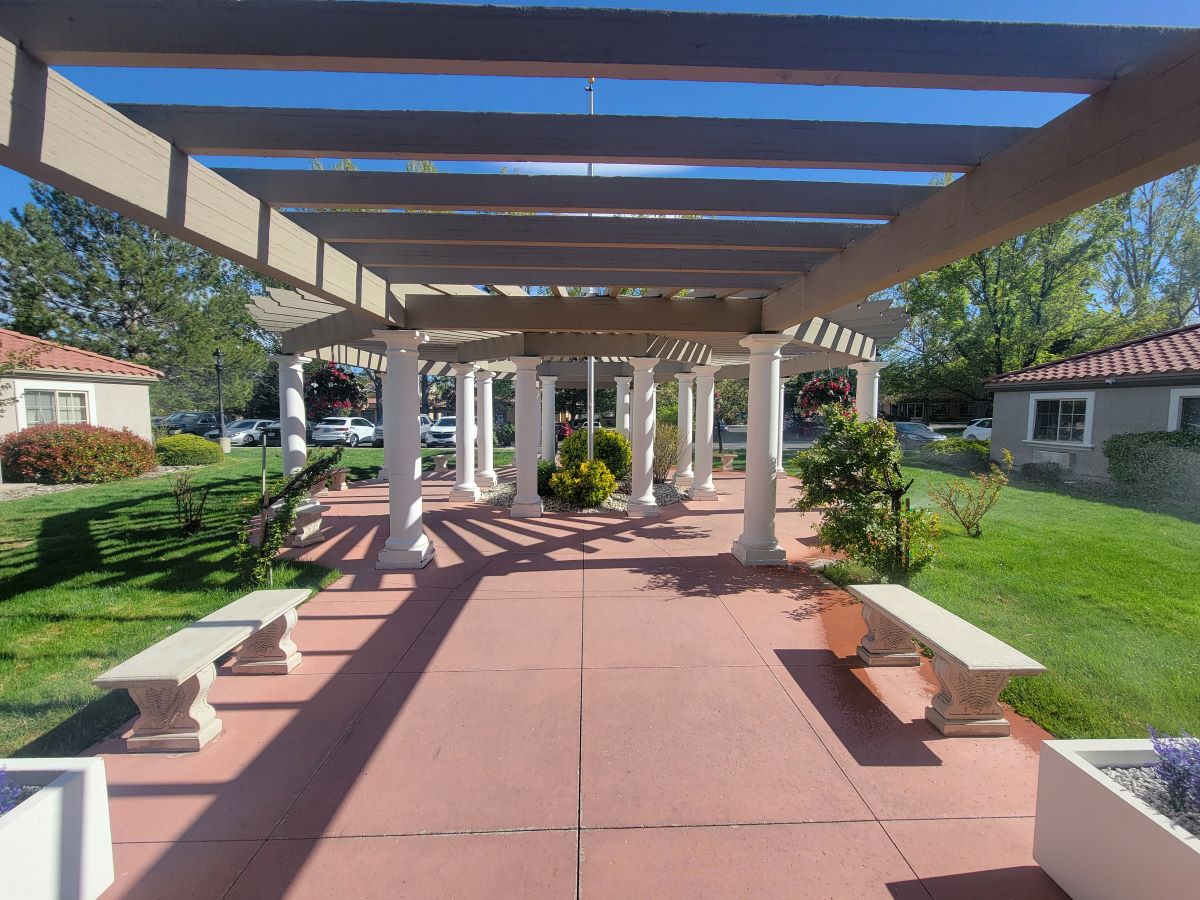
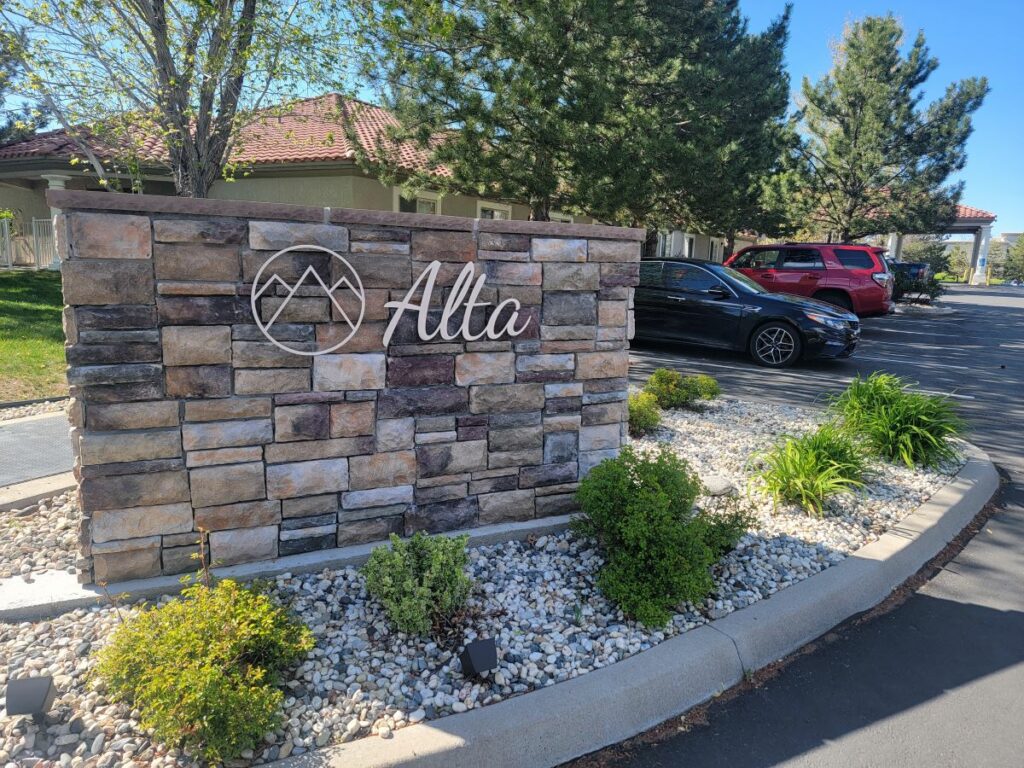
Alta Skilled Nursing and Rehabilitation Center is an elegant community that focuses on personalized care that allows for efficient senior living care. They do their best in encouraging, empowering, and enhancing the lives of its residents. The members of the community are encouraged to live freely and do more as they expand their vibrant social lives. Considerably one of the most trusted nursing homes in the city, management, and staff ensure that everything is designed and catered to the needs of all individuals. Alta is a warm and welcoming home-like environment that boasts a close and tight-knit relationship where there is a mutual level of respect and trust.
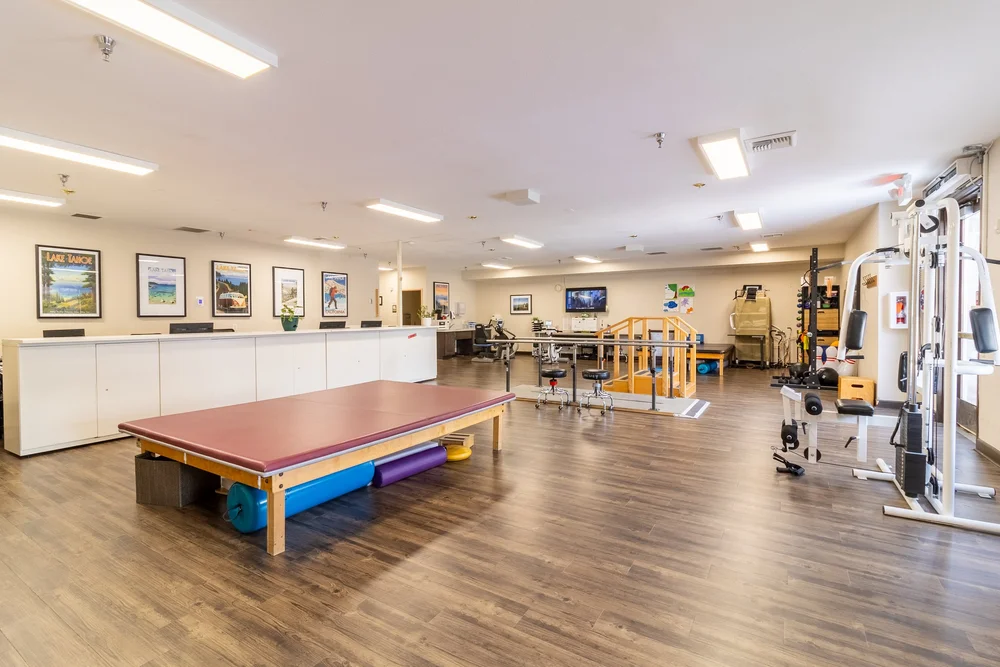
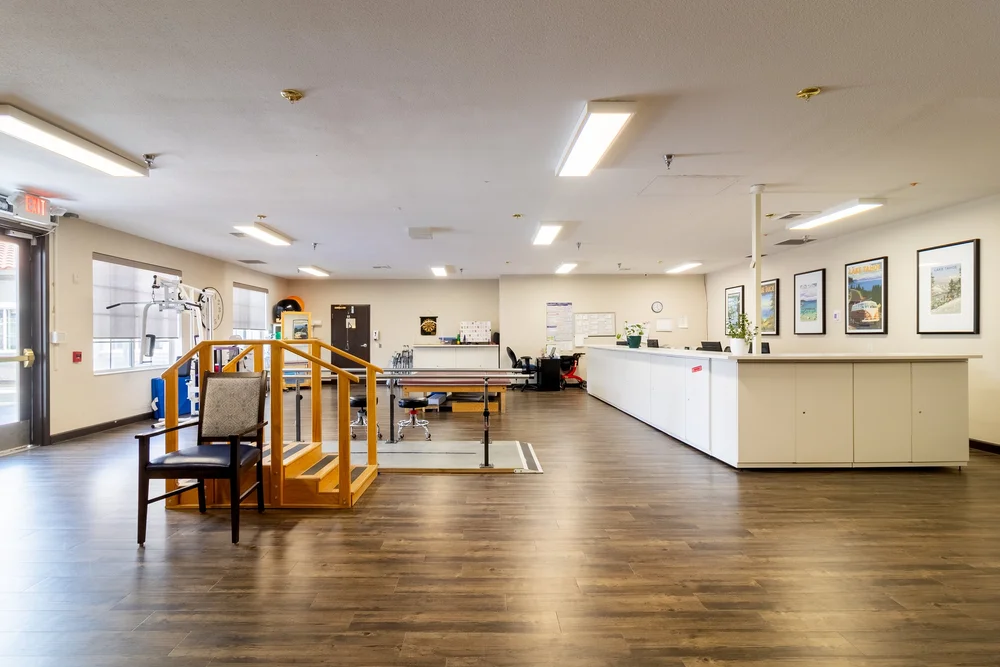
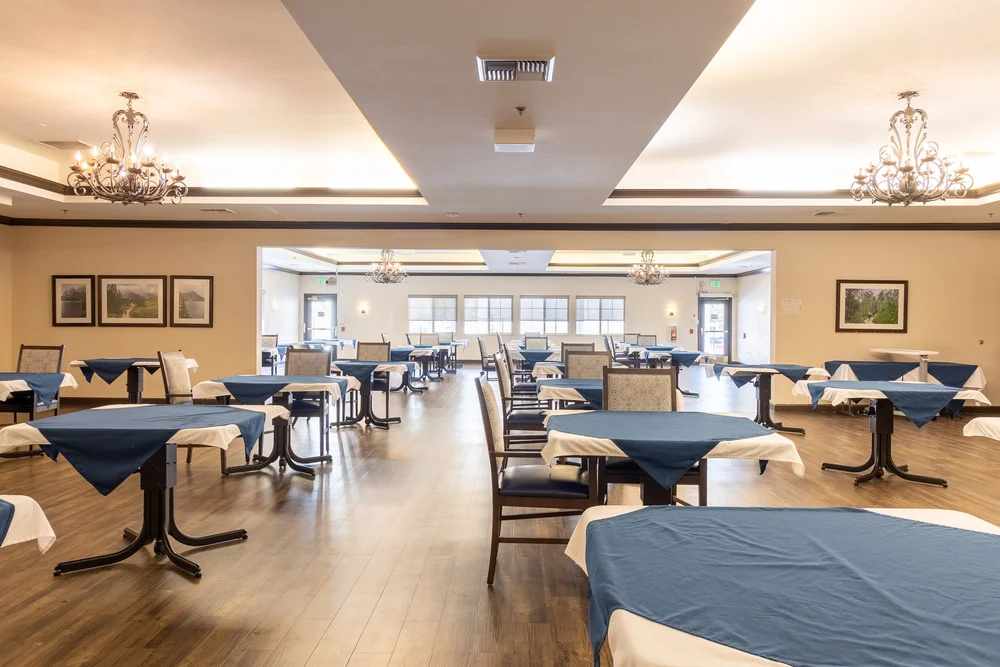
Comfort and convenience are the heart of their service– ensuring that residents are able to have a speedy recovery so they can be with their families as soon as possible. Comprehensive accommodations include social and recreational activities, delicious and healthy dining, health and exercises, rehabilitation programs. 

Managed by Jason Magbitang

Administrator

Jason Magbitang serves as the Administrator at Alta Skilled Nursing and Rehabilitation Center. He oversees key areas including activities, life enrichment, behavioral health, exercise and rehabilitation, and post discharge planning, ensuring comprehensive care and support for residents.

Quality ratings

Measured by Centers for Medicare & Medicaid Services (CMS)

Overall rating Info The Overall CMS Rating combines results from health inspections, staffing levels and quality measures. Health inspections carry the most weight. Staffing and quality scores can increase or decrease the final rating based on performance compared to state and national standards.
2/5
Nevada average: 2.7/5
Health Inspection Info Based on the results of the facility's three most recent standard inspections and any complaint investigations. CMS reviews the number, scope, and severity of deficiencies, with more recent findings weighted more heavily.
2/5
Nevada average: 2.6/5
Staffing Info Measures average nursing staff hours per resident per day, including Registered Nurses (RNs) and total nursing staff. Ratings are adjusted based on the level of care residents require and are compared to state and national benchmarks.
3/5
Nevada average: 2.8/5
Quality Measures Info Based on clinical and physical health indicators reported to CMS, such as hospital readmissions, falls, pressure ulcers, and improvements in mobility. These measures reflect how well residents' health needs are being managed.
2/5
Nevada average: 3.7/5

Nursing care per resident

Info This shows how many total hours of nursing staff time are available per resident each day. Higher numbers usually mean more staff support.
3h 48m per day

This home provides 6% more nursing time per resident than the Nevada average.

Nevada average: 3h 34m per day

Staffing hours breakdown

Info Hours of care per resident per day, broken down by staff type. Data from CMS Medicare.
Staff type Facility State avg National avg
Registered Nurse (RN) Info Registered nurse hours per resident per day. 28m per day 1h 4m per day 41m per day
Nurse Aide Info Nurse aide hours per resident per day. 2h 7m per day 2h 23m per day 2h 21m per day
Total Nursing (Weekend) Info Total number of nurse staff hours per resident per day on weekends. 3h 9m per day 3h 51m per day 3h 26m per day
Physical Therapist Info Physical therapist staff hours per resident per day. 2m per day 5m per day 4m per day
RN (Weekend) Info Registered nurse hours per resident per day on weekends. 18m per day 51m per day 29m per day

Capacity and availability

Medium-capacity home

Offers a balance of services and community atmosphere.

Total beds 180

This home usually has limited availability

Occupancy is moderate, suggesting balanced demand.

Similar demand to the Nevada average
Occupancy rate 90.6%
Residents per day (avg) 157
Occupancy rate
90.6%
Residents per day (avg)
157

Who this home usually serves

TYPE OF STAY

Mostly short-term rehab stays

Most residents typically stay for a few weeks or months before returning home or moving on.

Might be optimal for
Short stays Recovery Medicare-covered care

Breakdown by payment type

Medicare

41% of new residents, usually for short-term rehab.

Typical stay 23 days

Private pay

37% of new residents, often for short stays.

Typical stay 1 - 2 months

Medicaid

22% of new residents, often for long-term daily care.

Typical stay 7 - 8 months

Finances and operations

Privately-owned community
Home revenue
$32.7M
Profit
$25.5K
Privately-owned community
Home revenue
$32,704,517.00
Profit
$25,522.00
Payroll costs Info The portion of the home's budget spent on staff, including nurses, caregivers, and other employees who support care and operations.
$9.2M
28% of revenue
Other operating costs Info All remaining costs needed to run the home, such as food, utilities, building maintenance, supplies and administrative expenses.
$23.5M
Total costs $32.7M
Bed community size
180-bed community
A large-scale community that may provide a wide range of amenities, services, and structured programs.
Years in operation
7 years in operation
An established community with some operational experience and growing routines.
Walk Score
Walk Score: 46 / 100
Somewhat walkable. A few nearby services may be reachable on foot, but most trips require transportation.

About this community

Occupancy

Occupancy rate
91%
In line with Nevada average
Occupied beds
163 / 180
Average residents 92 per day

License details

Facility type
Facility For Skilled Nursing
Status Active
Issuance January 2, 2019
Expiration December 31, 2026

Additional licensing details

CMS Certification Number: 295077
Inspection Rating: 3 Star

Ownership & operating entity

Alta Skilled Nursing and Rehabilitation Center is administrated by CHRISTIAN MAGBITANG.

Type Of Units

Independent Living
0 units
Assisted Living Beds (Low Income) Units designated for residents who qualify for low-income assistance programs.
0 units
SNF (Skilled Nursing)
180 units
Total beds
180 units

Staffing

Key information about the people who lead and staff this community.

Leadership

Contact: Mr. Zachary Gray, Owner

Care Services

Nursing Services
Rehabilitation Services
Skilled Nursing

Programs & Activities

Specific Programs
Nursing Services, Dietary Services, Activities & Life Enrichment, Behavioral Health, Exercise & Rehabilitation, Post Discharge Plan
Operating Hours
Mo-Su: 24 hours
Contact Alta Skilled Nursing and Rehabilitation Center

Inspection History

In Nevada, the Department of Health and Human Services, Bureau of Health Care Quality and Compliance performs unannounced onsite surveys to evaluate resident safety and care quality.

33 visits/inspections

Nevada average: 21 inspections

Latest inspection

Date May 15, 2025

197 deficiencies

Deficiencies indicate regulatory issues. A higher number implies the facility had several areas requiring improvement.

Nevada average: 62 deficiencies

Health Inspection History

Inspections
Total health inspections 8

Nevada average 5.1


Last Health inspection on May 2025

Total health citations 70

Nevada average 36.2

Citations per inspection
8.75

Nevada average 7.08


Health citations are formal notices following inspections when they fail to comply with safety and care standards.

46 of 70 citations resulted from standard inspections; 22 of 70 resulted from complaint investigations; and 2 of 70 came from combined inspections (standard and complaint).

Breakdown of citation severity (last 3 years)
Critical Health citations More info 0
100% better than Nevada average

Nevada average: 0.1


Serious Health citations More info 1
100% worse than Nevada average

Nevada average: 0.5

0 critical citations More info Nevada average: 0.1

1 serious citation More info Nevada average: 0.5

69 moderate citations More info Nevada average: 35

0 minor citations More info Nevada average: 0.5
Citations history (last 3 years)
Administration moderate citation Info Issues related to how the facility is managed, including policies, procedures, and compliance with regulations. May 15, 2025
Corrected

Infection Control moderate citation Info Issues related to preventing and controlling infections, including hygiene practices and safety protocols. May 15, 2025
Corrected

Pharmacy moderate citation Info Issues related to medication management, including how drugs are stored, administered, and monitored. May 15, 2025
Corrected

Pharmacy moderate citation Info Issues related to medication management, including how drugs are stored, administered, and monitored. May 15, 2025
Corrected

Compare Nursing Homes around Reno The information below is reported by the Nevada Department of Health and Human Services, Bureau of Health Care Quality and Compliance.

2 facilities compared · CMS & NV Dept. of Health data · Updated Apr 2026

Filter by care type
Alta Skilled Nursing and Rehabilitation Center
NH

Nursing Home Licensed facility providing 24/7 skilled nursing care for residents with complex, ongoing medical needs. Staffed by RNs, LPNs, and CNAs. Inspected and star-rated annually by CMS. Accepts Medicare (short-term rehab) and Medicaid (long-term care).

AL

Assisted Living A licensed, long-term care setting for seniors or individuals with disabilities who need help with daily activities — like bathing, dressing, and medication management — but not 24-hour skilled nursing. Offers housing, meals, and around-the-clock support while aiming to maximize resident independence.

Reno
180
86.0%
+6%
3.80
-44%
-6%
2
70
8.8
1
157
46
Revive Health Senior Care Management Llc
$31.8M
$9.2M
28.8%
295077
Life Care Center of Reno
NH

Nursing Home Licensed facility providing 24/7 skilled nursing care for residents with complex, ongoing medical needs. Staffed by RNs, LPNs, and CNAs. Inspected and star-rated annually by CMS. Accepts Medicare (short-term rehab) and Medicaid (long-term care).

AL

Assisted Living A licensed, long-term care setting for seniors or individuals with disabilities who need help with daily activities — like bathing, dressing, and medication management — but not 24-hour skilled nursing. Offers housing, meals, and around-the-clock support while aiming to maximize resident independence.

Reno
198
57.7%
-29%
3.22
-7%
-20%
0
55
9.2
0
114
42
Rhodes, Matthew
$29.5M
$10.5M
35.6%
295050

Places of interest near Alta Skilled Nursing and Rehabilitation Center

Address 4.1 miles from city center — 0.09 miles to nearest hospital (Sierra Integrative Medical Center)
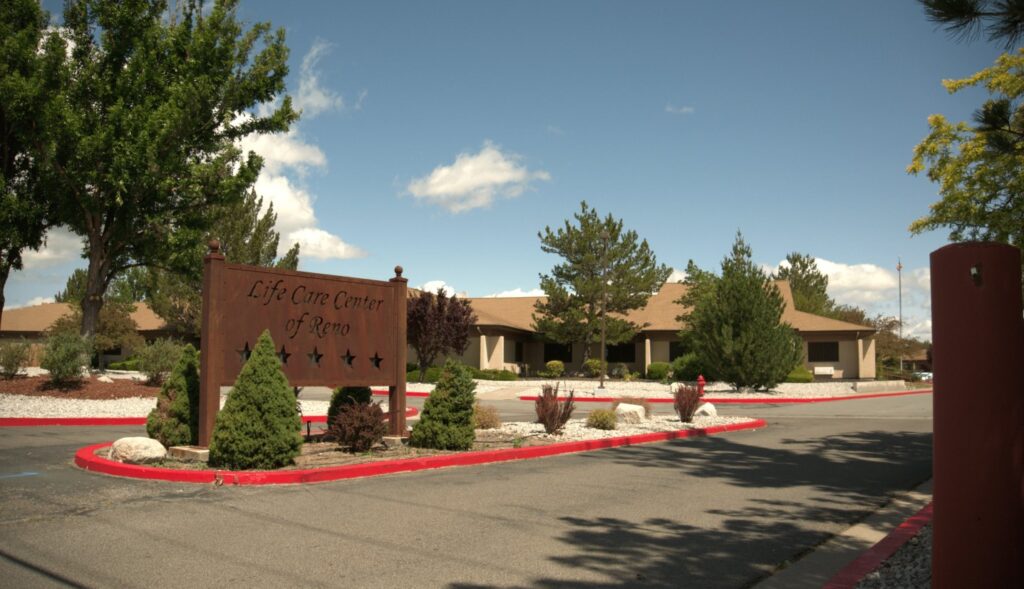
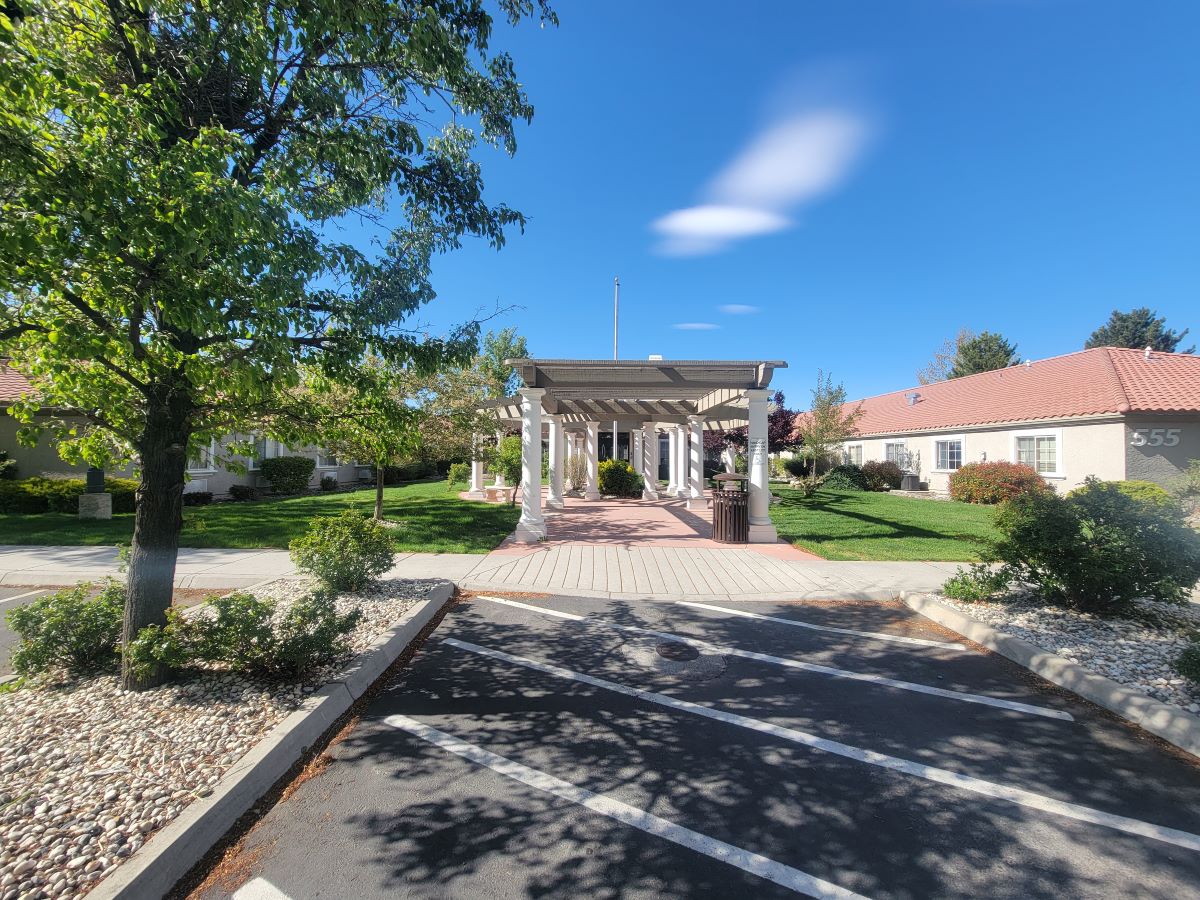
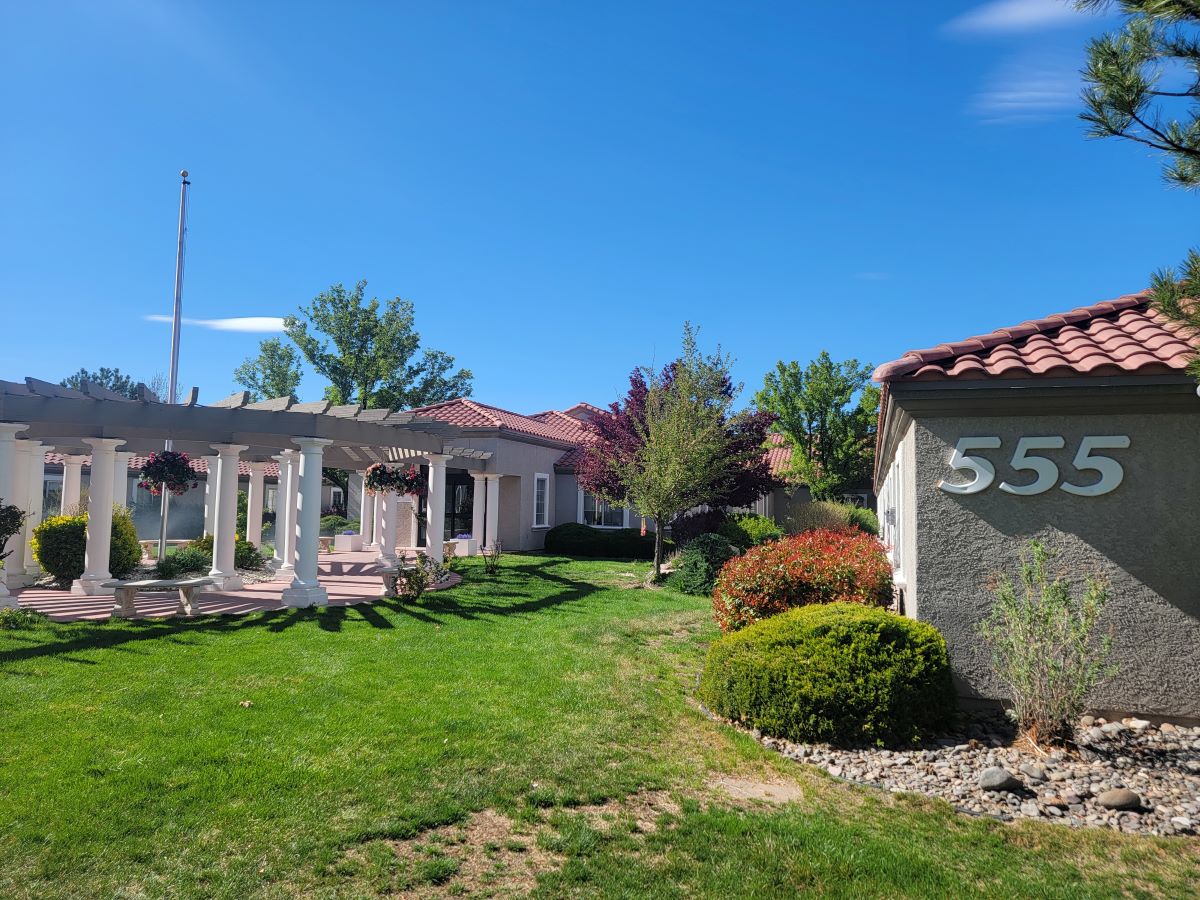
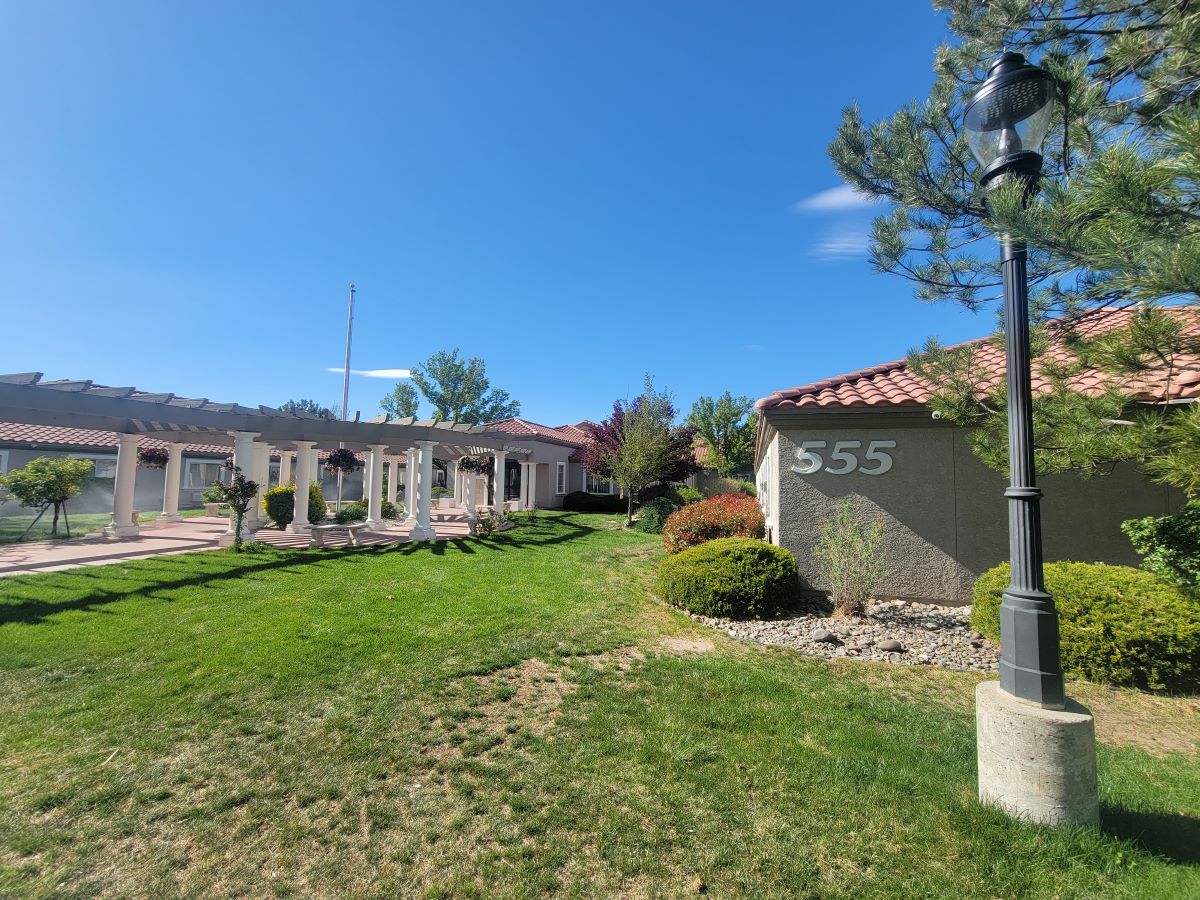
Address 555 Hammill Ln, Reno, NV 89511

Calculate Travel Distance to Alta Skilled Nursing and Rehabilitation Center

Add your location

Address

Staffing Data (Q2 2025)

This data corresponds to Q2 2025 and is based on CMS Payroll-Based Journal.

Total staff 176
Employees 172
Contractors 4
Staff to resident ratio 1.08:1
31% worse than Nevada average

Nevada average ratio: 1.57:1

Avg staff/day 77
Average shift 8.4 hours
5% worse than Nevada average

Nevada average: 8.8 hours

Total staff hours (quarter) 58,904
Nursing staff breakdown
Registered Nurse

Manages medical care and health needs.

Total count 14
Average shift length Info Average shift length. Calculated as total hours divided by days worked and average staff per day. 7.7 hours

No contractors work on this role.

Licensed Practical Nurse

Assists with medical care and medications.

Total count 36
Average shift length Info Average shift length. Calculated as total hours divided by days worked and average staff per day. 8.5 hours

No contractors work on this role.

Certified Nursing Assistant

Helps with daily care and mobility.

Total count 68
Average shift length Info Average shift length. Calculated as total hours divided by days worked and average staff per day. 8.9 hours

No contractors work on this role.

Contractor staffing

Total hours from contractors

1.1%

636 contractor hours this quarter

Physical Therapy Assistant: 1 Occupational Therapy Assistant: 1 Occupational Therapy Aide: 1 Medical Director: 1
Staff by category
Certified Nursing Assistant6806824,61691100%8.9
Licensed Practical Nurse3603613,89191100%8.5
Nurse Aide in Training310315,75191100%7.9
Registered Nurse140145,24891100%7.7
Mental Health Service Worker3031,4086470%8
Qualified Social Worker3031,3696673%7.9
Speech Language Pathologist5051,1618593%7.9
Other Dietary Services Staff2021,0039099%8
Physical Therapy Assistant2137837178%7.5
Dietitian1015386571%8.3
Qualified Activities Professional1015256976%7.6
Administrator1015126470%8
Nurse Practitioner1014886167%8
Dental Services Staff1014886167%8
Respiratory Therapy Technician1014796167%7.9
Physical Therapy Aide2023154549%7
Occupational Therapy Aide0112274651%4.9
Medical Director011521314%4
Occupational Therapy Assistant011521314%4
68 Certified Nursing Assistant
% of Days 100%
36 Licensed Practical Nurse
% of Days 100%
31 Nurse Aide in Training
% of Days 100%
14 Registered Nurse
% of Days 100%
3 Mental Health Service Worker
% of Days 70%
3 Qualified Social Worker
% of Days 73%
5 Speech Language Pathologist
% of Days 93%
2 Other Dietary Services Staff
% of Days 99%
3 Physical Therapy Assistant
% of Days 78%
1 Dietitian
% of Days 71%
1 Qualified Activities Professional
% of Days 76%
1 Administrator
% of Days 70%
1 Nurse Practitioner
% of Days 67%
1 Dental Services Staff
% of Days 67%
1 Respiratory Therapy Technician
% of Days 67%
2 Physical Therapy Aide
% of Days 49%
1 Occupational Therapy Aide
% of Days 51%
1 Medical Director
% of Days 14%
1 Occupational Therapy Assistant
% of Days 14%

Facility Characteristics

Source: CMS Long-Term Care Facility Characteristics (Data as of Jan 2026)

Total census
163 residents
Residents by payment source
Medicare
34 residents (20.9%)
Medicaid
105 residents (64.4%)
Private pay or other
24 residents (14.7%)
Programs & Services
Residents' Group

Residents meet regularly to discuss policies, care quality, and activities

Active Resident Council

Organized group of residents that meets regularly to discuss facility policies, quality of life, and activities.

Quality of care over time

These measures show how residents usually do over time at this home, based on health outcomes and preventive care.

High-risk clinical events score Info A composite score based on pressure ulcers, falls with injury, weight loss, walking ability decline, and activities of daily living decline. 15.8
63% worse than Nevada average

Nevada average: 9.7

Functional decline score Info A composite score based on activities of daily living decline, walking ability decline, and incontinence. 28.8
65% worse than Nevada average

Nevada average: 17.5

Long-stay resident measures
Significantly below average Nevada avg: 3.4 Info CMS star rating based on long-stay quality measure performance. 5 stars = significantly above average, 1 star = significantly below average.
Need for Help with Daily Activities Increased Info Percent of long-stay residents whose need for help with daily activities has increased 27.7%
78% worse than Nevada average

Nevada average: 15.6%

Walking Ability Worsened Info Percent of long-stay residents whose ability to move independently worsened 39.9%
92% worse than Nevada average

Nevada average: 20.8%

Low Risk Residents with Bowel/Bladder Incontinence Info Percent of low risk long-stay residents who lose control of their bowels or bladder 18.8%
11% worse than Nevada average

Nevada average: 16.9%

Falls with Major Injury Info Percent of long-stay residents experiencing one or more falls with major injury 2.9%
16% worse than Nevada average

Nevada average: 2.5%

High Risk Residents with Pressure Ulcers Info Percent of long-stay high risk residents with pressure ulcers 3.9%
29% better than Nevada average

Nevada average: 5.5%

Urinary Tract Infection Info Percent of long-stay residents with a urinary tract infection 3.2%
125% worse than Nevada average

Nevada average: 1.4%

Lost Too Much Weight Info Percent of long-stay residents who lose too much weight 4.6%
15% better than Nevada average

Nevada average: 5.4%

Depressive Symptoms Info Percent of long-stay residents who have depressive symptoms 5.0%
18% worse than Nevada average

Nevada average: 4.2%

Antipsychotic Use Info Percent of long-stay residents who received an antipsychotic medication 9.6%
32% better than Nevada average

Nevada average: 14.1%

Pneumococcal Vaccine Info Percent of long-stay residents assessed and appropriately given the pneumococcal vaccine 97.5%
7% better than Nevada average

Nevada average: 91.0%

Influenza Vaccine Info Percent of long-stay residents assessed and appropriately given the seasonal influenza vaccine 99.2%
11% better than Nevada average

Nevada average: 89.6%

Hospitalizations per 1,000 days Info Number of hospitalizations per 1,000 long-stay resident days. 2.57
41% worse than Nevada average

Nevada average: 1.82

ED visits per 1,000 days Info Number of outpatient emergency department visits per 1,000 long-stay resident days. 2.17
45% worse than Nevada average

Nevada average: 1.50

Short-stay resident measures
Below average Nevada avg: 3.1 Info CMS star rating based on short-stay quality measure performance. 5 stars = much above average, 1 star = much below average.
Pneumococcal Vaccine Info Percent of short-stay residents assessed and appropriately given the pneumococcal vaccine 98.6%
18% better than Nevada average

Nevada average: 83.9%

Antipsychotic medication increase Info Percent of short-stay residents who newly received an antipsychotic medication 2.3%
12% worse than Nevada average

Nevada average: 2.0%

Influenza Vaccine Info Percent of short-stay residents assessed and appropriately given the seasonal influenza vaccine 94.2%
17% better than Nevada average

Nevada average: 80.7%

Re-hospitalized after SNF stay Info Percentage of short-stay residents who were re-hospitalized after their nursing home admission. 29.1%
24% worse than Nevada average

Nevada average: 23.4%

Emergency department visits Info Percentage of short-stay residents who had an outpatient emergency department visit. 19.9%
103% worse than Nevada average

Nevada average: 9.8%

Falls with major injury Info Percentage of SNF residents who experience falls with major injury during their stay. 0.9%
22% worse than Nevada average

Nevada average: 0.8%

Ability to care for self at discharge Info Percentage of residents at or above expected ability to care for themselves at discharge. 61.8%
15% better than Nevada average

Nevada average: 53.7%

Successful return to home or community Info Rate of successful return to home or community from a skilled nursing facility. 51.6%
In line with Nevada average

Nevada average: 50.6%

Penalties and fines

Federal penalties imposed by CMS for regulatory violations, including civil money penalties (fines) and denials of payment for new Medicare/Medicaid admissions.

Source: CMS Penalties Database (Data as of Jan 2026)

Total fines amount $39K
15% higher than Nevada average

Nevada average: $34K

Number of fines 1
29% fewer fines than Nevada average

Nevada average: 1.4

Payment Denials Info Serious action where Medicare and/or Medicaid temporarily stops payments for new residents until issues are fixed. 0
100% fewer payment denials than Nevada average

Nevada average: 0.1

Fines amount comparison
This facility $39K
Nevada average $34K
Penalty History

Penalties are imposed by CMS for violations of federal nursing home regulations.

Civil Money Penalty Info Fines imposed for noncompliance, which can be assessed per day or per instance of violation. Jul 24, 2023
$39K

Last updated: Jan 2026

Guides for Better Senior Living

Care Cost Calculator: See Prices in Your Area

Nursing Home Data Explorer

Don’t Wait Too Long: 7 Red Flag Signs Your Parent Needs Assisted Living Now

The True Cost of Assisted Living in 2025 – And How Families Are Paying For It

Understanding Senior Living Costs: Pricing Models, Discounts & Financial Assistance

Financial Aid for Nevada Seniors

Get financial aid guidance

Home and Community Based Waiver

Nevada Medicaid HCBW

Age 65+ or disabled, Nevada resident, Medicaid-eligible, nursing home-level care need.

~$2,829/month (300% FBR, individual).

$2,000 (individual), $3,000 (couple).

High urban demand (e.g., Las Vegas); rural challenges.

Nevada Senior Services Program

NV SSP

Age 60+, Nevada resident, at risk of decline.

~$1,800/month (individual, varies).

$5,000 (individual).

Limited funding; rural focus.

Personal Care Services (PCS)

Nevada Personal Care Services

Age 19+ (65+ for seniors focus), Nevada resident, Medicaid-eligible, needs help with 1+ ADL.

~$967/month (individual); spenddown allowed.

$2,000 (individual), $3,000 (couple).

Self-directed (family can be paid); statewide via DHHS.

Senior Rx Program

Nevada Senior Rx Program

Age 65+, Nevada resident, enrolled in Medicare Part D, income below limit.

~$2,510/month (individual), ~$3,380/month (couple).

Not assessed.

Covers up to $38.75/month premium; funded by tobacco settlement.

Medicare Savings Program (MSP)

Nevada Medicare Savings Program

Age 65+ or disabled, Nevada resident, Medicare Part A/B.

~$2,510/month (QMB), ~$3,380/month (SLMB), ~$3,598/month (QI)—individual.

$9,430 (individual), $14,130 (couple).

Three tiers; no waitlist; includes Extra Help for Part D.

Nevada Caregiver Support Program (via NFCSP)

Nevada Caregiver Support Program

Caregivers of 60+ needing care or 55+ caregivers of others; Nevada resident; functional needs (2+ ADLs).

Prioritizes ~$24,980/year (individual); no strict cap.

Not assessed; need-based.

5 AAAs; prioritizes rural, low-income caregivers.

VA Aid and Attendance (A&A) and Housebound Benefits

Nevada VA Aid and Attendance/Housebound

Age 65+ or disabled veteran/spouse, Nevada resident, wartime service, need for ADL help (A&A) or homebound.

Net income < ~$1,984/month (veteran with dependent, A&A); pension offsets income.

~$155,356 (net worth limit).

High veteran demand in urban/rural areas.