


Total staff
153
Employees
127
Contractors
26
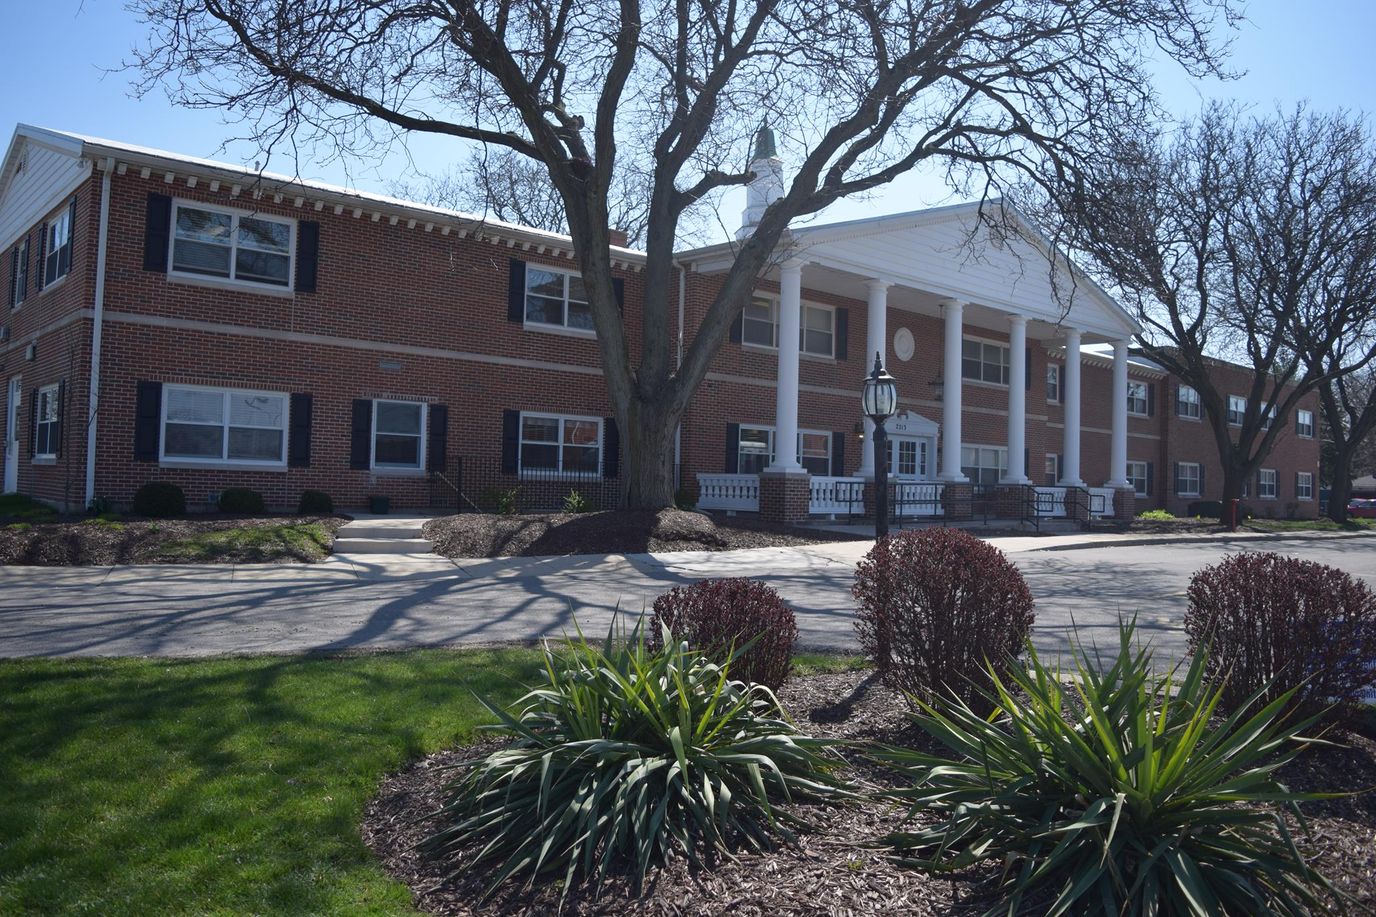
Occupying a 141-bed facility at 2313 N Rockton Ave in Rockford’s North Rockton neighborhood, Amberwood Care Centre operates under private ownership through the Todd Stern 2015 Trust. The nursing home serves a population dominated by Medicare short-term rehabilitation residents, averaging 12-day stays, though it retains a core of long-term Medicaid residents. Strong local demand is evident in the 86.1 percent occupancy rate, well above the state average.
Clinically, the data reveals two distinct patterns. Long-stay residents demonstrate robust outcomes: high-risk clinical event rates run 47 percent better than the Illinois average, and functional decline trails state performance by 37 percent. Neither cost nor recent enforcement constraints the record; no federal penalties appear in the past three years. Six named programs: Stroke, Pulmonary, Cardiac, and Orthopedic Rehabilitation, Palliative Care, and Hospice, anchor the rehabilitation capacity.
Registered nurses provide only 24 minutes of care per resident per day, a 45 percent shortfall versus the state average; weekend RN presence drops to 19 minutes. Total nurse hours of 2 hours 37 minutes per day (16 percent below state) rely heavily on nurse aide coverage, which runs 5 percent above average. This staffing model corresponds to measurable psychiatric outcomes: 28 percent of long-stay residents receive antipsychotics (38 percent worse than state average), and 69.9 percent report depressive symptoms; 45 percent worse than the Illinois average. Short-stay discharge success is compromised: only 36.6 percent of rehabilitation residents return home versus 50.6 percent statewide.
Resident amenities include pet therapy, gardens, full dining options, housekeeping, laundry service, and technology access (internet, tablets, laptops).
The current payer mix reflects 68.5 percent Medicaid residents, with 29 percent private pay.
Amberwood’s rehabilitation programs and strong long-stay clinical stability suit patients able to accommodate nursing-light operations and facilities prioritizing cost containment over in-hospital-level RN coverage.
| Staff type | Hours / Day / Resident | vs state avg |
|---|---|---|
|
Registered Nurse (RN)
| 24m per day | ▼ 45% State avg: 44m per day · National avg: 41m per day |
|
LPN / LVN
| 40m per day | ▲ 6% State avg: 38m per day · National avg: 52m per day |
|
Nurse Aide
| 2h 9m per day | ■ Avg State avg: 2h 8m per day · National avg: 2h 21m per day |
|
Weekend Total Nursing
| 2h 57m per day | ▼ 4% State avg: 3h 5m per day · National avg: 3h 26m per day |
|
Physical Therapist
| 3m per day | ▼ 13% State avg: 3m per day · National avg: 4m per day |
|
Weekend RN
| 21m per day | ▼ 38% State avg: 34m per day · National avg: 29m per day |
Reporting period: October 1 – December 31, 2025 (Q4 2025). Source: CMS Payroll-Based Journal report.
Manages medical care and health needs.
Assists with medical care and medications.
Helps with daily care and mobility.
Total hours from contractors
2,331 contractor hours this quarter
| Certified Nursing Assistant | 74 | 0 | 74 | 24,771 | 92 | 100% | 6.6 |
| Licensed Practical Nurse | 22 | 0 | 22 | 7,758 | 92 | 100% | 8.5 |
| Registered Nurse | 13 | 0 | 13 | 3,264 | 92 | 100% | 8 |
| Other Dietary Services Staff | 10 | 0 | 10 | 1,454 | 92 | 100% | 5.8 |
| Clinical Nurse Specialist | 2 | 0 | 2 | 944 | 64 | 70% | 8 |
| Speech Language Pathologist | 0 | 5 | 5 | 803 | 66 | 72% | 6.3 |
| Dental Services Staff | 2 | 0 | 2 | 716 | 67 | 73% | 6 |
| Respiratory Therapy Technician | 0 | 4 | 4 | 502 | 82 | 89% | 5 |
| Administrator | 1 | 0 | 1 | 488 | 61 | 66% | 8 |
| Dietitian | 1 | 0 | 1 | 488 | 61 | 66% | 8 |
| Nurse Practitioner | 1 | 0 | 1 | 448 | 56 | 61% | 8 |
| Qualified Social Worker | 0 | 3 | 3 | 378 | 53 | 58% | 6.7 |
| Physical Therapy Aide | 0 | 5 | 5 | 334 | 54 | 59% | 4.9 |
| Medical Director | 0 | 2 | 2 | 157 | 20 | 22% | 7.9 |
| Physical Therapy Assistant | 0 | 7 | 7 | 156 | 46 | 50% | 2.9 |
| Nurse Aide in Training | 1 | 0 | 1 | 15 | 2 | 2% | 7.5 |
Federal penalties imposed by CMS for regulatory violations, including civil money penalties (fines) and denials of payment for new Medicare/Medicaid admissions.
Source: CMS Penalties Database
No penalties in the past 3 years
No civil money penalties or payment denials were reported in the last 3 years.
These measures show how residents usually do over time at this home, based on health outcomes and preventive care.
Illinois average: 9.7
Illinois average: 18.6
Illinois average: 15.5%
Illinois average: 18.4%
Illinois average: 21.6%
Illinois average: 3.4%
Illinois average: 5.3%
Illinois average: 1.8%
Illinois average: 6.5%
Illinois average: 48.1%
Illinois average: 20.2%
Illinois average: 89.2%
Illinois average: 91.6%
Illinois average: 2.05
Illinois average: 2.25
Illinois average: 68.3%
Illinois average: 2.3%
Illinois average: 63.0%
Illinois average: 26.2%
Illinois average: 14.0%
Illinois average: 0.8%
Illinois average: 53.7%
Illinois average: 50.6%
Quality measures are calculated from Minimum Data Set (MDS) assessments. For most measures, lower percentages indicate better care quality.
69% of new residents, usually for short-term rehab.
28% of new residents, often for short stays.
3% of new residents, often for long-term daily care.
Source: CMS Long-Term Care Facility Characteristics (Data as of Jan 2026)
Residents meet regularly to discuss policies, care quality, and activities
Organized group of residents that meets regularly to discuss facility policies, quality of life, and activities.
Data sourced from CMS Long-Term Care Facility Characteristics quarterly report. Payer mix reflects the current resident census by primary payment source.
Historical financial and operational data for Amberwood Care Centre from 2011–2023, based on CMS SNF Cost Reports.
Key figures below are for fiscal year ending in 12/2023.
Based on CMS SNF Cost Report for fiscal year ending in 12/2023.
No pets allowed
Building Type: Two-story
Most residents typically stay for a few weeks or months before returning home or moving on.
Most new residents arrive under Medicare (69% of admissions), and a typical Medicare stay runs around 12 days.
Coverage residents most often arrive under.
Coverage residents most often leave under.
![]() 2.1 miles from city center
2.1 miles from city center
![]() Estimated distance in miles from Rockford's city center to Amberwood Care Centre's address, calculated via Google Maps.
— 2.45 miles to nearest hospital (UW Health SwedishAmerican Hospital)
Estimated distance in miles from Rockford's city center to Amberwood Care Centre's address, calculated via Google Maps.
— 2.45 miles to nearest hospital (UW Health SwedishAmerican Hospital)
Add your location
Info below is compiled from CMS reports & the IL Dept. of Public Health (IDPH), senior community websites & trusted data sources such as Walk Score & BBB.
Communities are listed from highest to lowest based on our ranking methodology.
| Amberwood Care Centre | NH HOS MC PC RC SNF | Rockford (North Rockton Avenue) | 135
Facility
135
IL AVG
85
Rank
#61 / 419 |
92.7%
Facility
92.7%
IL AVG
73
Rank
#21 / 157 | +27% | 2.61
Facility
2.61
IL AVG
3.10
Rank
#109 / 155 | -40% | -16% | $0
Facility
$0
IL AVG
$151.3k
Rank
#1 / 155 | 43
Facility
43
IL AVG
36.8
Rank
#108 / 155 | 3.1
Facility
3.1
IL AVG
3.7
Rank
#49 / 155 | - | 125 | - |
47
Facility
47
IL AVG
51
Rank
#356 / 648 | Todd Stern 2015 Trust | $12.8MFiscal year ending 12/2023
Facility
$12.8MFiscal year ending 12/2023
IL AVG
$12.2M
Rank
#85 / 154 | $6.8MFiscal year ending 12/2023
Facility
$6.8MFiscal year ending 12/2023
IL AVG
$4.8M
Rank
#82 / 154 | 53.2%Fiscal year ending 12/2023
Facility
53.2%Fiscal year ending 12/2023
IL AVG
44.3%
Rank
#71 / 154 | 145908 | ||||
| River Bluff Nursing Home | NH HOS MC PC SNF | Rockford (Ruby) | 304
Facility
304
IL AVG
85
Rank
#1 / 419 |
49.9%
Facility
49.9%
IL AVG
73
Rank
#141 / 157 | -32% | 4.13
Facility
4.13
IL AVG
3.10
Rank
#39 / 155 | -33% | +33% | $10.2k
Facility
$10.2k
IL AVG
$151.3k
Rank
#70 / 155 | 30
Facility
30
IL AVG
36.8
Rank
#73 / 155 | 3.0
Facility
3.0
IL AVG
3.7
Rank
#40 / 155 | 2 | 152 | - |
33
Facility
33
IL AVG
51
Rank
#470 / 648 | County Of Winnebago | $12.7MFiscal year ending 09/2023
Facility
$12.7MFiscal year ending 09/2023
IL AVG
$12.2M
Rank
#58 / 154 | $9.3MFiscal year ending 09/2023
Facility
$9.3MFiscal year ending 09/2023
IL AVG
$4.8M
Rank
#11 / 154 | 72.7%Fiscal year ending 09/2023
Facility
72.7%Fiscal year ending 09/2023
IL AVG
44.3%
Rank
#6 / 154 | 145771 | ||||
| Alden Park Strathmoor | NH HOS MC RC SNF | Rockford (Strathmoor Drive) | 189
Facility
189
IL AVG
85
Rank
#33 / 419 |
77.9%
Facility
77.9%
IL AVG
73
Rank
#76 / 157 | +7% | 2.48
Facility
2.48
IL AVG
3.10
Rank
#122 / 155 | +18% | -20% | $115.3k
Facility
$115.3k
IL AVG
$151.3k
Rank
#119 / 155 | 28
Facility
28
IL AVG
36.8
Rank
#65 / 155 | 3.5
Facility
3.5
IL AVG
3.7
Rank
#72 / 155 | 4 | 147 | - |
33
Facility
33
IL AVG
51
Rank
#470 / 648 | Nikolina Kuljanin | $14.9MFiscal year ending 12/2023
Facility
$14.9MFiscal year ending 12/2023
IL AVG
$12.2M
Rank
#78 / 154 | $6.9MFiscal year ending 12/2023
Facility
$6.9MFiscal year ending 12/2023
IL AVG
$4.8M
Rank
#85 / 154 | 46.5%Fiscal year ending 12/2023
Facility
46.5%Fiscal year ending 12/2023
IL AVG
44.3%
Rank
#82 / 154 | 145259 | ||||
| Citadel PA Peterson | NH HOS MC PC RC SNF | Rockford | 129
Facility
129
IL AVG
85
Rank
#68 / 419 |
96.1%
Facility
96.1%
IL AVG
73
Rank
#8 / 157 | +32% | 2.70
Facility
2.70
IL AVG
3.10
Rank
#98 / 155 | -24% | -13% | $21.2k
Facility
$21.2k
IL AVG
$151.3k
Rank
#80 / 155 | 63
Facility
63
IL AVG
36.8
Rank
#135 / 155 | 2.6
Facility
2.6
IL AVG
3.7
Rank
#25 / 155 | 4 | 124 | - |
31
Facility
31
IL AVG
51
Rank
#487 / 648 | - | $14.4MFiscal year ending 12/2023
Facility
$14.4MFiscal year ending 12/2023
IL AVG
$12.2M
Rank
#46 / 154 | $7.1MFiscal year ending 12/2023
Facility
$7.1MFiscal year ending 12/2023
IL AVG
$4.8M
Rank
#73 / 154 | 49.2%Fiscal year ending 12/2023
Facility
49.2%Fiscal year ending 12/2023
IL AVG
44.3%
Rank
#131 / 154 | 145751 | ||||
| Rock River Healthcare | NH HOS MC RC SNF | Rockford (West Riverside Boulevard) | 130
Facility
130
IL AVG
85
Rank
#67 / 419 |
56.9%
Facility
56.9%
IL AVG
73
Rank
#135 / 157 | -22% | 2.01
Facility
2.01
IL AVG
3.10
Rank
#144 / 155 | +9% | -35% | $72.3k
Facility
$72.3k
IL AVG
$151.3k
Rank
#112 / 155 | 44
Facility
44
IL AVG
36.8
Rank
#111 / 155 | 2.4
Facility
2.4
IL AVG
3.7
Rank
#20 / 155 | 4 | 74 | - |
60
Facility
60
IL AVG
51
Rank
#233 / 648 | Smf Healthcare LLC | $6.3MFiscal year ending 12/2023
Facility
$6.3MFiscal year ending 12/2023
IL AVG
$12.2M
Rank
#144 / 154 | $3.0MFiscal year ending 12/2023
Facility
$3.0MFiscal year ending 12/2023
IL AVG
$4.8M
Rank
#147 / 154 | 47.8%Fiscal year ending 12/2023
Facility
47.8%Fiscal year ending 12/2023
IL AVG
44.3%
Rank
#67 / 154 | 145818 |
Amberwood Care Centre is located in Rockford, Illinois.
Here are the financial assistance programs available to residents in Illinois.
Amberwood Care Centre is in the North Rockton Avenue neighborhood.
Amberwood Care Centre has a walk score of 47. Somewhat walkable. A few nearby services may be reachable on foot, but most trips require transportation.
Amberwood Care Centre's occupancy is 86.1%.
No, Amberwood Care Centre has a no-pet policy.
Amberwood Care Centre is registered as a for-profit.
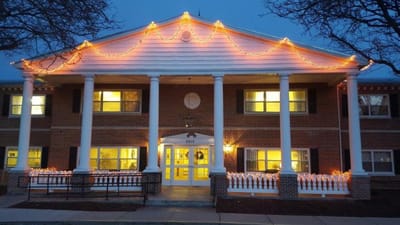
Yes — there are 3 photos of Amberwood Care Centre in the photo gallery on this page.
Amberwood Care Centre is located at 2313 N Rockton Ave, Rockford, IL 61103.
Care Cost Calculator: See Prices in Your Area
Nursing Home Data Explorer
Don’t Wait Too Long: 7 Red Flag Signs Your Parent Needs Assisted Living Now
The True Cost of Assisted Living in 2025 – And How Families Are Paying For It
Understanding Senior Living Costs: Pricing Models, Discounts & Financial Assistance


