Arden Care Center

Memory Care Home
Overview of Arden Care Center

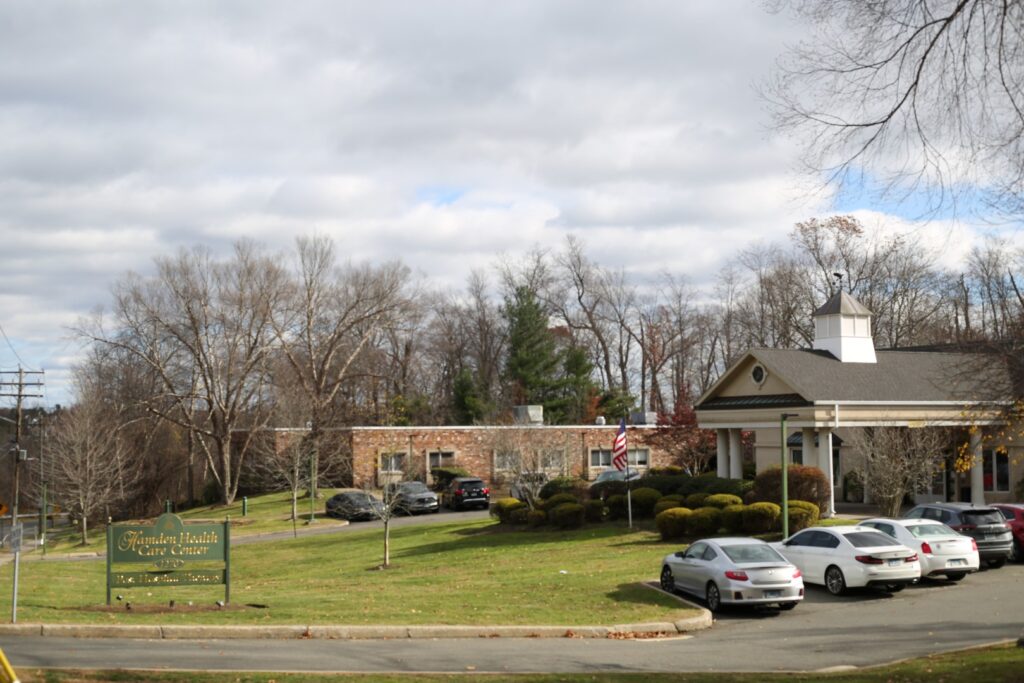
Arden Care Center is a comprehensive nursing home in Hamden, CT, offering skilled nursing and rehabilitation. The community also promotes a close-knit and supportive environment with its specially built suites and memory care units. Respite care, wound care, and palliative care are also offered to meet residents’ healthcare needs. Prioritizing residents’ dignity, the community provides the highest quality of care for their healthcare needs.

Recreational activities and social events allow residents to live actively and maintain social connections for leisure and wellness. Psychological support, pain management, and nutritional services are also provided to enrich residents’ living experiences. The community is also surrounded by bus stops, shops, and restaurants, ensuring accessibility and convenience. As one of the trusted choices for senior living in Connecticut, this nursing home continuously helps older adults live to their potential in retirement.

(718) 431-7770

Quality ratings

Measured by Centers for Medicare & Medicaid Services (CMS)

Overall rating Info Official CMS rating based on health inspections, staffing and quality measures.
1/5
Connecticut average: 3.0/5
Health Inspection Info Official CMS rating based on deficiencies found during state health inspections.
1/5
Connecticut average: 2.8/5
Staffing Info Official CMS rating based on nurse staffing hours per resident per day.
1/5
Connecticut average: 3.2/5
Quality Measures Info Official CMS rating based on clinical outcomes for residents.
4/5
Connecticut average: 3.5/5

Nursing care per resident

Info Average daily nursing hours per resident (adjusted for acuity). Higher values indicate more nursing time per resident.
3h 14m per day

This home provides 18% less nursing time per resident than the state average.

Connecticut average: 3h 58m per day

Staffing hours breakdown

Info Hours of care per resident per day, broken down by staff type. Data from CMS Medicare.
Staff type Facility State avg National avg
Registered Nurse (RN) Info Registered nurse hours per resident per day. 21m per day 42m per day 41m per day
LPN / LVN Info Licensed Practical Nurse / Licensed Vocational Nurse hours per resident per day. 59m per day 50m per day 52m per day
Nurse Aide Info Nurse aide hours per resident per day. 2h 26m per day 2h 17m per day 2h 21m per day
Total Nursing (Weekend) Info Total number of nurse staff hours per resident per day on weekends. 3h 31m per day 3h 25m per day 3h 26m per day
Physical Therapist Info Physical therapist staff hours per resident per day. 2m per day 5m per day 4m per day
RN (Weekend) Info Registered nurse hours per resident per day on weekends. 17m per day 28m per day 29m per day

Capacity and availability

High-capacity home

May provide extensive amenities, services and programs.

Total beds 267

This home usually has availability

Lower occupancy suggests more openings may be available.

Lower demand than the Connecticut average
Occupancy rate 79.6%
Residents per day (avg) 204
Occupancy rate
79.6%
Residents per day (avg)
204

Who this home usually serves

TYPE OF STAY

Mostly long-term care residents

Most residents stay for extended periods and receive ongoing daily care.

Might be optimal for
Long-term daily care Ongoing support needs

Breakdown by payment type

Medicare

19% of new residents, usually for short-term rehab.

Typical stay 1 - 2 months

Private pay

51% of new residents, often for short stays.

Typical stay 1 - 2 months

Medicaid

30% of new residents, often for long-term daily care.

Typical stay 1 - 2 years

Finances and operations

Proprietary home
Corporation
Home revenue
$41.2M
Operating loss
-$1.9M
Proprietary home Corporation
Home revenue
$41,238,701.00
Operating loss
$-1,897,055.00
Payroll costs Info The portion of the home's budget spent on staff, including nurses, caregivers, and other employees who support care and operations.
$10.8M
26.2% of revenue
Other operating costs Info All remaining costs needed to run the home, such as food, utilities, building maintenance, supplies and administrative expenses.
$32.3M
Total costs $43.1M
Years in operation
1 year in operation
A newer community that may feature more recent facilities and programs.
Walk Score
Walk Score: 66 / 100
Moderately walkable. Some errands can be accomplished on foot, with a mix of nearby amenities.

About this community

Occupancy Rate
82%
Occupied Beds
223 of 271
Percentage of available beds currently in use by residents.
License Status
Active
Facility Type
Chronic & Convalescent Nursing Home
License Date
June 6, 2024
License Expiration
March 31, 2026

Additional licensing details

License number: 2491

Staffing

Key information about the people who lead and staff this community.

Staff Composition (State Data)

Admin 3 FTE

What does this home offer?

Building type icon
Building type icon

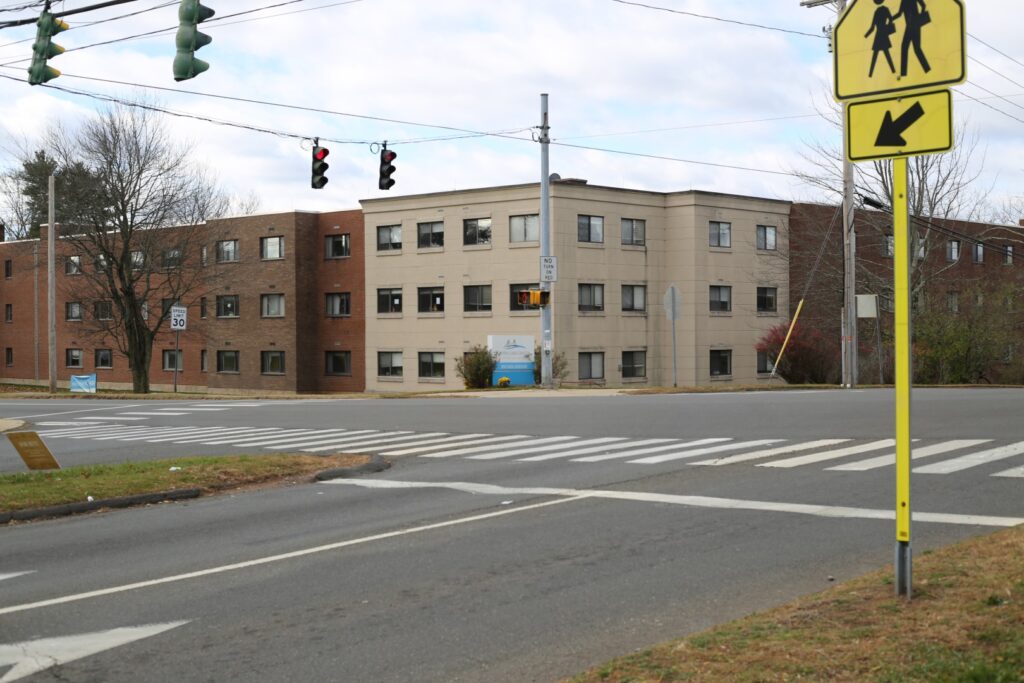
Building Type: Mid-rise

Dining services icon

Dining Services

Social and recreational activities icon

Social and Recreational Activities

Rehabilitative support icon

Rehabilitative Support

On-site medical care and health services icon

On-site Medical Care and Health Services

Types of Care at Arden Care Center

Nursing Home Memory Care
Contact Arden Care Center

Inspection History

In Connecticut, the Department of Public Health, Facility Licensing and Investigations Section conducts mandatory inspections and unannounced surveys to monitor the quality of care in long-term facilities.

16 visits/inspections

1 visits/inspections triggered by complaints

13 routine inspections

Breakdown by inspection type
  • 2 licensing inspections
  • 1 complaint investigation
  • 2 plans of correction

Results

2 with issues

0 without issues

Latest inspection

Date:November 21, 2025

Inspection history

01-16-2025 Inspection Report
02-04-2025 Inspection Report
02-24-2025 Inspection Report
02-28-2025 Inspection Report
03-07-2025 Plan of Correction
05-15-2025 Inspection Report
05-19-2025 Inspection Report
06-06-2025 Inspection Report
06-26-2024 Inspection Report
07-03-2024 Inspection Report
09-12-2024 Inspection Report
09-17-2025 Inspection Report
09-29-2025 Inspection Report
11-12-2025 Plan of Correction
11-20-2025 Inspection Report
11-21-2025 Inspection Report

16 deficiencies

Deficiencies indicate regulatory issues. A higher number implies the facility had several areas requiring improvement.

Compare Memory Care around Hamden

The information below is reported by the Connecticut Department of Public Health, Facility Licensing and Investigations Section.
Arden Care Center
MC

Memory Care Specialized care for those with Memory Loss, Alzheimer's, or dementia, ensuring safety and support.

SNF

Nursing Homes 24/7 care needed

Hamden
271
No
66
EGERT, USHER
79.6%
$41,144,048.00
$10,786,670.00
26.2%
204.10
1/5
3.2385
1/5
1/5
4/5
4
63
3
-56%
-18%
-5%
-
Hamden Health Care Center
MC

Memory Care Specialized care for those with Memory Loss, Alzheimer's, or dementia, ensuring safety and support.

SNF

Nursing Homes 24/7 care needed

Hamden
153
No
28
WCTHC LLC
78.5%
$24,517,630.00
$7,950,127.00
32.4%
134.50
2/5
4.2084
3/5
4/5
1/5
-
45
1
-49%
+6%
-7%
Private Rooms

Places of interest near Arden Care Center

Address 1.6 miles from city center

Address 850 Mix Ave., Hamden, CT 06514

Calculate Travel Distance to Arden Care Center

Add your location

Address

Staffing Data

Source: CMS Payroll-Based Journal (Q2 2025)

228
Total Staff
202
Employees
26
Contractors
75,049
Total Hours (Quarter)
106
Avg Staff/Day
7.8
Avg Shift (hrs)
Nursing Staff Breakdown
Role Count Avg Shift (hrs) Uses Contractors?
Registered Nurse117.5 No
Licensed Practical Nurse497.8 Yes
Certified Nursing Assistant1087.9 No
Staff by Category
Administration
2 staff
7.3hs shift avg
Nursing Staff
171 staff
7.9hs shift avg
Physicians & Practitioners
15 staff
7.8hs shift avg
Therapy Services
23 staff
7.6hs shift avg
Activities & Recreation
0 staff
0hs shift avg
Social Services
3 staff
7.2hs shift avg
Dietary Services
8 staff
7.2hs shift avg
Other Services
6 staff
7.2hs shift avg
Contractor Analysis
7%
of total hours from contractors
5,281 contractor hours this quarter
Qualified Social Worker: 3 Licensed Practical Nurse: 1 Respiratory Therapy Technician: 6 Physical Therapy Assistant: 6 Speech Language Pathologist: 5 Occupational Therapy Aide: 1 Physical Therapy Aide: 3 Medical Director: 1
Role Employees Contractors Total Staff Total Hours Days Worked % of Days Avg Shift (hrs)
Certified Nursing Assistant108010839,50691100%7.9
Licensed Practical Nurse4814916,00291100%7.8
Clinical Nurse Specialist140143,39591100%7.8
Registered Nurse110112,96291100%7.5
Other Dietary Services Staff7072,28991100%7.1
Mental Health Service Worker5052,0178695%7.1
Physical Therapy Assistant0661,1476875%7.5
Qualified Social Worker0331,1056875%7.2
Speech Language Pathologist0551,0176774%7.6
Respiratory Therapy Technician0668557178%7.6
Medication Aide/Technician2027176976%7
Nurse Aide in Training1016048695%7
Physical Therapy Aide0335846875%6.9
Occupational Therapy Aide1125286571%8
Administrator1014966268%8
Occupational Therapist1014886167%8
Nurse Practitioner1014806066%8
Dietitian1014605864%7.9
Dental Services Staff1013524651%7.6
Medical Director011471213%3.9

Health Inspection History

Inspections
Total health inspections 13

Connecticut average 5.7


Last Health inspection on Sep 2025

Total health citations 63
Citations per inspection
4.85

Health citations are formal notices following inspections when they fail to comply with safety and care standards.

32 of 63 citations resulted from standard inspections; and 31 of 63 resulted from complaint investigations.

Breakdown of citation severity (last 3 years)
Critical Health citations More info 2
567% worse than Connecticut average

Connecticut average: 0.3


Serious Health citations More info 1
43% worse than Connecticut average

Connecticut average: 0.7

2 critical citations More info Connecticut average: 0.3

1 serious citation More info Connecticut average: 0.7

59 moderate citations More info Connecticut average: 28.8

1 minor citation More info Connecticut average: 2.3
Citations history (last 3 years)
Quality of Care moderate citation Sep 29, 2025
Corrected

Abuse/Neglect moderate citation Aug 26, 2025
Corrected

Abuse/Neglect moderate citation Aug 26, 2025
Corrected

Resident Rights moderate citation Aug 26, 2025
Corrected

Facility Characteristics

Source: CMS Long-Term Care Facility Characteristics (Data as of Jan 2026)

Ownership: For-Profit LLC
Resident Census by Payment Source
194 Total Residents
Medicare 10 (5.2%)
Medicaid 155 (79.9%)
Private Pay/Other 29 (14.9%)
Programs & Services
Residents' Group
Family Engagement

Active councils help families stay involved in care decisions and facility operations.

Quality of care over time

These measures show how residents usually do over time at this home, based on health outcomes and preventive care.

High-risk clinical events score Info A composite score based on pressure ulcers, falls with injury, weight loss, walking ability decline, and activities of daily living decline. 11.4
9% worse than Connecticut average

Connecticut average: 10.4

Functional decline score Info A composite score based on activities of daily living decline, walking ability decline, and incontinence. 22.8
8% worse than Connecticut average

Connecticut average: 21.1

Long-stay resident measures
Need for Help with Daily Activities Increased Info Percent of long-stay residents whose need for help with daily activities has increased 20.3%
7% worse than Connecticut average

Connecticut average: 18.9%

Walking Ability Worsened Info Percent of long-stay residents whose ability to move independently worsened 20.1%
5% worse than Connecticut average

Connecticut average: 19.2%

Low Risk Residents with Bowel/Bladder Incontinence Info Percent of low risk long-stay residents who lose control of their bowels or bladder 28.1%
13% worse than Connecticut average

Connecticut average: 24.9%

Falls with Major Injury Info Percent of long-stay residents experiencing one or more falls with major injury 2.7%
23% better than Connecticut average

Connecticut average: 3.5%

High Risk Residents with Pressure Ulcers Info Percent of long-stay high risk residents with pressure ulcers 6.2%
34% worse than Connecticut average

Connecticut average: 4.6%

Urinary Tract Infection Info Percent of long-stay residents with a urinary tract infection 0.7%
58% better than Connecticut average

Connecticut average: 1.7%

Lost Too Much Weight Info Percent of long-stay residents who lose too much weight 7.7%
22% worse than Connecticut average

Connecticut average: 6.3%

Depressive Symptoms Info Percent of long-stay residents who have depressive symptoms 56.5%
273% worse than Connecticut average

Connecticut average: 15.2%

Antipsychotic Use Info Percent of long-stay residents who received an antipsychotic medication 19.3%
13% worse than Connecticut average

Connecticut average: 17.2%

Pneumococcal Vaccine Info Percent of long-stay residents assessed and appropriately given the pneumococcal vaccine 77.7%
11% worse than Connecticut average

Connecticut average: 87.5%

Influenza Vaccine Info Percent of long-stay residents assessed and appropriately given the seasonal influenza vaccine 92.7%
In line with Connecticut average

Connecticut average: 93.5%

Hospitalizations per 1,000 days Info Number of hospitalizations per 1,000 long-stay resident days. 3.33
59% worse than Connecticut average

Connecticut average: 2.10

ED visits per 1,000 days Info Number of outpatient emergency department visits per 1,000 long-stay resident days. 0.97
37% better than Connecticut average

Connecticut average: 1.53

Short-stay resident measures
Pneumococcal Vaccine Info Percent of short-stay residents assessed and appropriately given the pneumococcal vaccine 61.7%
12% worse than Connecticut average

Connecticut average: 70.1%

Antipsychotic medication increase Info Percent of short-stay residents who newly received an antipsychotic medication 0.0%
100% better than Connecticut average

Connecticut average: 1.5%

Influenza Vaccine Info Percent of short-stay residents assessed and appropriately given the seasonal influenza vaccine 59.8%
14% worse than Connecticut average

Connecticut average: 69.8%

Re-hospitalized after SNF stay Info Percentage of short-stay residents who were re-hospitalized after their nursing home admission. 28.3%
13% worse than Connecticut average

Connecticut average: 25.0%

Emergency department visits Info Percentage of short-stay residents who had an outpatient emergency department visit. 4.9%
56% better than Connecticut average

Connecticut average: 11.1%

Falls with major injury Info Percentage of SNF residents who experience falls with major injury during their stay. 2.7%
247% worse than Connecticut average

Connecticut average: 0.8%

Ability to care for self at discharge Info Percentage of residents at or above expected ability to care for themselves at discharge. 47.8%
11% worse than Connecticut average

Connecticut average: 53.7%

Successful return to home or community Info Rate of successful return to home or community from a skilled nursing facility. 52.2%
In line with Connecticut average

Connecticut average: 50.6%

Penalties and fines

Federal penalties imposed by CMS for regulatory violations, including civil money penalties (fines) and denials of payment for new Medicare/Medicaid admissions.

Source: CMS Penalties Database (Data as of Jan 2026)

Total fines amount $111K
153% higher than Connecticut average

Connecticut average: $44K

Number of fines 4
129% more fines than Connecticut average

Connecticut average: 1.7

Payment Denials Info Serious action where Medicare and/or Medicaid temporarily stops payments for new residents until issues are fixed. 0
100% fewer payment denials than Connecticut average

Connecticut average: 0.1

Fines amount comparison
This facility $111K
Connecticut average $44K
Penalty History

Penalties are imposed by CMS for violations of federal nursing home regulations.

Civil Money Penalty Info Fines imposed for noncompliance, which can be assessed per day or per instance of violation. Feb 28, 2024
$16K
Civil Money Penalty Info Fines imposed for noncompliance, which can be assessed per day or per instance of violation. Oct 19, 2023
$72K
Civil Money Penalty Info Fines imposed for noncompliance, which can be assessed per day or per instance of violation. Jul 25, 2023
$13K
Civil Money Penalty Info Fines imposed for noncompliance, which can be assessed per day or per instance of violation. May 17, 2023
$9K

Last updated: Jan 2026

Guides for Better Senior Living

Care Cost Calculator: See Prices in Your Area

Nursing Home Data Explorer

Don’t Wait Too Long: 7 Red Flag Signs Your Parent Needs Assisted Living Now

The True Cost of Assisted Living in 2025 – And How Families Are Paying For It

Understanding Senior Living Costs: Pricing Models, Discounts & Financial Assistance

Financial Aid for Connecticut Seniors

Get financial aid guidance

Connecticut Home Care Program for Elders

CHCPE

Age 65+, Connecticut resident, at risk of nursing home placement.

State-funded: ~$1,600/month; Medicaid: ~$2,829/month (300% FBR).

$1,600 (state), $2,000 (Medicaid, individual).

Two tiers (state and Medicaid); waitlists possible.

Statewide Respite Care Program

CT Respite Care

Caregiver of senior with dementia, Connecticut resident.

~$2,500/month (individual, varies).

$40,000 (individual).

Limited to dementia caregivers; capped funding.

Congregate Housing Services Program (CHSP)

Connecticut Congregate Housing Services Program

Age 62+, Connecticut resident, frail but not needing 24/7 care, resides in CHSP-eligible housing.

~$41,000/year (individual, adjusted annually).

Not specified; focus is income-based.

Limited to 14 state-subsidized sites; participants pay 10% of service costs.

Medicare Savings Program (MSP)

Connecticut Medicare Savings Program

Age 65+ or disabled, Connecticut resident, enrolled in Medicare Part A/B.

~$2,510/month (individual, QMB); ~$3,380/month (SLMB); ~$3,598/month (ALMB)—adjusted annually.

None since 2023 policy change.

Three tiers (Qualified Medicare Beneficiary, Specified Low-Income, Additional Low-Income); no asset test.

Senior Community Service Employment Program (SCSEP)

Connecticut SCSEP (federally funded, state-administered)

Age 55+, unemployed, low-income, Connecticut resident.

~$1,983/month (125% FPL, individual).

Not specified; income-focused.

Priority for veterans, rural residents; limited slots (~500/year).

Who we are

Your Senior Care Partner, Every Step of the Way

We help families find affordable senior communities and unlock same day discounts, Medicaid, and Medicare options tailored to your needs.

Contact us Today
Tour Icon
Planning a tour? Check our touring checklist.
Chat Icon
Thinking of living here? We can help you speak to a current resident