Hamden Health Care Center
Nursing Home & Memory Care · Connecticut, CT
CMS overall rating Info The Overall CMS Rating is scored from 1 to 5 stars and combines results from health inspections, staffing levels, and quality measures. Health inspections carry the most weight. Staffing and quality scores can increase or decrease the final rating based on performance compared to state and national standards.

Hamden Health Care Center

Nursing Home & Memory Care · Connecticut, CT
CMS overall rating Info The Overall CMS Rating is scored from 1 to 5 stars and combines results from health inspections, staffing levels, and quality measures. Health inspections carry the most weight. Staffing and quality scores can increase or decrease the final rating based on performance compared to state and national standards.
Calculator: See prices in your area
Hamden Health Care Center accepts Medicare, Medicaid, and private pay.

Overview of Hamden Health Care Center

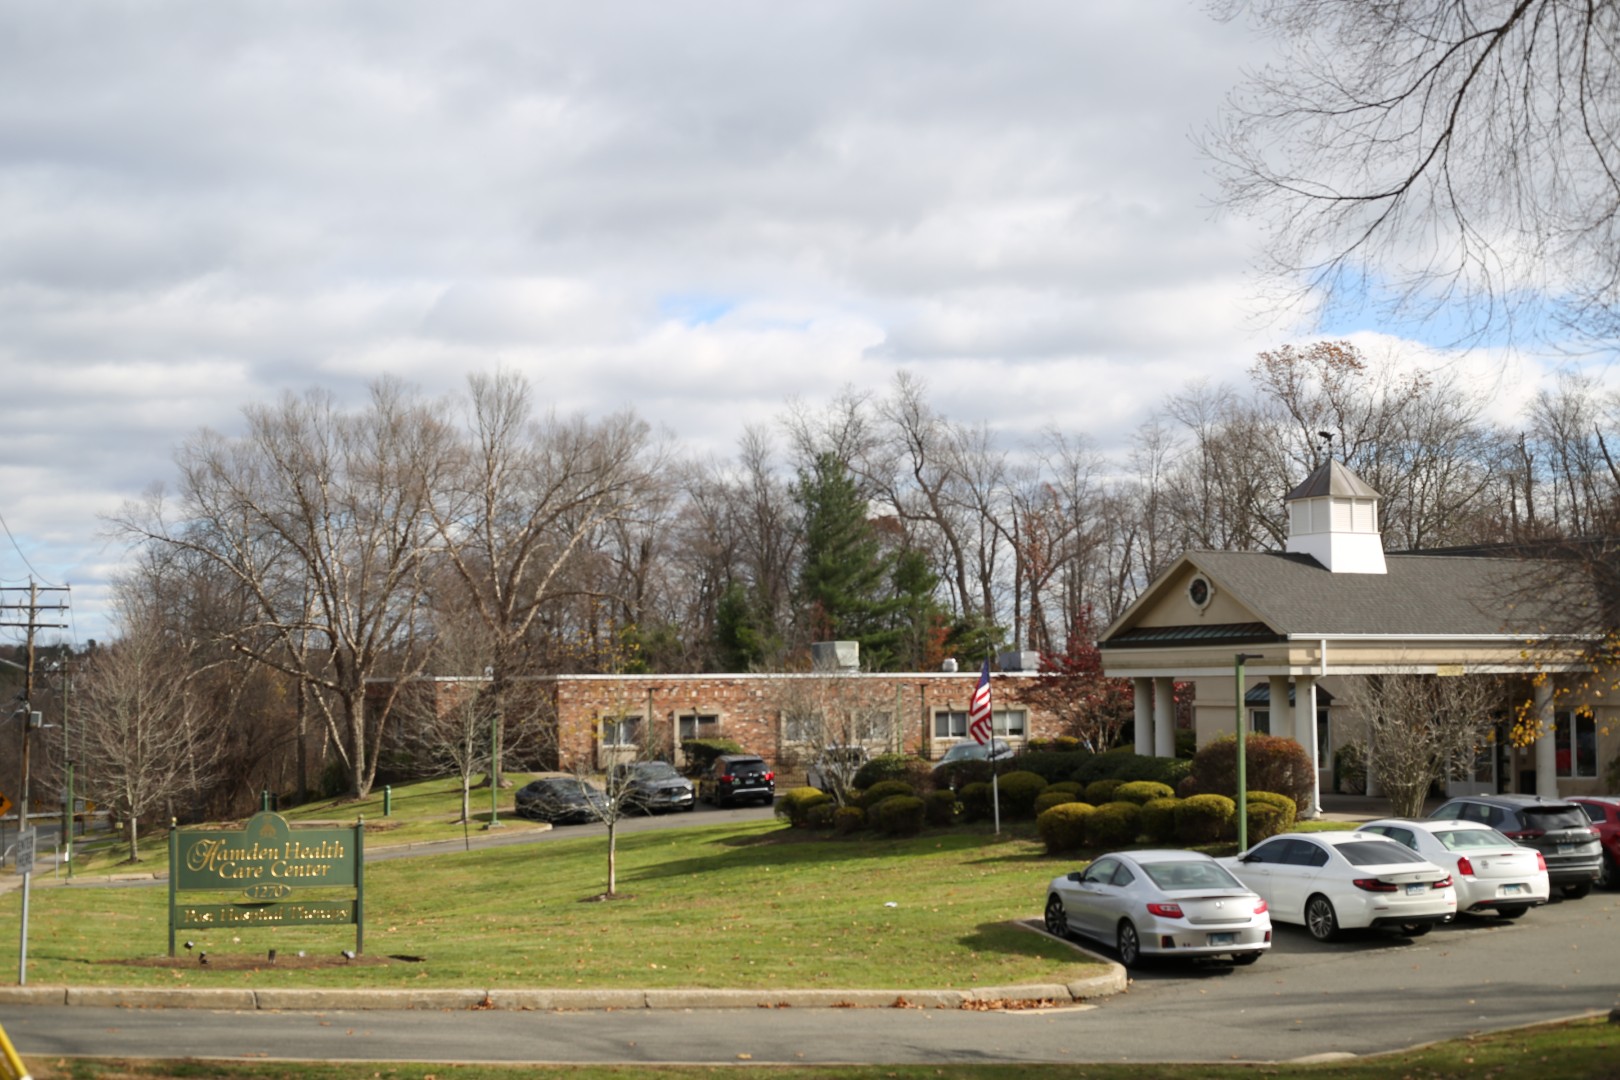
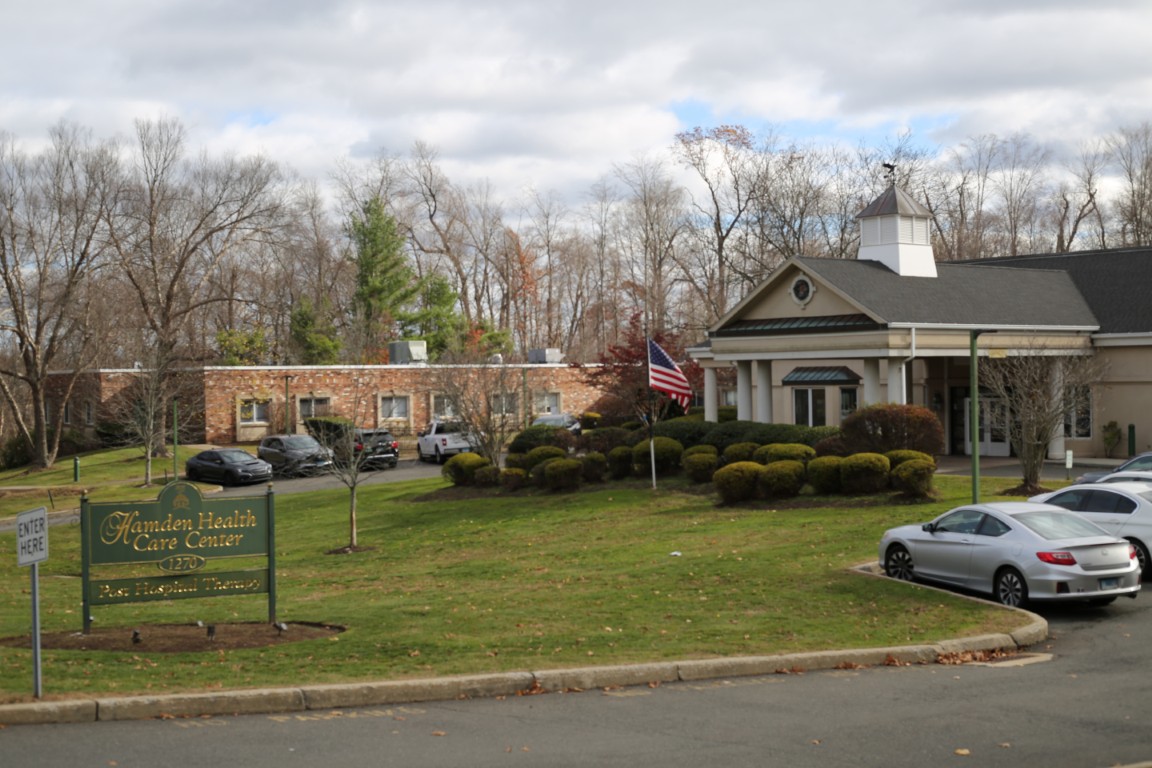
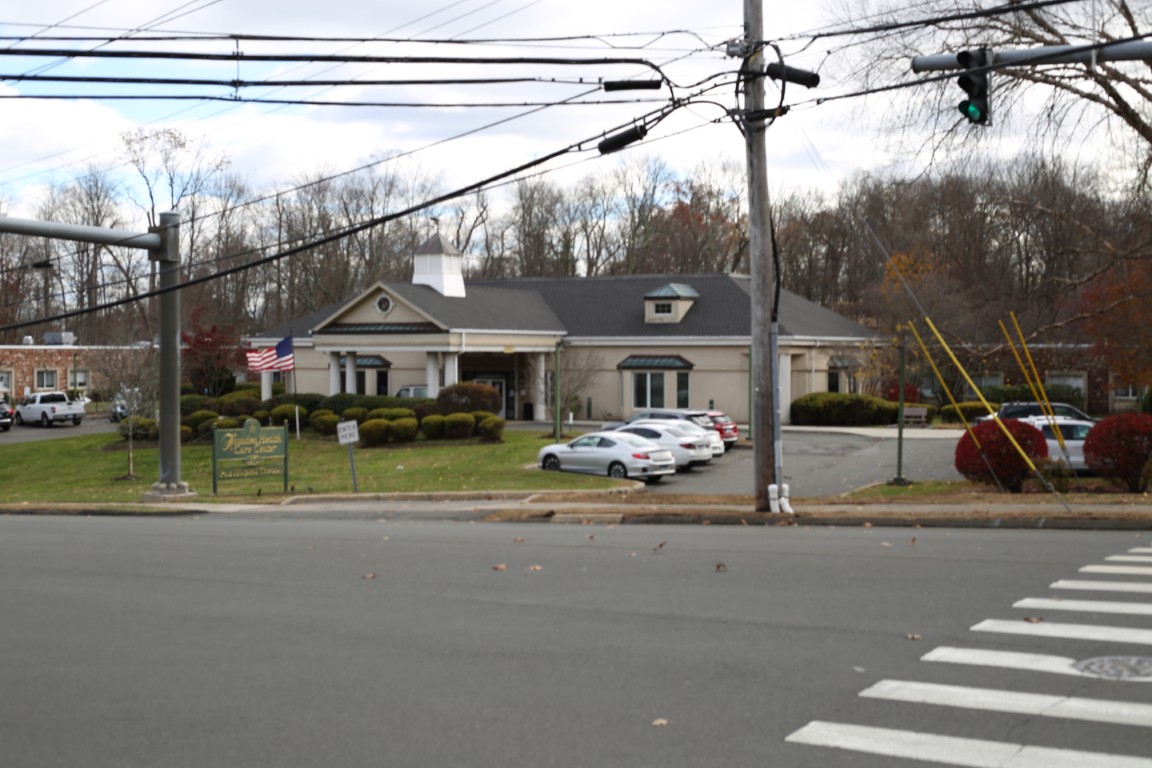
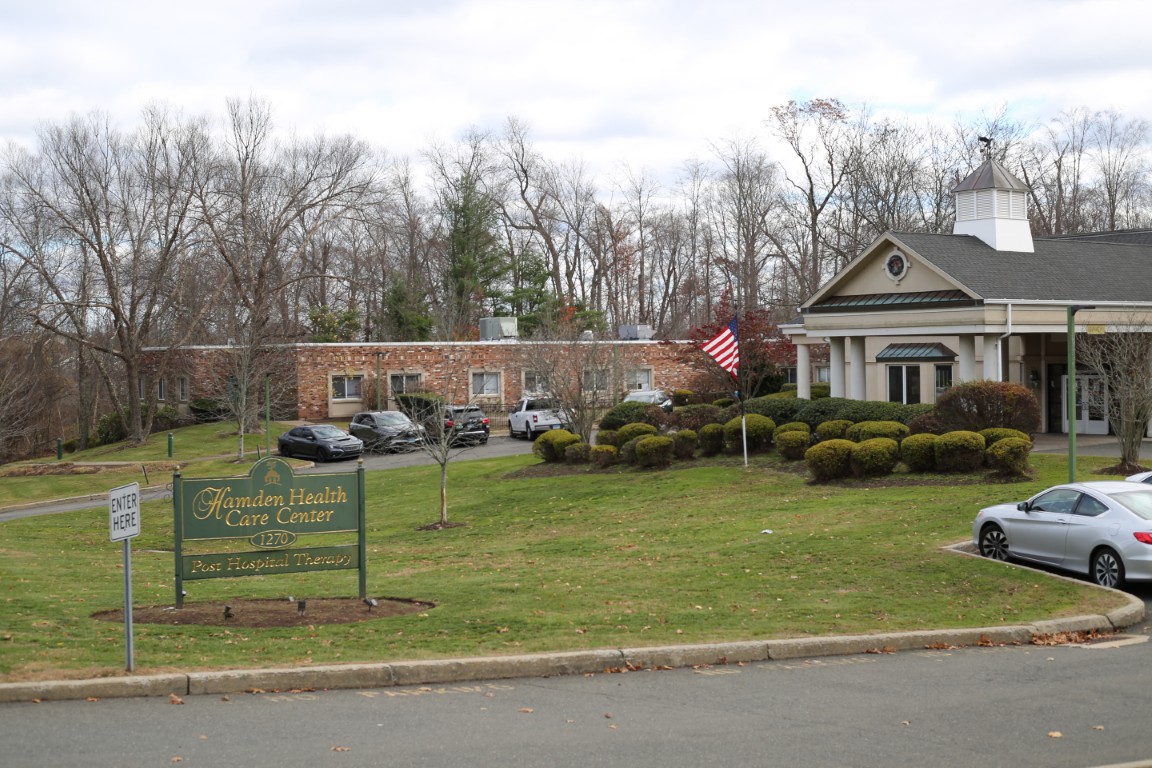
Hamden Health Care Center is a highly recognized nursing home in Hamden, CT, that offers long-term care and short-term rehabilitation. The community can accommodate up to 153 older adults with its home-like environment. Memory care, respite care, and healthy meals are also offered to enrich residents’ living experiences. With its holistic approach to care, the community ensures residents are well-cared for.

Memory-related activities, pet therapy, and cooking classes, are among the life-enhancement programs provided for residents’ leisure and wellness. Cozy patios and park-like grounds also ensure residents can keep their peace of mind. YNHH Outpatient Pharmacy Services, as well as bus stops, are located nearby, ensuring accessibility and convenience. This nursing home is a great choice for older adults in Connecticut, as it has a wide range of care options and state-of-the-art amenities.

Quality ratings

Measured by Centers for Medicare & Medicaid Services (CMS)

Overall rating Info The Overall CMS Rating combines results from health inspections, staffing levels and quality measures. Health inspections carry the most weight. Staffing and quality scores can increase or decrease the final rating based on performance compared to state and national standards.
▼ 34.2% Below CT avg. ▼ 34.2% Below CT avg.Click the badge to see the full State ranking.Click here to see the full State ranking.
Health Inspection Info Based on the results of the facility's three most recent standard inspections and any complaint investigations. CMS reviews the number, scope, and severity of deficiencies, with more recent findings weighted more heavily.
▲ 7.3% Above CT avg. ▲ 7.3% Above CT avg.Click the badge to see the full State ranking.Click here to see the full State ranking.
Staffing Info Measures average nursing staff hours per resident per day, including Registered Nurses (RNs) and total nursing staff. Ratings are adjusted based on the level of care residents require and are compared to state and national benchmarks.
▲ 23.3% Above CT avg. ▲ 23.3% Above CT avg.Click the badge to see the full State ranking.Click here to see the full State ranking.
Quality Measures Info Based on clinical and physical health indicators reported to CMS, such as hospital readmissions, falls, pressure ulcers, and improvements in mobility. These measures reflect how well residents' health needs are being managed.
▼ 71.6% Below CT avg. ▼ 71.6% Below CT avg.Click the badge to see the full State ranking.Click here to see the full State ranking.

Staffing hours breakdown

Info Daily nursing hours per resident by staff type, reported to CMS. Higher is generally better — compare this facility to state and national averages to see where staffing stands.

Hours per resident per day — compared to Connecticut state averages

Total nursing care / resident Info This home is ranked 21st out of 66 homes in Connecticut. Total adjusted nursing hours per resident per day, combining RN, LPN, and aide time. CMS adjusts this for case-mix so facilities can be fairly compared.
4h 13m per day
Rank #21 / 66Nurse hours — State benchmarkedThis home is ranked 21st out of 66 homes in Connecticut. Shows adjusted nurse hours per resident per day benchmarked to the Connecticut average, with a ranking across 66 Connecticut SNFs. More hours mean more direct care. The national average is about 3.5 hrs; below 3.0 is a red flag.Click the rank badge to see the full State ranking.Click here to see the full State ranking.
This facility Connecticut avg (3h 58m per day)
vs Connecticut avg
+6%

3 of 6 metrics below state avg

Standout metric LPN / LVN is +40% above state avg
Staff type Hours / Day / Resident vs state avg
Registered Nurse (RN) Info RNs hold the highest nursing license and can assess residents, interpret test results, and direct care plans. More RN hours per day often signals stronger clinical oversight and faster response to health changes. 25m per day ▼ 40% State avg: 42m per day · National avg: 41m per day
LPN / LVN Info Licensed Practical Nurses (LPNs) or Licensed Vocational Nurses (LVNs) deliver routine hands-on care — medication administration, wound dressing, and monitoring vital signs. They work under RN supervision and make up a large share of daily bedside care. 1h 10m per day ▲ 40% State avg: 50m per day · National avg: 52m per day
Nurse Aide Info Certified Nurse Aides (CNAs) provide the most direct day-to-day assistance: bathing, dressing, feeding, and mobility. Nurse aide hours are typically the largest staffing category and directly affect residents' quality of life. 2h 28m per day ▲ 8% State avg: 2h 17m per day · National avg: 2h 21m per day
Weekend Total Nursing Info Combined nursing hours (RN + LPN + Nurse Aide) per resident per day on weekends. Staffing often drops on weekends — this figure reveals whether the facility maintains adequate coverage outside of weekday hours. 3h 30m per day ■ Avg State avg: 3h 25m per day · National avg: 3h 26m per day
Physical Therapist Info Hours per resident per day provided by licensed Physical Therapists (PTs) or PT Assistants. PT services help residents recover mobility after injury or illness and are especially important for post-acute (short-stay) rehabilitation. 3m per day ▼ 40% State avg: 5m per day · National avg: 4m per day
Weekend RN Info Registered nurse hours specifically on weekends. Facilities sometimes reduce RN presence on Saturdays and Sundays — a low weekend RN figure compared to weekday hours can indicate reduced clinical oversight when most administrative staff are absent. 14m per day ▼ 50% State avg: 28m per day · National avg: 29m per day

Types of Care at Hamden Health Care Center

Nursing Home Memory Care

Capacity and availability

This home usually has availability

Occupancy lower than 85% suggests more openings may be available.

Lower occupancy than the Connecticut average: 84%
Occupancy rate 78.5% Rank #56 / 71Occupancy rate — State benchmarkedThis home is ranked 56th out of 71 homes in Connecticut. Shows this facility's occupancy rate versus the Connecticut average, with its Statewide rank out of 71. Higher occupancy signals strong local demand and financial stability.Click the rank badge to see the full State ranking.Click here to see the full State ranking.
Avg. Length of Stay 167 days
Occupancy rate
78.5% Rank #56 / 71Occupancy rate — State benchmarkedThis home is ranked 56th out of 71 homes in Connecticut. Shows this facility's occupancy rate versus the Connecticut average, with its Statewide rank out of 71. Higher occupancy signals strong local demand and financial stability.Click the rank badge to see the full State ranking.Click here to see the full State ranking.
Avg. Length of Stay
167 days
Walk Score
Walk Score: 28 / 100 Rank #196 / 266Walk Score — State benchmarkedThis home is ranked 196th out of 266 homes in Connecticut. Shows how walkable this facility's neighborhood is compared to the average Walk Score across Connecticut SNFs. Higher scores benefit residents, families, and staff.Click the rank badge to see the full State ranking.Click here to see the full State ranking.
Somewhat walkable. A few nearby services may be reachable on foot, but most trips require transportation.

Contact Hamden Health Care Center

Staffing Data

Reporting period: October 1 – December 31, 2025 (Q4 2025). Source: CMS Payroll-Based Journal report.

Total staff 185
Employees 163
Contractors 22
Staff to resident ratio 1.31:1
30% worse than Connecticut average
Connecticut average ratio: 1.86:1 Connecticut average ratio: 1.86:1See full Connecticut ranking
Avg staff/day 86
Average shift 7.5 hours
0% compared with Connecticut average
Connecticut average: 7.5 hours Connecticut average shift: 7.5 hoursSee full Connecticut ranking
Total staff hours (quarter) 59,229

Nursing staff breakdown

Q4 2025 · Oct 1 – Dec 31 More info This data comes from the CMS Payroll-Based Journal report covering October 1 – December 31, 2025.
Registered Nurse

Manages medical care and health needs.

RN Staff 16
Average shift length Info Average shift length. Calculated as total hours divided by days worked and average staff per day. 7.7 hours

No contractors work on this role.

Licensed Practical Nurse

Assists with medical care and medications.

LPN Staff 35
Average shift length Info Average shift length. Calculated as total hours divided by days worked and average staff per day. 7.7 hours

No contractors work on this role.

Certified Nursing Assistant

Helps with daily care and mobility.

CNA Staff 88
Average shift length Info Average shift length. Calculated as total hours divided by days worked and average staff per day. 7.6 hours

No contractors work on this role.

Contractor staffing

Q4 2025 · Oct 1 – Dec 31 More info This data comes from the CMS Payroll-Based Journal report covering October 1 – December 31, 2025.

Total hours from contractors

5.9%

3,500 contractor hours this quarter

Physical Therapy Assistant: 6 Occupational Therapy Assistant: 4 Respiratory Therapy Technician: 3 Qualified Social Worker: 3 Physical Therapy Aide: 3 Speech Language Pathologist: 2 Medical Director: 1

Staff by category

Q4 2025 · Oct 1 – Dec 31 More info This data comes from the CMS Payroll-Based Journal report covering October 1 – December 31, 2025.
Certified Nursing Assistant 88 0 88 30,842 92 100% 7.6
Licensed Practical Nurse 35 0 35 12,936 92 100% 7.7
Registered Nurse 16 0 16 3,424 92 100% 7.7
Other Dietary Services Staff 6 0 6 2,304 91 99% 7.4
RN Director of Nursing 4 0 4 1,256 72 78% 7.7
Clinical Nurse Specialist 4 0 4 1,160 65 71% 6.7
Physical Therapy Assistant 0 6 6 984 77 84% 7.5
Mental Health Service Worker 3 0 3 982 65 71% 7.3
Speech Language Pathologist 0 2 2 976 70 76% 7.6
Administrator 2 0 2 960 64 70% 7.5
Respiratory Therapy Technician 0 3 3 525 78 85% 6.5
Nurse Practitioner 2 0 2 480 64 70% 7.5
Dental Services Staff 1 0 1 480 64 70% 7.5
Occupational Therapy Aide 1 0 1 462 62 67% 7.4
Dietitian 1 0 1 443 59 64% 7.5
Qualified Social Worker 0 3 3 437 68 74% 6.2
Physical Therapy Aide 0 3 3 437 64 70% 6.8
Occupational Therapy Assistant 0 4 4 87 31 34% 2.4
Medical Director 0 1 1 56 33 36% 1.7
88 Certified Nursing Assistant
% of Days 100%
35 Licensed Practical Nurse
% of Days 100%
16 Registered Nurse
% of Days 100%
6 Other Dietary Services Staff
% of Days 99%
4 RN Director of Nursing
% of Days 78%
4 Clinical Nurse Specialist
% of Days 71%
6 Physical Therapy Assistant
% of Days 84%
3 Mental Health Service Worker
% of Days 71%
2 Speech Language Pathologist
% of Days 76%
2 Administrator
% of Days 70%
3 Respiratory Therapy Technician
% of Days 85%
2 Nurse Practitioner
% of Days 70%
1 Dental Services Staff
% of Days 70%
1 Occupational Therapy Aide
% of Days 67%
1 Dietitian
% of Days 64%
3 Qualified Social Worker
% of Days 74%
3 Physical Therapy Aide
% of Days 70%
4 Occupational Therapy Assistant
% of Days 34%
1 Medical Director
% of Days 36%

Penalties and fines

Federal penalties imposed by CMS for regulatory violations, including civil money penalties (fines) and denials of payment for new Medicare/Medicaid admissions.

Source: CMS Penalties Database

No penalties in the past 3 years

No civil money penalties or payment denials were reported in the last 3 years.

Quality of care over time

These measures show how residents usually do over time at this home, based on health outcomes and preventive care.

High-risk clinical events score Info A composite score based on pressure ulcers, falls with injury, weight loss, walking ability decline, and activities of daily living decline. 13.0
25% worse than Connecticut average

Connecticut average: 10.4

Functional decline score Info A composite score based on activities of daily living decline, walking ability decline, and incontinence. 22.4
6% worse than Connecticut average

Connecticut average: 21.1

Long-stay resident measures
Significantly below average Connecticut avg: 3.4 Info CMS star rating based on long-stay quality measure performance. 5 stars = significantly above average, 1 star = significantly below average.
Need for Help with Daily Activities Increased Info Percent of long-stay residents whose need for help with daily activities has increased 25.4%
34% worse than Connecticut average

Connecticut average: 18.9%

Walking Ability Worsened Info Percent of long-stay residents whose ability to move independently worsened 25.9%
35% worse than Connecticut average

Connecticut average: 19.2%

Low Risk Residents with Bowel/Bladder Incontinence Info Percent of low risk long-stay residents who lose control of their bowels or bladder 15.8%
36% better than Connecticut average

Connecticut average: 24.9%

Falls with Major Injury Info Percent of long-stay residents experiencing one or more falls with major injury 5.8%
67% worse than Connecticut average

Connecticut average: 3.5%

High Risk Residents with Pressure Ulcers Info Percent of long-stay high risk residents with pressure ulcers 6.8%
49% worse than Connecticut average

Connecticut average: 4.6%

Urinary Tract Infection Info Percent of long-stay residents with a urinary tract infection 1.1%
33% better than Connecticut average

Connecticut average: 1.7%

Lost Too Much Weight Info Percent of long-stay residents who lose too much weight 1.3%
80% better than Connecticut average

Connecticut average: 6.3%

Depressive Symptoms Info Percent of long-stay residents who have depressive symptoms 0.0%
100% better than Connecticut average

Connecticut average: 15.2%

Antipsychotic Use Info Percent of long-stay residents who received an antipsychotic medication 27.6%
61% worse than Connecticut average

Connecticut average: 17.2%

Pneumococcal Vaccine Info Percent of long-stay residents assessed and appropriately given the pneumococcal vaccine 67.1%
23% worse than Connecticut average

Connecticut average: 87.5%

Influenza Vaccine Info Percent of long-stay residents assessed and appropriately given the seasonal influenza vaccine 80.0%
14% worse than Connecticut average

Connecticut average: 93.5%

Hospitalizations per 1,000 days Info Number of hospitalizations per 1,000 long-stay resident days. 2.65
26% worse than Connecticut average

Connecticut average: 2.10

ED visits per 1,000 days Info Number of outpatient emergency department visits per 1,000 long-stay resident days. 2.20
44% worse than Connecticut average

Connecticut average: 1.53

Short-stay resident measures
Below average Connecticut avg: 3.4 Info CMS star rating based on short-stay quality measure performance. 5 stars = much above average, 1 star = much below average.
Pneumococcal Vaccine Info Percent of short-stay residents assessed and appropriately given the pneumococcal vaccine 60.8%
13% worse than Connecticut average

Connecticut average: 70.1%

Antipsychotic medication increase Info Percent of short-stay residents who newly received an antipsychotic medication 1.5%
In line with Connecticut average

Connecticut average: 1.5%

Influenza Vaccine Info Percent of short-stay residents assessed and appropriately given the seasonal influenza vaccine 55.2%
21% worse than Connecticut average

Connecticut average: 69.8%

Re-hospitalized after SNF stay Info Percentage of short-stay residents who were re-hospitalized after their nursing home admission. 34.5%
38% worse than Connecticut average

Connecticut average: 25.0%

Emergency department visits Info Percentage of short-stay residents who had an outpatient emergency department visit. 13.0%
17% worse than Connecticut average

Connecticut average: 11.1%

Falls with major injury Info Percentage of SNF residents who experience falls with major injury during their stay. 0.7%
In line with Connecticut average

Connecticut average: 0.8%

Ability to care for self at discharge Info Percentage of residents at or above expected ability to care for themselves at discharge. 31.2%
42% worse than Connecticut average

Connecticut average: 53.7%

Successful return to home or community Info Rate of successful return to home or community from a skilled nursing facility. 59.1%
17% better than Connecticut average

Connecticut average: 50.6%

Breakdown by payment type

Medicare

88% of new residents, usually for short-term rehab.

Typical stay 15 days

Private pay

9% of new residents, often for short stays.

Typical stay 8 - 9 months

Medicaid

3% of new residents, often for long-term daily care.

Typical stay 6 - 7 years

Facility Characteristics

Source: CMS Long-Term Care Facility Characteristics (Data as of Jan 2026)

Total residents 141
Medicare
11
7.8% of residents
Medicaid
67
47.5% of residents
Private pay or other
63
44.7% of residents
Programs & Services
Residents Group

Residents meet regularly to discuss policies, care quality, and activities

Family Member Group

Family members meet regularly to discuss policies, care quality, and activities

Active Family Council

Organized group of family members that meets regularly to discuss facility policies, resident care, and activities.

Active Resident Council

Organized group of residents that meets regularly to discuss facility policies, quality of life, and activities.

Finances and operations

Privately-owned community
Operated by a business corporation.
Home revenue
$24.5M
Profit
$1.1M
Privately-owned community Operated by a business corporation.
Home revenue
$24.5M Rank #34 / 72Revenue — State benchmarkedThis home is ranked 34th out of 72 homes in Connecticut. Shows this facility's annual revenue compared to the Connecticut SNF average. Higher revenue generally means more resources for staffing and capital — read alongside Payroll %.Click the rank badge to see the full State ranking.Click here to see the full State ranking.
Profit
$1.1M
Payroll costs Info The portion of the home's budget spent on staff, including nurses, caregivers, and other employees who support care and operations. Rank #42 / 72Payroll — State benchmarkedThis home is ranked 42nd out of 72 homes in Connecticut. Shows total annual staff payroll benchmarked to the Connecticut average. Higher payroll investment relative to peers often signals better staffing and less reliance on cheaper contract labor.Click the rank badge to see the full State ranking.Click here to see the full State ranking.
$10.8M
43.9% of revenue Rank #45 / 72Payroll % — State benchmarkedThis home is ranked 45th out of 72 homes in Connecticut. Shows payroll as a percentage of revenue versus the Connecticut average. Well-run Connecticut SNFs typically land around 51–66% — the top third Statewide. Below 25% may signal understaffing or heavy agency use — read with Staffing ratings.Click the rank badge to see the full State ranking.Click here to see the full State ranking.
Other operating costs Info All remaining costs needed to run the home, such as food, utilities, building maintenance, supplies and administrative expenses.
$12.7M
Total costs $23.4M

What does this home offer?

Building type icon
Building type icon

Building Type: Single-story

Dining services icon

Dining Services

Social and recreational activities icon

Social and Recreational Activities

Rehabilitative support icon

Rehabilitative Support

On-site medical care and health services icon

On-site Medical Care and Health Services

Who this home usually serves

TYPE OF STAY

Mostly short-term rehab stays

Most residents typically stay for a few weeks or months before returning home or moving on.

Places of interest near Hamden Health Care Center

Address 1.3 miles from city center Info Estimated distance in miles from Hamden's city center to Hamden Health Care Center's address, calculated via Google Maps.

Calculate Travel Distance to Hamden Health Care Center

Add your location

Address

Financial Assistance for
Nursing Home in Connecticut

Hamden Health Care Center is located in Hamden, Connecticut.
Here are the financial assistance programs available to residents in Connecticut.

Get Financial aid guidance

Connecticut Home Care Program for Elders

CHCPE

Age 65+
General Connecticut resident, at risk of nursing home placement.
Income Limits State-funded: ~$1,600/month; Medicaid: ~$2,829/month 300% FBR
Asset Limits $1,600 (state), $2,000 (Medicaid, individual).
CT

Two tiers (state and Medicaid); waitlists possible.

Benefits
In-home care (4-6 hours/day) Adult day care (~$70/day) Meals Respite (up to 14 days/year)

Statewide Respite Care Program

CT Respite Care

Age
General Caregiver of senior with dementia, Connecticut resident.
Income Limits ~$2,500/month individual, varies
Asset Limits $40,000 individual
CT

Limited to dementia caregivers; capped funding.

Benefits
In-home respite (up to 30 days/year) Adult day care (~$70/day)

Congregate Housing Services Program (CHSP)

Connecticut Congregate Housing Services Program

Age 62+
General Connecticut resident, frail but not needing 24/7 care, resides in CHSP-eligible housing.
Income Limits (2025) ~$41,000/year individual, adjusted annually
Asset Limits Not specified; focus is income-based.
CT

Limited to 14 state-subsidized sites; participants pay 10% of service costs.

Benefits
Personal care (3-5 hours/day) Meals ($5-$7/meal) Housekeeping Transportation (~5 trips/month)

Medicare Savings Program (MSP)

Connecticut Medicare Savings Program

Age 65+ or disabled
General Connecticut resident, enrolled in Medicare Part A/B.
Income Limits (2025) ~$2,510/month (individual, QMB); ~$3,380/month (SLMB); ~$3,598/month (ALMB)—adjusted annually.
Asset Limits None since 2023 policy change.
CT

Three tiers (Qualified Medicare Beneficiary, Specified Low-Income, Additional Low-Income); no asset test.

Benefits
Covers Medicare Part B premiums ($174.70/month) Deductibles ($240/year) Copays (~20% of services)

Compare Nursing Home around Hamden

The information below is reported by the Connecticut Department of Public Health, Facility Licensing and Investigations Section.

2 facilities compared · CMS & CT Dept. of Health data

Filter by care type
Hamden Health Care Center
NH

Nursing Home Licensed facility providing 24/7 skilled nursing care for residents with complex, ongoing medical needs. Staffed by RNs, LPNs, and CNAs. Inspected and star-rated annually by CMS. Accepts Medicare (short-term rehab) and Medicaid (long-term care).

MC

Memory Care Secured, specialized care for people living with Alzheimer's or dementia. Staff trained in cognitive impairment, with higher staff-to-resident ratios and an environment designed to reduce confusion and wandering risk.

Hamden 153 78.5% -7% 4.21 -20% +6% $0 45 5.0 1 135 28 Wcthc LLC $24.5M $10.8M 43.9% 75366
Arden Care Center
NH

Nursing Home Licensed facility providing 24/7 skilled nursing care for residents with complex, ongoing medical needs. Staffed by RNs, LPNs, and CNAs. Inspected and star-rated annually by CMS. Accepts Medicare (short-term rehab) and Medicaid (long-term care).

MC

Memory Care Secured, specialized care for people living with Alzheimer's or dementia. Staff trained in cognitive impairment, with higher staff-to-resident ratios and an environment designed to reduce confusion and wandering risk.

Hamden 271 79.6% -5% 3.24 -21% -18% $110.5k 63 4.9 3 204 66 Usher Egert $41.2M $19.4M 47.1% 75228

Frequently Asked Questions about Hamden Health Care Center

Is Hamden Health Care Center in a walkable area?

Hamden Health Care Center has a walk score of 28. Somewhat walkable. A few nearby services may be reachable on foot, but most trips require transportation.

What is the best email address for Hamden Health Care Center?

The team at Hamden Health Care Center can be reached at [email protected].

What is the address of Hamden Health Care Center?

Hamden Health Care Center is located at 1270 Sherman Avenue, Hamden, CT 06514.

What is the phone number of Hamden Health Care Center?

(203) 281-7555 will put you in contact with the team at Hamden Health Care Center.

Is Hamden Health Care Center Medicare or Medicaid certified?

Yes — Hamden Health Care Center is a CMS-certified provider of Medicare and Medicaid.

Guides for Better Senior Living

Care Cost Calculator: See Prices in Your Area

Nursing Home Data Explorer

Don’t Wait Too Long: 7 Red Flag Signs Your Parent Needs Assisted Living Now

The True Cost of Assisted Living in 2025 – And How Families Are Paying For It

Understanding Senior Living Costs: Pricing Models, Discounts & Financial Assistance

Explore Open Rooms
1 Contact details
2 What type of senior care service are you looking for?
3 What budget do you have in mind for senior care?
4 How soon do you need to find care?
5 Additional details

Thank you for your interest!

Our team will be in touch shortly to help with next steps.