Asbury Gardens
Nursing Home, Independent Living, Assisted Living, Memory Care & Skilled Nursing · Chicago, IL
CMS overall rating Info The Overall CMS Rating is scored from 1 to 5 stars and combines results from health inspections, staffing levels, and quality measures. Health inspections carry the most weight. Staffing and quality scores can increase or decrease the final rating based on performance compared to state and national standards.

Asbury Gardens

Nursing Home, Independent Living, Assisted Living, Memory Care & Skilled Nursing · Chicago, IL
CMS overall rating Info The Overall CMS Rating is scored from 1 to 5 stars and combines results from health inspections, staffing levels, and quality measures. Health inspections carry the most weight. Staffing and quality scores can increase or decrease the final rating based on performance compared to state and national standards.
Calculator: See prices in your area
Asbury Gardens accepts Medicare, Medicaid, and private pay.

Overview of Asbury Gardens

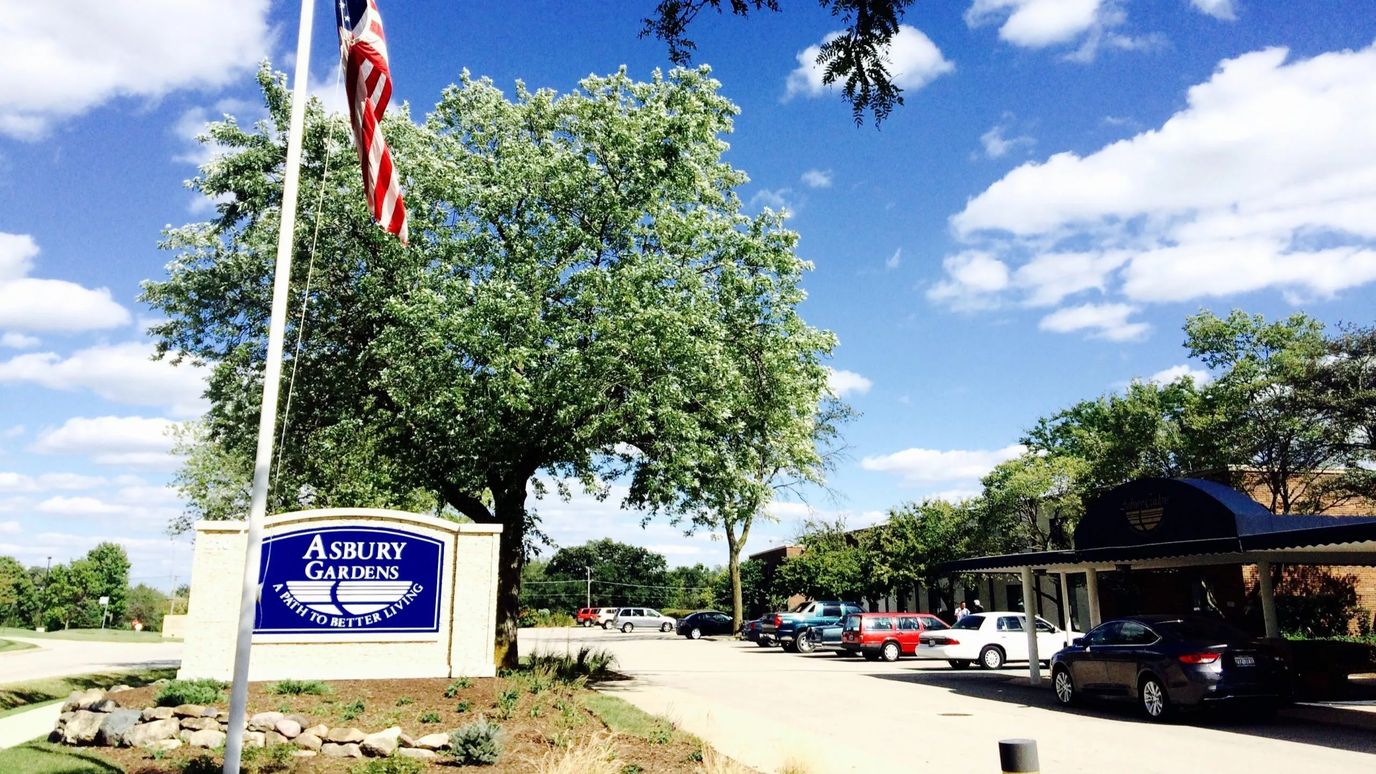
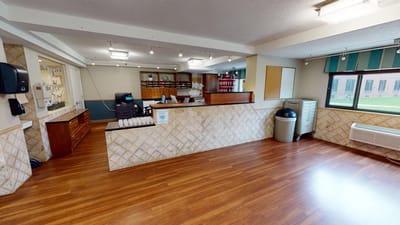
Nestled in a quiet community, Asbury Gardens is a gem of a residential community that opened its doors in 2003. It’s the perfect place for anyone who desires high-quality care without the exorbitant costs. The home is known for its exceptional care services, including skilled nursing, independent living, assisted living, supportive living, and supportive living memory care. With around-the-clock care and a team of compassionate healthcare professionals, residents can rest assured they are in safe hands. They offer a range of post-hospital care and rehabilitation services to ensure that residents can recover in a comfortable and nurturing environment.

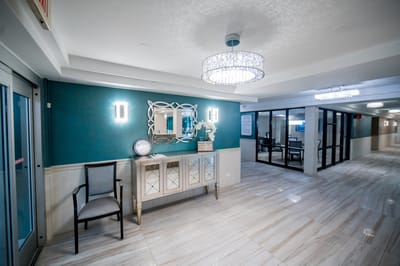
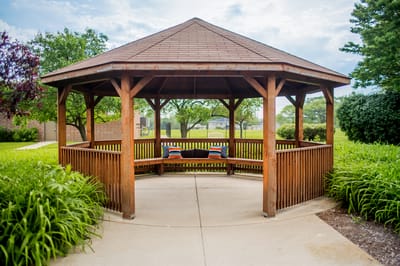
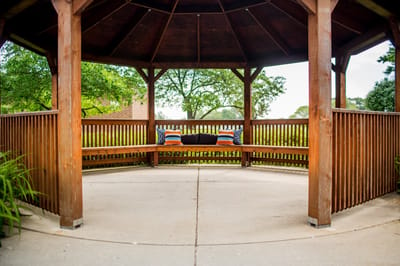
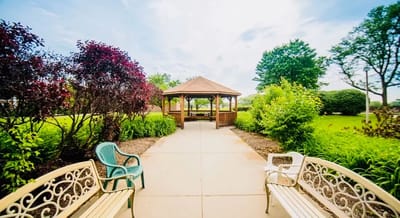
The facility is more than just a place for medical care. They also take pride in providing a range of amenities that help residents feel right at home. From an on-site library to a gazebo game room, small pets, chapel, and even a salon and barber, residents are never short on entertainment or services to enhance their quality of life. Accommodations are spacious and comfortable, designed to meet the needs of all residents. Large closet spaces, emergency pull cords, balconies, and private handicap-accessible baths are just some features that residents enjoy and find useful.

(630) 896-7778

Quality ratings

Measured by Centers for Medicare & Medicaid Services (CMS)

Overall rating Info The Overall CMS Rating combines results from health inspections, staffing levels and quality measures. Health inspections carry the most weight. Staffing and quality scores can increase or decrease the final rating based on performance compared to state and national standards.
▲ 27.0% Above IL avg. ▲ 27.0% Above IL avg.Click the badge to see the full State ranking.Click here to see the full State ranking.
Health Inspection Info Based on the results of the facility's three most recent standard inspections and any complaint investigations. CMS reviews the number, scope, and severity of deficiencies, with more recent findings weighted more heavily.
▲ 31.6% Above IL avg. ▲ 31.6% Above IL avg.Click the badge to see the full State ranking.Click here to see the full State ranking.
Staffing Info Measures average nursing staff hours per resident per day, including Registered Nurses (RNs) and total nursing staff. Ratings are adjusted based on the level of care residents require and are compared to state and national benchmarks.
▲ 20.1% Above IL avg. ▲ 20.1% Above IL avg.Click the badge to see the full State ranking.Click here to see the full State ranking.
Quality Measures Info Based on clinical and physical health indicators reported to CMS, such as hospital readmissions, falls, pressure ulcers, and improvements in mobility. These measures reflect how well residents' health needs are being managed.
▼ 37.3% Below IL avg. ▼ 37.3% Below IL avg.Click the badge to see the full State ranking.Click here to see the full State ranking.

Staffing hours breakdown

Info Daily nursing hours per resident by staff type, reported to CMS. Higher is generally better — compare this facility to state and national averages to see where staffing stands.

Hours per resident per day — compared to Illinois state averages

Total nursing care / resident Info This home is ranked 43rd out of 167 homes in Illinois. Total adjusted nursing hours per resident per day, combining RN, LPN, and aide time. CMS adjusts this for case-mix so facilities can be fairly compared.
4h 0m per day
Rank #43 / 167Nurse hours — State benchmarkedThis home is ranked 43rd out of 167 homes in Illinois. Shows adjusted nurse hours per resident per day benchmarked to the Illinois average, with a ranking across 167 Illinois SNFs. More hours mean more direct care. The national average is about 3.5 hrs; below 3.0 is a red flag.Click the rank badge to see the full State ranking.Click here to see the full State ranking.
This facility Illinois avg (3h 57m per day)
vs Illinois avg
+1%

0 of 1 metrics below state avg

Standout metric Weekend Total Nursing is +33% above state avg
Staff typeHours / Day / Residentvs state avg
Weekend Total Nursing Info Combined nursing hours (RN + LPN + Nurse Aide) per resident per day on weekends. Staffing often drops on weekends — this figure reveals whether the facility maintains adequate coverage outside of weekday hours. 4h 7m per day ▲ 33% State avg: 3h 5m per day · National avg: 3h 25m per day

Types of Care at Asbury Gardens

Independent Living Assisted Living Memory Care Skilled Nursing

Capacity and availability

This home usually has availability

Higher occupancy than the Illinois average: 69.3%
Occupancy rate
80.8% Rank #80 / 199Occupancy rate — State benchmarkedThis home is ranked 80th out of 199 homes in Illinois. Shows this facility's occupancy rate versus the Illinois average, with its Statewide rank out of 199. Higher occupancy signals strong local demand and financial stability.Click the rank badge to see the full State ranking.Click here to see the full State ranking.
Avg. Length of Stay
113 days
Years in operation
39 years in operation Rank #20 / 254Years in operation — State benchmarkedThis home is ranked 20th out of 254 homes in Illinois. Shows how long this facility has been in operation compared to other Illinois SNFs. Longer operating histories may benefit residents, families, and staff.Click the rank badge to see the full State ranking.Click here to see the full State ranking.
A longer operating history, which may indicate experience navigating regulations and delivering ongoing care.
Walk Score
Walk Score: 38 / 100 Rank #434 / 648Walk Score — State benchmarkedThis home is ranked 434th out of 648 homes in Illinois. Shows how walkable this facility's neighborhood is compared to the average Walk Score across Illinois SNFs. Higher scores benefit residents, families, and staff.Click the rank badge to see the full State ranking.Click here to see the full State ranking.
Somewhat walkable. A few nearby services may be reachable on foot, but most trips require transportation.
BBB Rating
BBB Rating: A+ (Not Accredited)
An independent rating from the Better Business Bureau based on factors such as complaint history, transparency, and business practices.
How BBB ratings work

About this community

Safety & Compliance

Wheelchair Accessible

Staffing

Key information about the people who lead and staff this community.

Leadership

ContactMr. Joseph Chase, Executive Director

Therapy & Rehabilitation

3 services
Rehabilitation Services
Respite Care
Short-Term Rehab

Staffing & Medical

1 service
24-Hour Staffing

Additional Policies & Features

Minimum Age65
HousekeepingYes

Amenities & Lifestyle

On-Site Beauty Salon & Barber Services
Spacious Formal Dining Room
Private Dining Room
Chapel Offering Religious Services
Game Room
Private Mailboxes
Activity Room
Two Outdoor Courtyards
Gazebo
Spacious Lobby
Residents’ Lounge
Country Store W/Snacks
Staples & Toiletries
Fully Equipped Laundry Room
Financial Service Assistance
On-Site Library
Small Pets Welcome
ActivitiesThere is always something going on at Asbury Gardens, including fitness activities, organized clubs, bingo, card games, outdoor movies, casino night, happy hour, special outings, community baseball, socials, guest entertainers, and religious services.
Specific ProgramsHome Health Services, Fitness Activities, Organized Clubs, Bingo, Card Games, Outdoor Movies, Casino Night, Happy Hour, Special Outings, Community Baseball, Socials, Guest Entertainers, Religious Services
Religious ServicesYes

Dining & Nutrition

Food DescriptionThree meals a day in the dining room.

Contact Asbury Gardens

Health Inspection History

Inspections since 2023
Total health inspections 6

Illinois average 10.4


Last Health inspection on Nov 2024

Total health citations
21 Rank #45 / 167Health citations — State benchmarkedThis home is ranked 45th out of 167 homes in Illinois. Shows this facility's total health deficiency citations benchmarked to the Illinois State average, with a ranking across all 167 IL SNFs. Lower citation counts earn a better rank.Click the rank badge to see the full State ranking.Click here to see the full State ranking.

Illinois average 36.8

Citations per inspection
3.5 Rank #81 / 167Citations per inspection — State benchmarkedThis home is ranked 81st out of 167 homes in Illinois. Shows average deficiency citations per CMS inspection for this facility versus the Illinois mean across 167 SNFs with citation data. Lower is better.Click the rank badge to see the full State ranking.Click here to see the full State ranking.

Illinois average 3.68


Health citations are formal notices following inspections when they fail to comply with safety and care standards.

18 of 21 citations resulted from standard inspections; and 3 of 21 resulted from complaint investigations.

Breakdown of citation severity (last 3 years)
Critical health citations
0
100% better than Illinois average

Illinois average: 0.7


Serious health citations
0
100% better than Illinois average

Illinois average: 3.6

0 critical citations Illinois average: 0.7

0 serious citations Illinois average: 3.6

21 moderate citations Illinois average: 32

0 minor citations Illinois average: 0.5
Citations history (last 3 years)
Nutrition moderate citation Nov 14, 2024
Corrected

Quality of Care moderate citation Nov 14, 2024
Corrected

Quality of Care moderate citation Nov 14, 2024
Corrected

Quality of Care moderate citation Nov 14, 2024
Corrected

Staffing Data

Reporting period: October 1 – December 31, 2025 (Q4 2025). Source: CMS Payroll-Based Journal report.

Total staff 127
Employees 67
Contractors 60
Staff to resident ratio 2.15:1
20% better than Illinois average
Illinois average ratio: 1.80:1 Illinois average ratio: 1.80:1See full Illinois ranking
Avg staff/day 31
Average shift 8.2 hours
8% better than Illinois average
Illinois average: 7.6 hours Illinois average shift: 7.6 hoursSee full Illinois ranking
Total staff hours (quarter) 23,275

Nursing staff breakdown

Q4 2025 · Oct 1 – Dec 31 More info This data comes from the CMS Payroll-Based Journal report covering October 1 – December 31, 2025.
Registered Nurse

Manages medical care and health needs.

RN Staff 19
Average shift length Info Average shift length. Calculated as total hours divided by days worked and average staff per day. 10.2 hours

This role is partially covered by contractors.

Licensed Practical Nurse

Assists with medical care and medications.

LPN Staff 5
Average shift length Info Average shift length. Calculated as total hours divided by days worked and average staff per day. 9.2 hours

This role is partially covered by contractors.

Certified Nursing Assistant

Helps with daily care and mobility.

CNA Staff 84
Average shift length Info Average shift length. Calculated as total hours divided by days worked and average staff per day. 8.2 hours

This role is partially covered by contractors.

Contractor staffing

Q4 2025 · Oct 1 – Dec 31 More info This data comes from the CMS Payroll-Based Journal report covering October 1 – December 31, 2025.

Total hours from contractors

10%

2,335 contractor hours this quarter

Certified Nursing Assistant: 42 Registered Nurse: 5 Physical Therapy Assistant: 3 Qualified Social Worker: 3 Licensed Practical Nurse: 2 Speech Language Pathologist: 2 Respiratory Therapy Technician: 1 Medical Director: 1 Physical Therapy Aide: 1

Staff by category

Q4 2025 · Oct 1 – Dec 31 More info This data comes from the CMS Payroll-Based Journal report covering October 1 – December 31, 2025.
Certified Nursing Assistant42428413,21192100%8.2
Registered Nurse145194,09792100%10.2
Licensed Practical Nurse3251,5919199%9.2
Clinical Nurse Specialist3031,1046672%6.6
RN Director of Nursing2025006470%4
Mental Health Service Worker1014806065%8
Physical Therapy Assistant0334776065%7.8
Speech Language Pathologist0224725964%7.8
Nurse Practitioner1014645863%8
Administrator1014405560%8
Respiratory Therapy Technician0112474145%6
Qualified Social Worker0331284043%3.2
Physical Therapy Aide011561617%3.5
Medical Director01191213%0.8
84 Certified Nursing Assistant
% of Days 100%
19 Registered Nurse
% of Days 100%
5 Licensed Practical Nurse
% of Days 99%
3 Clinical Nurse Specialist
% of Days 72%
2 RN Director of Nursing
% of Days 70%
1 Mental Health Service Worker
% of Days 65%
3 Physical Therapy Assistant
% of Days 65%
2 Speech Language Pathologist
% of Days 64%
1 Nurse Practitioner
% of Days 63%
1 Administrator
% of Days 60%
1 Respiratory Therapy Technician
% of Days 45%
3 Qualified Social Worker
% of Days 43%
1 Physical Therapy Aide
% of Days 17%
1 Medical Director
% of Days 13%

Penalties and fines

Includes penalties issued in 2023

Federal penalties imposed by CMS for regulatory violations, including civil money penalties (fines) and denials of payment for new Medicare/Medicaid admissions.

Source: CMS Penalties Database (Data as of Jan 2026)

Total fines amount $6K Rank #66 / 168Federal fines — State benchmarkedThis home is ranked 66th out of 168 homes in Illinois. Shows this facility's cumulative CMS federal fine dollars versus the Illinois average among facilities with fines, and where it ranks among 168 skilled nursing facilities in the pool. Lower total dollars mean a better rank.Click the rank badge to see the full State ranking.Click here to see the full State ranking.
96% lower than Illinois average

Illinois average: $143K

Number of fines 2
33% fewer fines than Illinois average

Illinois average: 3.0

Payment Denials Info Serious action where Medicare and/or Medicaid temporarily stops payments for new residents until issues are fixed. 0
100% fewer payment denials than Illinois average

Illinois average: 1.1

Fines amount comparison
This facility $6K
Illinois average $143K
Penalty History

Penalties are imposed by CMS for violations of federal nursing home regulations.

2 penalties in the past 3 years

Multiple penalties were reported in the last 3 years.

Civil Money Penalty Info Fines imposed for noncompliance, which can be assessed per day or per instance of violation. Aug 21, 2023
$2K
Civil Money Penalty Info Fines imposed for noncompliance, which can be assessed per day or per instance of violation. Jul 31, 2023
$4K

Last updated: Jan 2026

Quality of care over time

These measures show how residents usually do over time at this home, based on health outcomes and preventive care.

High-risk clinical events score Info A composite score based on pressure ulcers, falls with injury, weight loss, walking ability decline, and activities of daily living decline. 14.9
54% worse than Illinois average

Illinois average: 9.7

Functional decline score Info A composite score based on activities of daily living decline, walking ability decline, and incontinence. 31.2
68% worse than Illinois average

Illinois average: 18.6

Long-stay resident measures
Need for Help with Daily Activities Increased Info Percent of long-stay residents whose need for help with daily activities has increased 25.6%
65% worse than Illinois average

Illinois average: 15.5%

Walking Ability Worsened Info Percent of long-stay residents whose ability to move independently worsened 33.1%
80% worse than Illinois average

Illinois average: 18.4%

Low Risk Residents with Bowel/Bladder Incontinence Info Percent of low risk long-stay residents who lose control of their bowels or bladder 35.0%
62% worse than Illinois average

Illinois average: 21.6%

Falls with Major Injury Info Percent of long-stay residents experiencing one or more falls with major injury 3.6%
8% worse than Illinois average

Illinois average: 3.4%

High Risk Residents with Pressure Ulcers Info Percent of long-stay high risk residents with pressure ulcers 3.6%
31% better than Illinois average

Illinois average: 5.3%

Urinary Tract Infection Info Percent of long-stay residents with a urinary tract infection 1.1%
42% better than Illinois average

Illinois average: 1.8%

Lost Too Much Weight Info Percent of long-stay residents who lose too much weight 8.7%
34% worse than Illinois average

Illinois average: 6.5%

Depressive Symptoms Info Percent of long-stay residents who have depressive symptoms 12.7%
74% better than Illinois average

Illinois average: 48.1%

Antipsychotic Use Info Percent of long-stay residents who received an antipsychotic medication 9.9%
51% better than Illinois average

Illinois average: 20.2%

Pneumococcal Vaccine Info Percent of long-stay residents assessed and appropriately given the pneumococcal vaccine 93.8%
5% better than Illinois average

Illinois average: 89.2%

Influenza Vaccine Info Percent of long-stay residents assessed and appropriately given the seasonal influenza vaccine 100.0%
9% better than Illinois average

Illinois average: 91.6%

Short-stay resident measures
Pneumococcal Vaccine Info Percent of short-stay residents assessed and appropriately given the pneumococcal vaccine 81.6%
19% better than Illinois average

Illinois average: 68.3%

Antipsychotic medication increase Info Percent of short-stay residents who newly received an antipsychotic medication 5.0%
113% worse than Illinois average

Illinois average: 2.3%

Influenza Vaccine Info Percent of short-stay residents assessed and appropriately given the seasonal influenza vaccine 93.6%
48% better than Illinois average

Illinois average: 63.0%

Breakdown by payment type

Medicare

47% of new residents, usually for short-term rehab.

Typical stay 1 months

Private pay

32% of new residents, often for short stays.

Typical stay 5 - 6 months

Medicaid

21% of new residents, often for long-term daily care.

Typical stay 5 - 6 months

Facility Characteristics

Source: CMS Long-Term Care Facility Characteristics (Data as of Jan 2026)

Total residents 59
Medicare
13
22% of residents
Medicaid
36
61% of residents
Private pay or other
10
16.9% of residents
Programs & Services
Residents Group

Residents meet regularly to discuss policies, care quality, and activities

CCRC

Part of a Continuing Care Retirement Community offering multiple care levels

Active Resident Council

Organized group of residents that meets regularly to discuss facility policies, quality of life, and activities.

Finances and operations

Privately-owned community
Home revenue
$8.6M
Operating loss
-$443.1K
Privately-owned community
Home revenue
$8.6M Rank #139 / 166Revenue — State benchmarkedThis home is ranked 139th out of 166 homes in Illinois. Shows this facility's annual revenue compared to the Illinois SNF average. Higher revenue generally means more resources for staffing and capital — read alongside Payroll %.Click the rank badge to see the full State ranking.Click here to see the full State ranking.
Operating loss
-$443.1K
Payroll costs Info The portion of the home's budget spent on staff, including nurses, caregivers, and other employees who support care and operations. Rank #132 / 166Payroll — State benchmarkedThis home is ranked 132nd out of 166 homes in Illinois. Shows total annual staff payroll benchmarked to the Illinois average. Higher payroll investment relative to peers often signals better staffing and less reliance on cheaper contract labor.Click the rank badge to see the full State ranking.Click here to see the full State ranking.
$5.1M
59.8% of revenue Rank #32 / 166Payroll % — State benchmarkedThis home is ranked 32nd out of 166 homes in Illinois. Shows payroll as a percentage of revenue versus the Illinois average. Well-run Illinois SNFs typically land around 54–67% — the top third Statewide. Below 25% may signal understaffing or heavy agency use — read with Staffing ratings.Click the rank badge to see the full State ranking.Click here to see the full State ranking.
Other operating costs Info All remaining costs needed to run the home, such as food, utilities, building maintenance, supplies and administrative expenses.
$3.9M
Total costs $9.0M

What does this home offer?

Minimum age icon
Minimum age icon

Minimum Age: 65 Years Old

Pets allowed icon
Pets allowed icon

Pets Allowed

Transportation services icon

Transportation Services

Fitness and recreation icon

Fitness and Recreation

Who this home usually serves

TYPE OF STAY

Mostly short-term rehab stays

Most residents typically stay for a few weeks or months before returning home or moving on.

Matterport

Experience a digital walkthrough
Loading tour...

Places of interest near Asbury Gardens

Address 39.4 miles from city center Info Estimated distance in miles from North Aurora's city center to Asbury Gardens's address, calculated via Google Maps. — 0.81 miles to nearest hospital (Mercy Medical Center - Emergency Department)

Calculate Travel Distance to Asbury Gardens

Add your location

Address

Financial Assistance for
Nursing Home in Illinois

Asbury Gardens is located in North Aurora, Illinois.
Here are the financial assistance programs available to residents in Illinois.

Get Financial aid guidance

Community Care Program

Illinois CCP

Age 60+
General Illinois resident, at risk of nursing home placement.
Income Limits (2025) ~$1,215/month individual
Asset Limits $17,500 individual, excludes home, car
IL

High demand in urban areas; waitlists possible.

Benefits
In-home care (3-5 hours/day) Adult day services ($65/day) Emergency home response systems ($30/month)

Illinois Respite Program

IL Respite (via NFCSP)

Age Caregiver of someone 60+ (or with dementia)
General Illinois resident.
Income Limits No strict limit; prioritizes low-income.
Asset Limits Not applicable.
IL

Limited slots; urban/rural balance.

Benefits
In-home respite (4-6 hours/day) Adult day care (~$65/day) Short-term facility care (up to 5 days)

Supportive Living Program (SLP)

Illinois Medicaid Supportive Living Program

Age 65+ or 22-64 with disability
General Illinois resident, Medicaid-eligible, needs moderate assistance (not nursing home-level).
Income Limits (2025) ~$2,829/month (300% FBR, individual); QIT allowed.
Asset Limits $2,000 (individual), $3,000 (couple) (excludes home, car).
IL

~200 SLP sites statewide; room/board not covered.

Benefits
Personal care (5-7 hours/day, e.g., bathing, mobility) Meals Housekeeping Medication management Respite (~240 hours/year)

Persons Who Are Elderly Waiver

Illinois Medicaid Elderly Waiver

Age 65+
General Illinois resident, Medicaid-eligible, nursing home-level care need.
Income Limits (2025) ~$2,829/month 300% FBR, individual
Asset Limits $2,000 (individual), $3,000 (couple).
IL

Part of HealthChoice Illinois; consumer-directed options available.

Benefits
Personal care (5-7 hours/day, e.g., dressing, eating) Homemaker Adult day care (~$60/day) Respite (240 hours/year) Home mods ($1,000 avg.)

Medicare Savings Program (MSP)

Illinois Medicare Savings Program

Age 65+ or disabled
General Illinois resident, Medicare Part A/B.
Income Limits (2025) ~$2,510/month (QMB), ~$3,380/month (SLMB), ~$3,598/month (QI)—individual.
Asset Limits $9,430 (individual), $14,130 (couple).
IL

Three tiers; no waitlist.

Benefits
Covers Part B premiums ($174.70/month) Deductibles ($240/year) Copays (~20%)

Optional State Supplementation (OSS)

Illinois Optional State Supplementation

Age 65+ or disabled
General Illinois resident, in approved facility, SSI recipient or low-income.
Income Limits (2025) ~$1,004/month including SSI
Asset Limits $2,000 (individual), $3,000 (couple).
IL

~$50-$500/month based on facility type.

Benefits
Cash (~$50-$500/month) for room/board in personal care homes or SLFs

VA Aid and Attendance (A&A) and Housebound Benefits

Illinois VA Aid and Attendance/Housebound

Age 65+ or disabled veteran/spouse
General Illinois resident, wartime service, need for ADL help (A&A) or homebound.
Income Limits (2025) Net income < ~$1,984/month (veteran with dependent, A&A); pension offsets income.
Asset Limits ~$155,356 net worth limit
IL

High veteran demand in urban/rural areas.

Benefits
Cash (~$1,433-$2,642/month veteran, ~$951-$1,318 spouse) for care costs (e.g., in-home, assisted living)

Compare Nursing Home around Chicago

The information below is reported by the Illinois Department of Public Health, Office of Health Care Regulation.

5 facilities compared · CMS & IL Dept. of Health data

Filter by care type
The Selfhelp Home Senior Living Community
NH

Nursing Home Licensed facility providing 24/7 skilled nursing care for residents with complex, ongoing medical needs. Staffed by RNs, LPNs, and CNAs. Inspected and star-rated annually by CMS. Accepts Medicare (short-term rehab) and Medicaid (long-term care).

AL

Assisted Living A licensed, long-term care setting for seniors or individuals with disabilities who need help with daily activities — like bathing, dressing, and medication management — but not 24-hour skilled nursing. Offers housing, meals, and around-the-clock support while aiming to maximize resident independence.

IL

Independent Living Lifestyle-focused communities for older adults offering dining, activities, and transportation with minimal personal care. Best for active, independent seniors who want community without medical support.

RC

Respite Care Short-term temporary care — days to weeks — to give family caregivers a break. Full care provided during the stay. Often used after hospitalization or to trial a facility before a permanent placement decision.

Chicago (Uptown)72 81.9% +18%5.56 +44%+79%$0215.3159A+ 92 Marvin Rubin$15.5M$8.0M51.5%146009
Asbury Gardens
NH

Nursing Home Licensed facility providing 24/7 skilled nursing care for residents with complex, ongoing medical needs. Staffed by RNs, LPNs, and CNAs. Inspected and star-rated annually by CMS. Accepts Medicare (short-term rehab) and Medicaid (long-term care).

AL

Assisted Living A licensed, long-term care setting for seniors or individuals with disabilities who need help with daily activities — like bathing, dressing, and medication management — but not 24-hour skilled nursing. Offers housing, meals, and around-the-clock support while aiming to maximize resident independence.

IL

Independent Living Lifestyle-focused communities for older adults offering dining, activities, and transportation with minimal personal care. Best for active, independent seniors who want community without medical support.

MC

Memory Care Secured, specialized care for people living with Alzheimer's or dementia. Staff trained in cognitive impairment, with higher staff-to-resident ratios and an environment designed to reduce confusion and wandering risk.

North Aurora (Airport Road)75 80.8% +17%4.00 +6%+29%$6.4k213.5-59A+ 38 Abraham Diamond$8.6M$5.1M59.8%146170
Norwood Crossing
NH

Nursing Home Licensed facility providing 24/7 skilled nursing care for residents with complex, ongoing medical needs. Staffed by RNs, LPNs, and CNAs. Inspected and star-rated annually by CMS. Accepts Medicare (short-term rehab) and Medicaid (long-term care).

AL

Assisted Living A licensed, long-term care setting for seniors or individuals with disabilities who need help with daily activities — like bathing, dressing, and medication management — but not 24-hour skilled nursing. Offers housing, meals, and around-the-clock support while aiming to maximize resident independence.

MC

Memory Care Secured, specialized care for people living with Alzheimer's or dementia. Staff trained in cognitive impairment, with higher staff-to-resident ratios and an environment designed to reduce confusion and wandering risk.

RC

Respite Care Short-term temporary care — days to weeks — to give family caregivers a break. Full care provided during the stay. Often used after hospitalization or to trial a facility before a permanent placement decision.

Chicago (Norwood Park)55 89.1% +29%3.86 +74%+24%$78.4k294.82113- 83 Norwood Crossing Association$26.5M$13.8M52%145974
Admiral at the Lake
NH

Nursing Home Licensed facility providing 24/7 skilled nursing care for residents with complex, ongoing medical needs. Staffed by RNs, LPNs, and CNAs. Inspected and star-rated annually by CMS. Accepts Medicare (short-term rehab) and Medicaid (long-term care).

AL

Assisted Living A licensed, long-term care setting for seniors or individuals with disabilities who need help with daily activities — like bathing, dressing, and medication management — but not 24-hour skilled nursing. Offers housing, meals, and around-the-clock support while aiming to maximize resident independence.

IL

Independent Living Lifestyle-focused communities for older adults offering dining, activities, and transportation with minimal personal care. Best for active, independent seniors who want community without medical support.

MC

Memory Care Secured, specialized care for people living with Alzheimer's or dementia. Staff trained in cognitive impairment, with higher staff-to-resident ratios and an environment designed to reduce confusion and wandering risk.

Chicago (Uptown)56 88.6% +28%4.93 -22%+59%$0265.2127A+ 90 Nadia Geigler$25.6M$11.0M42.8%146165
Encore Village of Schaumburg
NH

Nursing Home Licensed facility providing 24/7 skilled nursing care for residents with complex, ongoing medical needs. Staffed by RNs, LPNs, and CNAs. Inspected and star-rated annually by CMS. Accepts Medicare (short-term rehab) and Medicaid (long-term care).

AL

Assisted Living A licensed, long-term care setting for seniors or individuals with disabilities who need help with daily activities — like bathing, dressing, and medication management — but not 24-hour skilled nursing. Offers housing, meals, and around-the-clock support while aiming to maximize resident independence.

IL

Independent Living Lifestyle-focused communities for older adults offering dining, activities, and transportation with minimal personal care. Best for active, independent seniors who want community without medical support.

MC

Memory Care Secured, specialized care for people living with Alzheimer's or dementia. Staff trained in cognitive impairment, with higher staff-to-resident ratios and an environment designed to reduce confusion and wandering risk.

Schaumburg109 55.4% -20%3.46 +8%+12%$25.5k282.62114A+ 58 Il Ccrc, LLC$96.9M$18.2M18.8%145341

Frequently Asked Questions about Asbury Gardens

What neighborhood is Asbury Gardens in?

Asbury Gardens is in the Airport Road neighborhood of North Aurora.

Is Asbury Gardens in a walkable area?

Asbury Gardens has a walk score of 38. Somewhat walkable. A few nearby services may be reachable on foot, but most trips require transportation.

Are there photos of Asbury Gardens?

Yes — there are 7 photos of Asbury Gardens in the photo gallery on this page.

What is the address of Asbury Gardens?

Asbury Gardens is located at 210 Airport Rd, North Aurora, IL 60542, United States.

What is the phone number of Asbury Gardens?

(630) 896-7778 will put you in contact with the team at Asbury Gardens.

Is Asbury Gardens Medicare or Medicaid certified?

Yes — Asbury Gardens is a CMS-certified provider of Medicare and Medicaid.

Guides for Better Senior Living

Care Cost Calculator: See Prices in Your Area

Nursing Home Data Explorer

Don’t Wait Too Long: 7 Red Flag Signs Your Parent Needs Assisted Living Now

The True Cost of Assisted Living in 2025 – And How Families Are Paying For It

Understanding Senior Living Costs: Pricing Models, Discounts & Financial Assistance

Explore Open Rooms
1 Contact details
2 What type of senior care service are you looking for?
3 What budget do you have in mind for senior care?
4 How soon do you need to find care?
5 Additional details

Thank you for your interest!

Our team will be in touch shortly to help with next steps.