The Selfhelp Home Senior Living Community
Nursing Home, Assisted Living, Independent Living & Respite Care · Chicago, IL
CMS overall rating Info CMS (the Centers for Medicare & Medicaid Services) is the federal agency that rates nursing home quality. Its Overall Rating runs from 1 to 5 stars, combining health inspections, staffing, and quality measures, with inspections weighted most heavily.

The Selfhelp Home Senior Living Community

Nursing Home, Assisted Living, Independent Living & Respite Care · Chicago, IL
CMS overall rating Info CMS (the Centers for Medicare & Medicaid Services) is the federal agency that rates nursing home quality. Its Overall Rating runs from 1 to 5 stars, combining health inspections, staffing, and quality measures, with inspections weighted most heavily.
Calculator: See prices in your area
The Selfhelp Home Senior Living Community accepts Medicare, Medicaid, and private pay.

Overview of The Selfhelp Home Senior Living Community

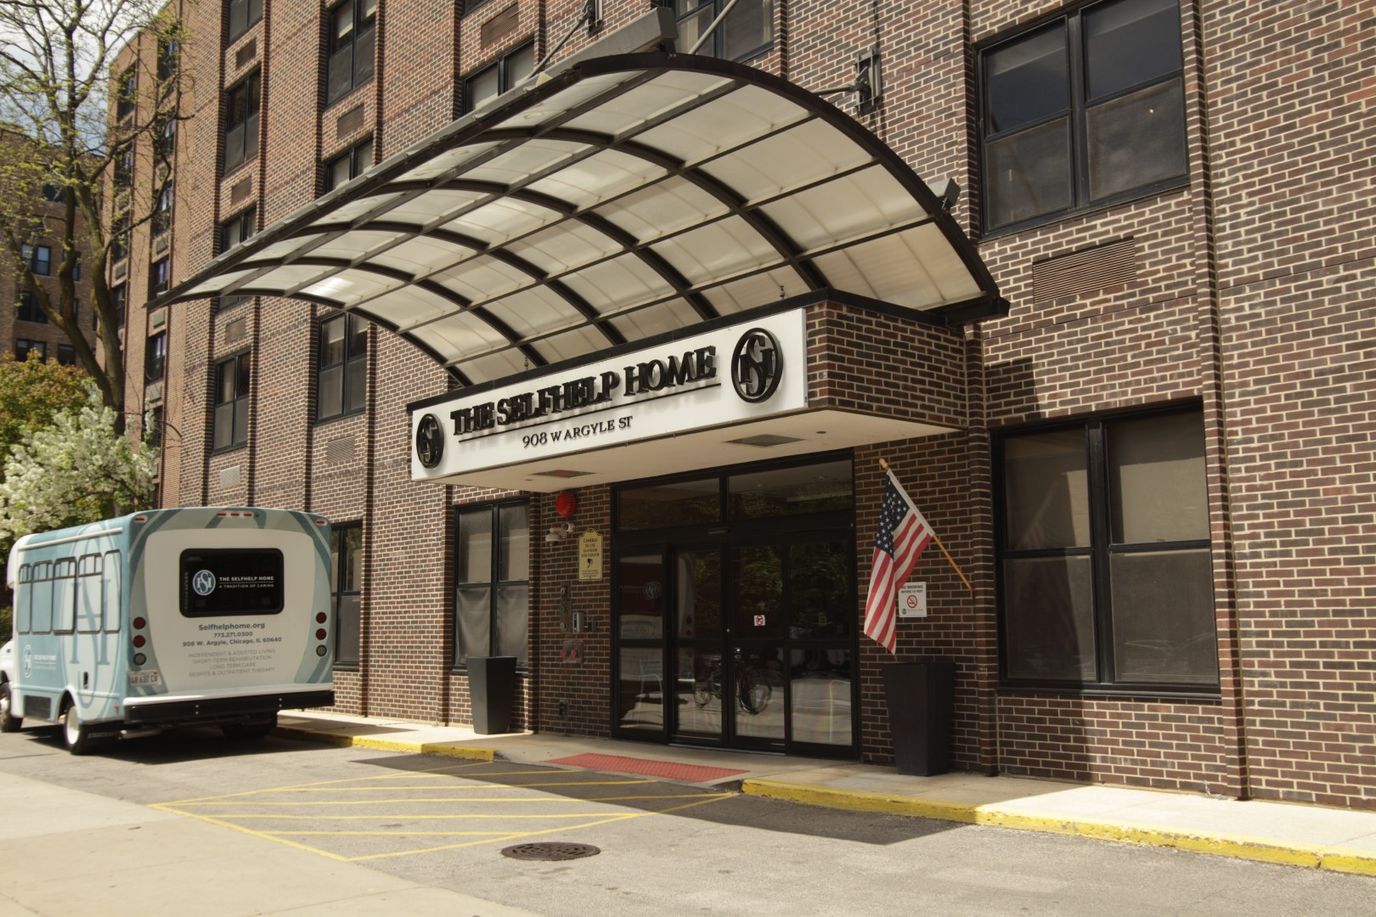
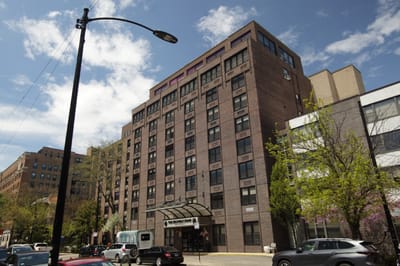
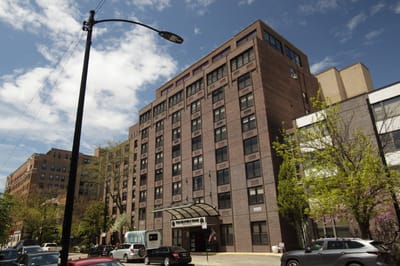
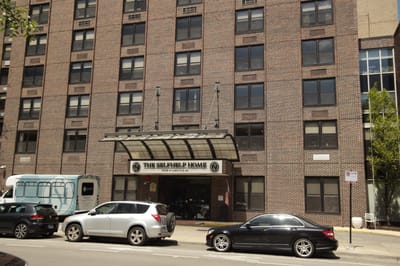
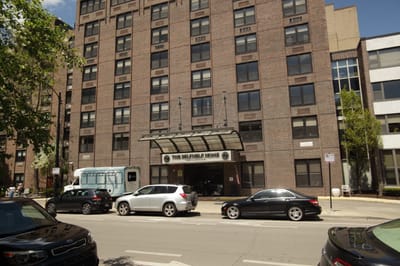
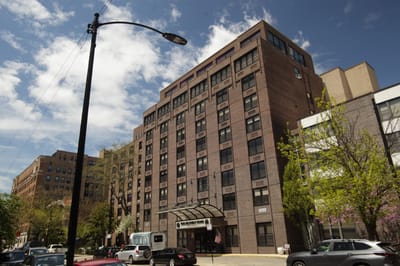
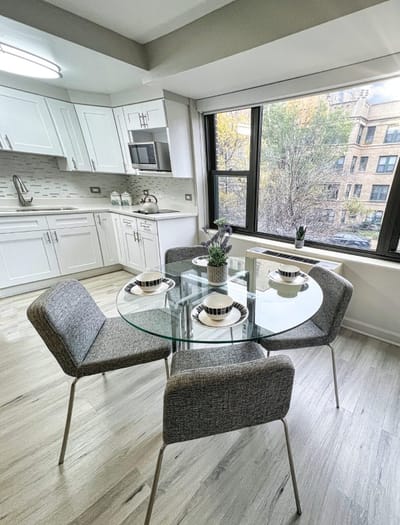
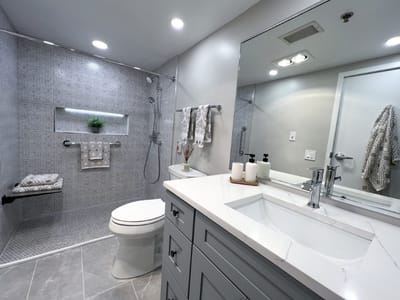
Catering to older Jewish residents in Chicago, IL, The Selfhelp Home Senior Living Community offers a full continuum of care to accommodate residents’ changing needs. Residents here enjoy the convenience of having independent living, assisted living, long-term care, and rehabilitation services on one campus. As a non-profit and award-winning community, The Selfhelp Home ensures that residents are provided with care services focused solely on their well-being.

Apart from comprehensive care plans, residents here enjoy access to a wellness center where they can meet various healthcare professionals for their medical needs. Other amenities like a movie theater, library, and a sanctuary for meditation and worship are also available to meet residents’ diverse interests. Here, you can confidently enjoy the life you want while receiving the support you need without hassles and worries.

(773) 271-0300

Quality ratings

Measured by Centers for Medicare & Medicaid Services (CMS)

Overall rating Info The Overall CMS Rating combines results from health inspections, staffing levels and quality measures. Health inspections carry the most weight. Staffing and quality scores can increase or decrease the final rating based on performance compared to state and national standards.
▲ 98.4% Above IL avg. ▲ 98.4% Above IL avg.IL average: 2.5Click the badge to see the full State ranking.Click here to see the full State ranking.
Health Inspection Info Based on the results of the facility's three most recent standard inspections and any complaint investigations. CMS reviews the number, scope, and severity of deficiencies, with more recent findings weighted more heavily.
▲ 44.1% Above IL avg. ▲ 44.1% Above IL avg.IL average: 2.8Click the badge to see the full State ranking.Click here to see the full State ranking.
Staffing Info Measures average nursing staff hours per resident per day, including Registered Nurses (RNs) and total nursing staff. Ratings are adjusted based on the level of care residents require and are compared to state and national benchmarks.
▲ 133.9% Above IL avg. ▲ 133.9% Above IL avg.IL average: 2.1Click the badge to see the full State ranking.Click here to see the full State ranking.
Quality Measures Info Based on clinical and physical health indicators reported to CMS, such as hospital readmissions, falls, pressure ulcers, and improvements in mobility. These measures reflect how well residents' health needs are being managed.
▲ 77.6% Above IL avg. ▲ 77.6% Above IL avg.IL average: 2.8Click the badge to see the full State ranking.Click here to see the full State ranking.

Staffing hours breakdown

Info Daily nursing hours per resident by staff type, reported to CMS. Higher is generally better — compare this facility to state and national averages to see where staffing stands.

Hours per resident per day — compared to Illinois state averages

Total nursing care / resident Info This home is ranked 8th out of 172 homes in Illinois for nurse hours. Total adjusted nursing hours per resident per day, combining RN, LPN, and aide time. CMS adjusts this for case-mix so facilities can be fairly compared.
5h 34m per day
Rank #8 / 172Nurse hours — State benchmarkedThis home is ranked 8th out of 172 homes in Illinois. Shows adjusted nurse hours per resident per day benchmarked to the Illinois average, with a ranking across 172 Illinois facilities. More hours mean more direct care. The national average is about 3.5 hrs; below 3.0 is a red flag.Ranking totals vary by category as each rank only includes facilities that report data for that metric. Homes missing that data point aren't included in the ranking.Click the rank badge to see the full State ranking.Click here to see the full State ranking.
This facility Illinois avg (3h 6m per day)
vs Illinois avg
+79%

1 of 6 metrics below state avg

Standout metric Registered Nurse (RN) is +116% above state avg
Staff typeHours / Day / Residentvs state avg
Registered Nurse (RN) Info RNs hold the highest nursing license and can assess residents, interpret test results, and direct care plans. More RN hours per day often signals stronger clinical oversight and faster response to health changes. 1h 35m per day ▲ 116% State avg: 44m per day · National avg: 41m per day
LPN / LVN Info Licensed Practical Nurses (LPNs) or Licensed Vocational Nurses (LVNs) deliver routine hands-on care — medication administration, wound dressing, and monitoring vital signs. They work under RN supervision and make up a large share of daily bedside care. 26m per day ▼ 32% State avg: 38m per day · National avg: 52m per day
Nurse Aide Info Certified Nurse Aides (CNAs) provide the most direct day-to-day assistance: bathing, dressing, feeding, and mobility. Nurse aide hours are typically the largest staffing category and directly affect residents' quality of life. 3h 13m per day ▲ 51% State avg: 2h 8m per day · National avg: 2h 21m per day
Weekend Total Nursing Info Combined nursing hours (RN + LPN + Nurse Aide) per resident per day on weekends. Staffing often drops on weekends — this figure reveals whether the facility maintains adequate coverage outside of weekday hours. 4h 40m per day ▲ 51% State avg: 3h 5m per day · National avg: 3h 26m per day
Physical Therapist Info Hours per resident per day provided by licensed Physical Therapists (PTs) or PT Assistants. PT services help residents recover mobility after injury or illness and are especially important for post-acute (short-stay) rehabilitation. 5m per day ▲ 70% State avg: 3m per day · National avg: 4m per day
Weekend RN Info Registered nurse hours specifically on weekends. Facilities sometimes reduce RN presence on Saturdays and Sundays — a low weekend RN figure compared to weekday hours can indicate reduced clinical oversight when most administrative staff are absent. 1h 9m per day ▲ 104% State avg: 34m per day · National avg: 29m per day

Capacity and availability

This home usually has availability

Higher occupancy than the Illinois average: 69.3%
Occupancy rate
75.6% Rank #74 / 204Occupancy rate — State benchmarkedThis home is ranked 74th out of 204 homes in Illinois. Shows this facility's occupancy rate versus the Illinois average, with its Statewide rank out of 204. Higher occupancy signals strong local demand and financial stability.Ranking totals vary by category as each rank only includes facilities that report data for that metric. Homes missing that data point aren't included in the ranking.Click the rank badge to see the full State ranking.Click here to see the full State ranking.
Avg. Length of Stay
83 days
Years in operation
18 years in operation Rank #75 / 145Years in operation — State benchmarkedThis home is ranked 75th out of 145 homes in Illinois. Shows how long this facility has been in operation compared to other Illinois facilities. Longer operating histories may benefit residents, families, and staff.Ranking totals vary by category as each rank only includes facilities that report data for that metric. Homes missing that data point aren't included in the ranking.Click the rank badge to see the full State ranking.Click here to see the full State ranking.
A longer operating history, which may indicate experience navigating regulations and delivering ongoing care.
Walk Score
Walk Score: 92 / 100 Rank #28 / 648Walk Score — State benchmarkedThis home is ranked 28th out of 648 homes in Illinois. Shows how walkable this facility's neighborhood is compared to the average Walk Score across Illinois facilities. Higher scores benefit residents, families, and staff.Ranking totals vary by category as each rank only includes facilities that report data for that metric. Homes missing that data point aren't included in the ranking.Click the rank badge to see the full State ranking.Click here to see the full State ranking.
Walker's paradise. Daily errands do not require a car, with many shops and services nearby.
BBB Rating
BBB Rating: A+ (Not Accredited)
An independent rating from the Better Business Bureau based on factors such as complaint history, transparency, and business practices.
How BBB ratings work

About this community

License Details

Facility TypeAssisted Living/shared Housing Establishment
StatusActive
IssuanceJuly 22, 2025
ExpirationJuly 22, 2026
CountyCook
License Number5102261

Ownership & Operating Entity

The Selfhelp Home Senior Living Community is legally operated by The Selfhelp Home, Inc..

Staffing

Key information about the people who lead and staff this community.

Leadership

ContactMs. Sheila Bogen, Executive Director

Memory & Specialized Care

1 service
Does not offer Alzheimer's Care

Contact Information

Contact The Selfhelp Home Senior Living Community

Inspection History

In Illinois, the Department of Public Health, Office of Health Care Regulation conducts annual unannounced surveys to assess compliance with state and federal healthcare facility standards.

Since 2022 · 4 years of data 25 deficiencies 2 inspections

Inspection Scorecard Info This scorecard compares key inspection, citation, and complaint metrics at this facility against the Illinois state average. Metrics rated ≥15% worse than average are highlighted in red; those ≥15% better are highlighted in green.

Since 2022 vs. Illinois state average
Overall vs. IL average 3 Worse Metrics worse than Illinois average:
• Total deficiencies (257% above)
• Deficiencies per year (250% above)
• Deficiencies per inspection (1289% above)
1 Better Metrics better than Illinois average:
• Total inspections (75% below)
Latest Inspection July 5, 2025

Deficiencies Info Deficiencies are formal regulatory issues recorded during state inspections.

This FacilityIL Averagevs. IL Avg
Total deficiencies Info Formal regulatory issues recorded by inspectors across all inspection types. 257 This facility has 257% more total deficiencies than a typical Illinois nursing home (25 vs. IL avg 7).↑ 257% worse
Deficiencies per year Info Average deficiencies per year since 2022. 6.31.8 This facility has 250% more deficiencies per year than a typical Illinois nursing home (6.3 vs. IL avg 1.8).↑ 250% worse
Deficiencies per inspection Info Average deficiencies per inspection. 12.50.9 This facility has 1289% more deficiencies per inspection than a typical Illinois nursing home (12.5 vs. IL avg 0.9).↑ 1289% worse

Inspections Info State inspections evaluate whether the facility meets health and safety standards.

This FacilityIL Averagevs. IL Avg
Total inspections Info Combined count of all routine and focused inspections. Excludes complaint investigations. 28 This facility has 75% fewer total inspections than a typical Illinois nursing home (2 vs. IL avg 8).↓ 75% better

Inspection Reports Summary Info An editor-reviewed summary of the themes and findings across this facility's recent inspection reports.

  • August 11, 2024 inspection found 12 deficiencies including medication errors, infection control lapses, failure to maintain resident dignity with catheter care, and improper oxygen equipment labeling.
  • September 6, 2023 complaint investigation confirmed failure to follow fall protocol and provide supervision, resulting in a resident’s serious hip fracture requiring surgery.
  • May 12, 2023 routine survey cited 9 deficiencies including unsecured controlled medications, expired medications and food, inaccurate records, and incomplete COVID-19 vaccination documentation.

Health Inspection History

Inspections since 2022
Total health inspections 4

Illinois average 10.4


Last Health inspection on Aug 2024

Total health citations
21 Rank #45 / 172Health citations — State benchmarkedThis home is ranked 45th out of 172 homes in Illinois. Shows this facility's total health deficiency citations benchmarked to the Illinois State average, with a ranking across all 172 IL facilities. Lower citation counts earn a better rank.Ranking totals vary by category as each rank only includes facilities that report data for that metric. Homes missing that data point aren't included in the ranking.Click the rank badge to see the full State ranking.Click here to see the full State ranking.

Illinois average 36.8

Citations per inspection
5.25 Rank #154 / 172Citations per inspection — State benchmarkedThis home is ranked 154th out of 172 homes in Illinois. Shows average deficiency citations per CMS inspection for this facility versus the Illinois mean across 172 facilities with citation data. Lower is better.Ranking totals vary by category as each rank only includes facilities that report data for that metric. Homes missing that data point aren't included in the ranking.Click the rank badge to see the full State ranking.Click here to see the full State ranking.

Illinois average 3.68


Health citations are formal notices following inspections when they fail to comply with safety and care standards.

20 of 21 citations resulted from standard inspections; and 1 of 21 resulted from complaint investigations.

Breakdown of citation severity (last 4 years)
Critical health citations
0
100% better than Illinois average

Illinois average: 0.7


Serious health citations
1
72% better than Illinois average

Illinois average: 3.6

0 critical citations Illinois average: 0.7

1 serious citation Illinois average: 3.6

20 moderate citations Illinois average: 32

0 minor citations Illinois average: 0.5
Citations history (last 4 years)
Infection Control moderate citation Aug 14, 2024
Corrected

Nursing Services moderate citation Aug 14, 2024
Corrected

Nutrition moderate citation Aug 14, 2024
Corrected

Pharmacy moderate citation Aug 14, 2024
Corrected

Staffing Data

Reporting period: October 1 – December 31, 2025 (Q4 2025). Source: CMS Payroll-Based Journal report.

Total staff 108
Employees 97
Contractors 11
Staff to resident ratio 2.00 : 1
11% more staff per resident than Illinois average
Illinois average ratio: 1.80 : 1 Illinois average ratio: 1.80 : 1See full Illinois ranking
Avg staff/day 48
Average shift 7 hours
8% worse than Illinois average
Illinois average: 7.6 hours Illinois average shift: 7.6 hoursSee full Illinois ranking
Total staff hours (quarter) 30,920

Nursing staff breakdown

Q4 2025 · Oct 1 – Dec 31 More info This data comes from the CMS Payroll-Based Journal report covering October 1 – December 31, 2025.
Registered Nurse

Manages medical care and health needs.

RN Staff Info All 22 RN Staff are full-time employees. No contractors work on this role. 22
Average shift length Info Average shift length. Calculated as total hours divided by days worked and average staff per day. 7 hours
Licensed Practical Nurse

Assists with medical care and medications.

LPN Staff Info All 10 LPN Staff are full-time employees. No contractors work on this role. 10
Average shift length Info Average shift length. Calculated as total hours divided by days worked and average staff per day. 5.4 hours
Certified Nursing Assistant

Helps with daily care and mobility.

CNA Staff Info All 51 CNA Staff are full-time employees. No contractors work on this role. 51
Average shift length Info Average shift length. Calculated as total hours divided by days worked and average staff per day. 7.5 hours

Contractor staffing

Q4 2025 · Oct 1 – Dec 31 More info This data comes from the CMS Payroll-Based Journal report covering October 1 – December 31, 2025.

Total hours from contractors

5.4%

1,667 contractor hours this quarter

Speech Language Pathologist: 4 Physical Therapy Assistant: 2 Occupational Therapy Assistant: 1 Physical Therapy Aide: 1 Qualified Social Worker: 1 Respiratory Therapy Technician: 1 Occupational Therapy Aide: 1

Staff by category

Q4 2025 · Oct 1 – Dec 31 More info This data comes from the CMS Payroll-Based Journal report covering October 1 – December 31, 2025.
Certified Nursing Assistant5105116,24092100%7.5
Registered Nurse220226,43592100%7
Licensed Practical Nurse100101,8059199%5.4
Dietitian4041,5208491%7.6
Clinical Nurse Specialist4041,1128896%6.2
Mental Health Service Worker2028246166%8.9
Administrator1014645863%8
Nurse Practitioner1014645863%8
Speech Language Pathologist0444376975%6.1
Respiratory Therapy Technician0114306571%6.6
RN Director of Nursing1013756065%6.3
Physical Therapy Assistant0223476267%5.6
Physical Therapy Aide0113026368%4.8
Qualified Social Worker011893942%2.3
Occupational Therapy Aide011462123%2.2
Occupational Therapy Assistant0111622%8
Medical Director101131112%1.2
51 Certified Nursing Assistant
% of Days 100%
22 Registered Nurse
% of Days 100%
10 Licensed Practical Nurse
% of Days 99%
4 Dietitian
% of Days 91%
4 Clinical Nurse Specialist
% of Days 96%
2 Mental Health Service Worker
% of Days 66%
1 Administrator
% of Days 63%
1 Nurse Practitioner
% of Days 63%
4 Speech Language Pathologist
% of Days 75%
1 Respiratory Therapy Technician
% of Days 71%
1 RN Director of Nursing
% of Days 65%
2 Physical Therapy Assistant
% of Days 67%
1 Physical Therapy Aide
% of Days 68%
1 Qualified Social Worker
% of Days 42%
1 Occupational Therapy Aide
% of Days 23%
1 Occupational Therapy Assistant
% of Days 2%
1 Medical Director
% of Days 12%

Penalties and fines

Federal penalties imposed by CMS for regulatory violations, including civil money penalties (fines) and denials of payment for new Medicare/Medicaid admissions.

Source: CMS Penalties Database

No penalties in the past 3 years

No civil money penalties or payment denials were reported in the last 3 years.

Quality of care over time

These measures show how residents usually do over time at this home, based on health outcomes and preventive care.

High-risk clinical events score Info A composite score based on pressure ulcers, falls with injury, weight loss, walking ability decline, and activities of daily living decline. 9.3
In line with Illinois average

Illinois average: 9.7

Functional decline score Info A composite score based on activities of daily living decline, walking ability decline, and incontinence. 12.8
31% better than Illinois average

Illinois average: 18.6

Long-stay resident measures
Above average Illinois avg: 3.6 Info CMS star rating based on long-stay quality measure performance. 5 stars = significantly above average, 1 star = significantly below average.
Need for Help with Daily Activities Increased Info Percent of long-stay residents whose need for help with daily activities has increased 6.1%
61% better than Illinois average

Illinois average: 15.5%

Walking Ability Worsened Info Percent of long-stay residents whose ability to move independently worsened 19.5%
6% worse than Illinois average

Illinois average: 18.4%

Low Risk Residents with Bowel/Bladder Incontinence Info Percent of low risk long-stay residents who lose control of their bowels or bladder 12.8%
41% better than Illinois average

Illinois average: 21.6%

Falls with Major Injury Info Percent of long-stay residents experiencing one or more falls with major injury 0.0%
100% better than Illinois average

Illinois average: 3.4%

High Risk Residents with Pressure Ulcers Info Percent of long-stay high risk residents with pressure ulcers 4.5%
15% better than Illinois average

Illinois average: 5.3%

Urinary Tract Infection Info Percent of long-stay residents with a urinary tract infection 6.8%
274% worse than Illinois average

Illinois average: 1.8%

Lost Too Much Weight Info Percent of long-stay residents who lose too much weight 16.3%
149% worse than Illinois average

Illinois average: 6.5%

Depressive Symptoms Info Percent of long-stay residents who have depressive symptoms 10.7%
78% better than Illinois average

Illinois average: 48.1%

Antipsychotic Use Info Percent of long-stay residents who received an antipsychotic medication 19.3%
5% better than Illinois average

Illinois average: 20.2%

Pneumococcal Vaccine Info Percent of long-stay residents assessed and appropriately given the pneumococcal vaccine 100.0%
12% better than Illinois average

Illinois average: 89.2%

Influenza Vaccine Info Percent of long-stay residents assessed and appropriately given the seasonal influenza vaccine 91.1%
In line with Illinois average

Illinois average: 91.6%

Hospitalizations per 1,000 days Info Number of hospitalizations per 1,000 long-stay resident days. 2.61
27% worse than Illinois average

Illinois average: 2.05

ED visits per 1,000 days Info Number of outpatient emergency department visits per 1,000 long-stay resident days. 0.82
64% better than Illinois average

Illinois average: 2.25

Short-stay resident measures
Significantly above average Illinois avg: 2.3 Info CMS star rating based on short-stay quality measure performance. 5 stars = much above average, 1 star = much below average.
Pneumococcal Vaccine Info Percent of short-stay residents assessed and appropriately given the pneumococcal vaccine 97.0%
42% better than Illinois average

Illinois average: 68.3%

Antipsychotic medication increase Info Percent of short-stay residents who newly received an antipsychotic medication 0.9%
61% better than Illinois average

Illinois average: 2.3%

Influenza Vaccine Info Percent of short-stay residents assessed and appropriately given the seasonal influenza vaccine 55.7%
12% worse than Illinois average

Illinois average: 63.0%

Re-hospitalized after SNF stay Info Percentage of short-stay residents who were re-hospitalized after their nursing home admission. 22.1%
16% better than Illinois average

Illinois average: 26.2%

Emergency department visits Info Percentage of short-stay residents who had an outpatient emergency department visit. 7.6%
46% better than Illinois average

Illinois average: 14.0%

Falls with major injury Info Percentage of SNF residents who experience falls with major injury during their stay. 0.7%
16% better than Illinois average

Illinois average: 0.8%

Ability to care for self at discharge Info Percentage of residents at or above expected ability to care for themselves at discharge. 44.2%
18% worse than Illinois average

Illinois average: 53.7%

Successful return to home or community Info Rate of successful return to home or community from a skilled nursing facility. 69.8%
38% better than Illinois average

Illinois average: 50.6%

Breakdown by payment type

Medicare

39% of new residents, usually for short-term rehab.

Typical stay 23 days

Private pay

57% of new residents, often for short stays.

Typical stay 2 - 3 months

Medicaid

4% of new residents, often for long-term daily care.

Typical stay 2 - 3 months

Facility Characteristics

Source: CMS Long-Term Care Facility Characteristics (Data as of Jan 2026)

Total residents 54
Medicare
12
22.2% of residents
Medicaid
12
22.2% of residents
Private pay or other
30
55.6% of residents
Programs & Services
Residents Group

Residents meet regularly to discuss policies, care quality, and activities

Active Resident Council

Organized group of residents that meets regularly to discuss facility policies, quality of life, and activities.

Finances and operations

Based on CMS SNF Cost Report for fiscal year ending in 09/2023.

Governmental community
Operated by a subsidized facility district.
Net patient revenue Info Net patient revenue — what the home actually collects for resident care, after contractual allowances, bad debt and discounts are subtracted from its gross charges (CMS cost report, Worksheet G-3). It covers resident care only; money the home earns from other sources is shown separately as "Other income."
$9.3M
Net patient income Info Net patient income: net patient revenue minus the home's total operating expenses. A positive figure means it earns more from resident care than it spends to deliver it; a negative figure means the opposite. It excludes non-operating "other income."
-$1.6M
Governmental community Operated by a subsidized facility district.
Net patient revenue Info Net patient revenue — what the home actually collects for resident care, after contractual allowances, bad debt and discounts are subtracted from its gross charges (CMS cost report, Worksheet G-3). It covers resident care only; money the home earns from other sources is shown separately as "Other income."
$9.3M Rank #78 / 171Revenue — State benchmarkedThis home is ranked 78th out of 171 homes in Illinois. Shows this facility's annual revenue compared to the Illinois average. Higher revenue generally means more resources for staffing and capital — read alongside Payroll %.Ranking totals vary by category as each rank only includes facilities that report data for that metric. Homes missing that data point aren't included in the ranking.Click the rank badge to see the full State ranking.Click here to see the full State ranking.
Net patient income Info Net patient income: net patient revenue minus the home's total operating expenses. A positive figure means it earns more from resident care than it spends to deliver it; a negative figure means the opposite. It excludes non-operating "other income."
-$1.6M
Other income Info Money the home earns outside of resident care — such as investments, grants, rentals and other non-operating sources (CMS cost report, Worksheet G-3). It is tracked separately from net patient revenue: it is not part of that figure, and it is not included in net patient income.
$3.4M
Payroll costs Info Staff salaries plus wage-related costs — benefits such as payroll taxes, health insurance and retirement — from the home's own accounting records (CMS cost report, Worksheet A). Contract or agency labor is counted separately, under other operating costs. Rank #73 / 171Payroll — State benchmarkedThis home is ranked 73rd out of 171 homes in Illinois. Shows total annual staff payroll benchmarked to the Illinois average. Higher payroll investment relative to peers often signals better staffing and less reliance on cheaper contract labor.Ranking totals vary by category as each rank only includes facilities that report data for that metric. Homes missing that data point aren't included in the ranking.Click the rank badge to see the full State ranking.Click here to see the full State ranking.
$7.0M 75.3% of net patient revenue Info Payroll as a share of revenue: staff salaries and wage-related benefits divided by net patient revenue. A higher figure means more of each revenue dollar goes to staff pay. Rank #70 / 171Payroll % — State benchmarkedThis home is ranked 70th out of 171 homes in Illinois. Shows payroll as a percentage of revenue versus the Illinois average. Well-run Illinois facilities typically land around 54–67% — the top third Statewide. Below 25% may signal understaffing or heavy agency use — read with Staffing ratings.Ranking totals vary by category as each rank only includes facilities that report data for that metric. Homes missing that data point aren't included in the ranking.Click the rank badge to see the full State ranking.Click here to see the full State ranking.
Other operating costs Info Everything it costs to run the home apart from payroll — food, utilities, supplies, maintenance, contract labor and administration. Calculated as total operating expense minus payroll (staff salaries and wage-related benefits).
$3.9M
Total costs Info The home's total operating expense for the year — all the costs of running it, salaries included (CMS cost report, Worksheet G-3).
$10.9M

What does this home offer?

Housing options icon

Housing Options: Studio / 1 Bed

Building type icon
Building type icon

Building Type: Mid-rise

Housekeeping icon
Housekeeping icon

Housekeeping Services

Recreational activities icon

Recreational Activities

Exercise program icon

Exercise Programs

Transportation services icon

Transportation Services

Who this home usually serves

TYPE OF STAY

Mix of rehab and long-term care

This home supports both short-term rehab and long-term care, with residents staying for a wide range of durations.

Most new residents arrive under private pay (57% of admissions), and a typical private pay stay runs around 2 - 3 months.

Admissions
391 total

Coverage residents most often arrive under.

Medicare 39%
Private pay 57%
Medicaid 4%
Discharges
239 total

Coverage residents most often leave under.

Medicare 64%
Private pay 34%
Medicaid 2%

The Selfhelp Home Senior Living Community Home Overview

Get to know the community with a high-definition video tour
Watch this video about life at The Selfhelp Home Senior Living Community
icon

Places of interest near The Selfhelp Home Senior Living Community

Address 8.1 miles from city center Info Estimated distance in miles from Chicago's city center to The Selfhelp Home Senior Living Community's address, calculated via Google Maps.

Calculate Travel Distance to The Selfhelp Home Senior Living Community

Add your location

Address

Compare Nursing Home around Chicago

The information below is reported by the Illinois Department of Public Health, Office of Health Care Regulation.

5 facilities compared · CMS & IL Dept. of Health data

The Selfhelp Home Senior Living Community
NH
AL
IL
RC
Chicago (Uptown)
72
Facility 72
IL AVG 86
Rank #209 / 426
81.9%
Facility 81.9%
IL AVG 69.3%
Rank #74 / 204
+18%
5.56
Facility 5.56
IL AVG 3.10
Rank #8 / 172
+44%+79%
$0
Facility $0
IL AVG $151.3k
Rank #1 / 173
21
Facility 21
IL AVG 36.8
Rank #45 / 172
5.3
Facility 5.3
IL AVG 3.7
Rank #154 / 172
155A+
92
Facility 92
IL AVG 51
Rank #28 / 648
Marvin Rubin
$9.3M
Facility $9.3M
IL AVG $12.2M
Rank #78 / 171
$7.0M
Facility $7.0M
IL AVG $4.8M
Rank #73 / 171
75.3%
Facility 75.3%
IL AVG 44.3%
Rank #70 / 171
146009
Encore Village of Schaumburg
NH
AL
IL
MC
Schaumburg
109
Facility 109
IL AVG 86
Rank #108 / 426
55.4%
Facility 55.4%
IL AVG 69.3%
Rank #169 / 204
-20%
3.46
Facility 3.46
IL AVG 3.10
Rank #54 / 172
+8%+12%
$25.5k
Facility $25.5k
IL AVG $151.3k
Rank #94 / 173
28
Facility 28
IL AVG 36.8
Rank #69 / 172
2.6
Facility 2.6
IL AVG 3.7
Rank #28 / 172
2105A+
58
Facility 58
IL AVG 51
Rank #253 / 648
Il Ccrc, LLC
$16.2M
Facility $16.2M
IL AVG $12.2M
Rank #1 / 171
$15.9M
Facility $15.9M
IL AVG $4.8M
Rank #4 / 171
98.3%
Facility 98.3%
IL AVG 44.3%
Rank #171 / 171
145341
Admiral at the Lake
NH
AL
IL
MC
Chicago (Uptown)
56
Facility 56
IL AVG 86
Rank #278 / 426
88.6%
Facility 88.6%
IL AVG 69.3%
Rank #40 / 204
+28%
4.93
Facility 4.93
IL AVG 3.10
Rank #19 / 172
-22%+59%
$0
Facility $0
IL AVG $151.3k
Rank #1 / 173
26
Facility 26
IL AVG 36.8
Rank #62 / 172
5.2
Facility 5.2
IL AVG 3.7
Rank #150 / 172
131A+
90
Facility 90
IL AVG 51
Rank #40 / 648
Nadia Geigler
$4.4M
Facility $4.4M
IL AVG $12.2M
Rank #39 / 171
$10.6M
Facility $10.6M
IL AVG $4.8M
Rank #36 / 171
242.3%
Facility 242.3%
IL AVG 44.3%
Rank #113 / 171
146165
Smith Village
NH
AL
IL
MC
Chicago (South Side)
82
Facility 82
IL AVG 86
Rank #171 / 426
85.4%
Facility 85.4%
IL AVG 69.3%
Rank #57 / 204
+23%
5.28
Facility 5.28
IL AVG 3.10
Rank #10 / 172
+4%+70%
$0
Facility $0
IL AVG $151.3k
Rank #1 / 173
20
Facility 20
IL AVG 36.8
Rank #42 / 172
3.3
Facility 3.3
IL AVG 3.7
Rank #69 / 172
466A+
71
Facility 71
IL AVG 51
Rank #147 / 648
The Washington And Jane Smith Home
$11.0M
Facility $11.0M
IL AVG $12.2M
Rank #31 / 171
$8.0M
Facility $8.0M
IL AVG $4.8M
Rank #24 / 171
72.5%
Facility 72.5%
IL AVG 44.3%
Rank #108 / 171
145904
Montgomery Place
NH
AL
IL
MC
Chicago (East Hyde Park)
40
Facility 40
IL AVG 86
Rank #350 / 426
35.0%
Facility 35.0%
IL AVG 69.3%
Rank #189 / 204
-49%
4.00
Facility 4.00
IL AVG 3.10
Rank #42 / 172
+31%+29%
$51.6k
Facility $51.6k
IL AVG $151.3k
Rank #107 / 173
30
Facility 30
IL AVG 36.8
Rank #79 / 172
4.3
Facility 4.3
IL AVG 3.7
Rank #132 / 172
114A+
82
Facility 82
IL AVG 51
Rank #98 / 648
Margo Brooks Pugh
$13.8M
Facility $13.8M
IL AVG $12.2M
Rank #70 / 171
$6.9M
Facility $6.9M
IL AVG $4.8M
Rank #69 / 171
49.7%
Facility 49.7%
IL AVG 44.3%
Rank #86 / 171
145748

Financial Assistance for
Nursing Home in Illinois

The Selfhelp Home Senior Living Community is located in Chicago, Illinois.
Here are the financial assistance programs available to residents in Illinois.

Get Financial aid guidance

Community Care Program

Illinois CCP

Age 60+
General Illinois resident, at risk of nursing home placement.
Income Limits (2025) ~$1,215/month individual
Asset Limits $17,500 individual, excludes home, car
IL

High demand in urban areas; waitlists possible.

Benefits
In-home care (3-5 hours/day) Adult day services ($65/day) Emergency home response systems ($30/month)

Illinois Respite Program

IL Respite (via NFCSP)

Age Caregiver of someone 60+ (or with dementia)
General Illinois resident.
Income Limits No strict limit; prioritizes low-income.
Asset Limits Not applicable.
IL

Limited slots; urban/rural balance.

Benefits
In-home respite (4-6 hours/day) Adult day care (~$65/day) Short-term facility care (up to 5 days)

Supportive Living Program (SLP)

Illinois Medicaid Supportive Living Program

Age 65+ or 22-64 with disability
General Illinois resident, Medicaid-eligible, needs moderate assistance (not nursing home-level).
Income Limits (2025) ~$2,829/month (300% FBR, individual); QIT allowed.
Asset Limits $2,000 (individual), $3,000 (couple) (excludes home, car).
IL

~200 SLP sites statewide; room/board not covered.

Benefits
Personal care (5-7 hours/day, e.g., bathing, mobility) Meals Housekeeping Medication management Respite (~240 hours/year)

Persons Who Are Elderly Waiver

Illinois Medicaid Elderly Waiver

Age 65+
General Illinois resident, Medicaid-eligible, nursing home-level care need.
Income Limits (2025) ~$2,829/month 300% FBR, individual
Asset Limits $2,000 (individual), $3,000 (couple).
IL

Part of HealthChoice Illinois; consumer-directed options available.

Benefits
Personal care (5-7 hours/day, e.g., dressing, eating) Homemaker Adult day care (~$60/day) Respite (240 hours/year) Home mods ($1,000 avg.)

Medicare Savings Program (MSP)

Illinois Medicare Savings Program

Age 65+ or disabled
General Illinois resident, Medicare Part A/B.
Income Limits (2025) ~$2,510/month (QMB), ~$3,380/month (SLMB), ~$3,598/month (QI)—individual.
Asset Limits $9,430 (individual), $14,130 (couple).
IL

Three tiers; no waitlist.

Benefits
Covers Part B premiums ($174.70/month) Deductibles ($240/year) Copays (~20%)

Optional State Supplementation (OSS)

Illinois Optional State Supplementation

Age 65+ or disabled
General Illinois resident, in approved facility, SSI recipient or low-income.
Income Limits (2025) ~$1,004/month including SSI
Asset Limits $2,000 (individual), $3,000 (couple).
IL

~$50-$500/month based on facility type.

Benefits
Cash (~$50-$500/month) for room/board in personal care homes or SLFs

VA Aid and Attendance (A&A) and Housebound Benefits

Illinois VA Aid and Attendance/Housebound

Age 65+ or disabled veteran/spouse
General Illinois resident, wartime service, need for ADL help (A&A) or homebound.
Income Limits (2025) Net income < ~$1,984/month (veteran with dependent, A&A); pension offsets income.
Asset Limits ~$155,356 net worth limit
IL

High veteran demand in urban/rural areas.

Benefits
Cash (~$1,433-$2,642/month veteran, ~$951-$1,318 spouse) for care costs (e.g., in-home, assisted living)

Frequently Asked Questions about The Selfhelp Home Senior Living Community

What neighborhood is The Selfhelp Home Senior Living Community in?

The Selfhelp Home Senior Living Community is in the Uptown neighborhood of Chicago.

Who is the owner of The Selfhelp Home Senior Living Community?

The legal owner and operator of The Selfhelp Home Senior Living Community is The Selfhelp Home, Inc..

Is The Selfhelp Home Senior Living Community in a walkable area?

The Selfhelp Home Senior Living Community has a walk score of 92. Walker's paradise. Daily errands do not require a car, with many shops and services nearby.

What is the license number of The Selfhelp Home Senior Living Community?

According to IL state health department records, The Selfhelp Home Senior Living Community's license number is 5102261.

When does The Selfhelp Home Senior Living Community's license expire?

According to IL state health department records, The Selfhelp Home Senior Living Community's license expires on July 22, 2026.

What is the occupancy rate at The Selfhelp Home Senior Living Community?

The Selfhelp Home Senior Living Community's occupancy is 75.6%.

What is the best email address for The Selfhelp Home Senior Living Community?

The team at The Selfhelp Home Senior Living Community can be reached at [email protected].

Guides for Better Senior Living

Care Cost Calculator: See Prices in Your Area

Nursing Home Data Explorer

Don’t Wait Too Long: 7 Red Flag Signs Your Parent Needs Assisted Living Now

The True Cost of Assisted Living in 2025 – And How Families Are Paying For It

Understanding Senior Living Costs: Pricing Models, Discounts & Financial Assistance