Ashton Place Health and Rehabilitation
Nursing Home & Assisted Living · Barling, AR
CMS overall rating Info CMS (the Centers for Medicare & Medicaid Services) is the federal agency that rates nursing home quality. Its Overall Rating runs from 1 to 5 stars, combining health inspections, staffing, and quality measures, with inspections weighted most heavily.

Ashton Place Health and Rehabilitation

Nursing Home & Assisted Living · Barling, AR
CMS overall rating Info CMS (the Centers for Medicare & Medicaid Services) is the federal agency that rates nursing home quality. Its Overall Rating runs from 1 to 5 stars, combining health inspections, staffing, and quality measures, with inspections weighted most heavily.
Calculator: See prices in your area
Ashton Place Health and Rehabilitation accepts Medicare, Medicaid, and private pay.

Overview of Ashton Place Health and Rehabilitation

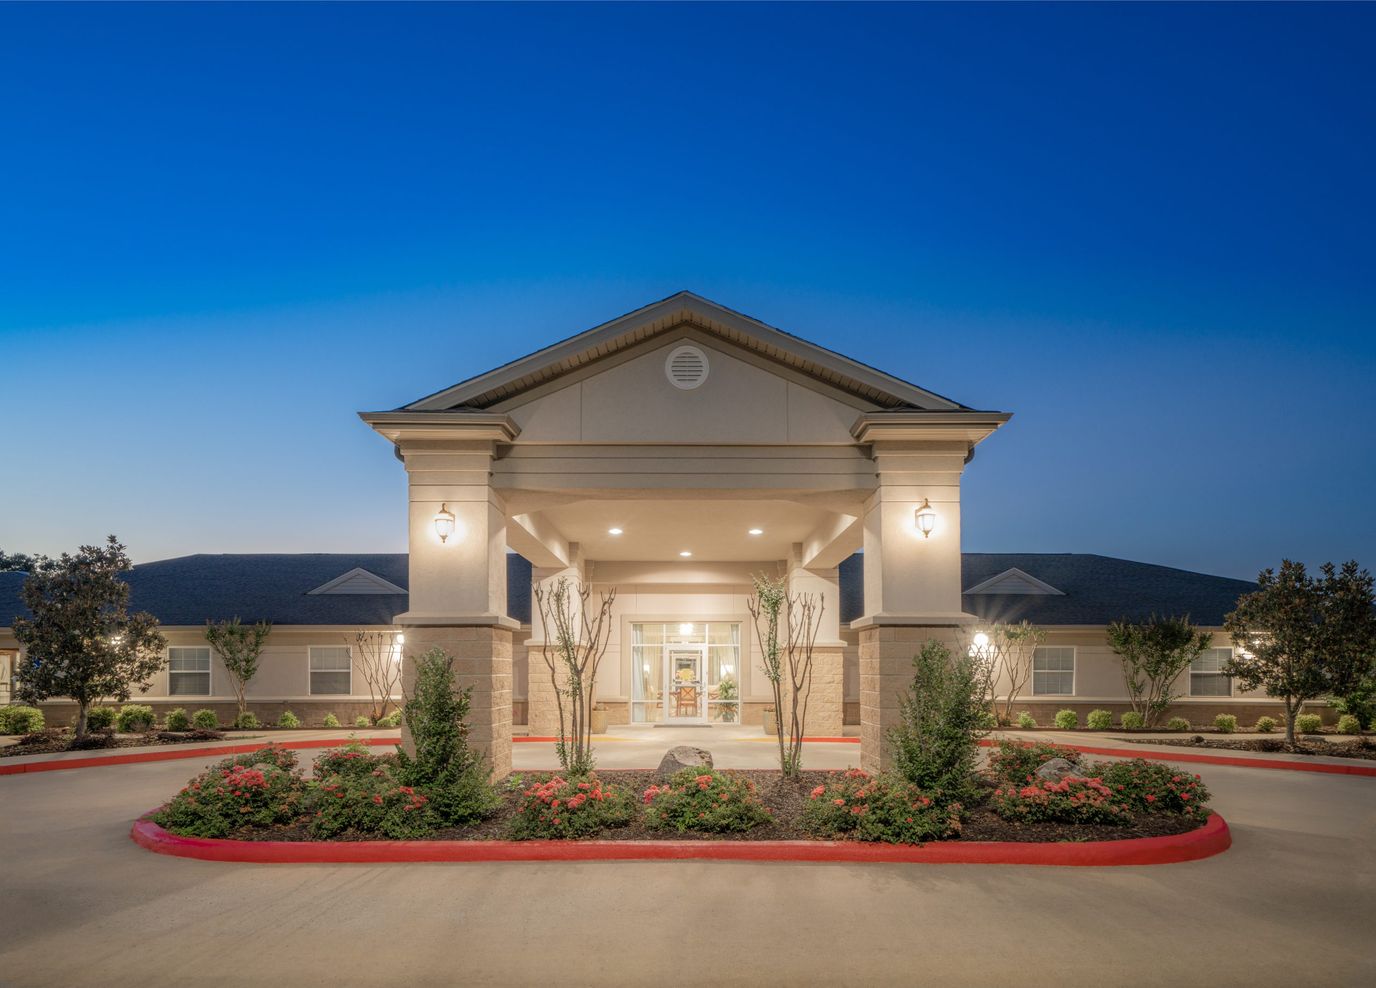
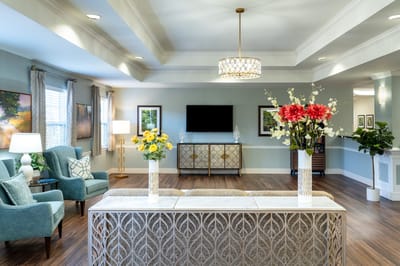
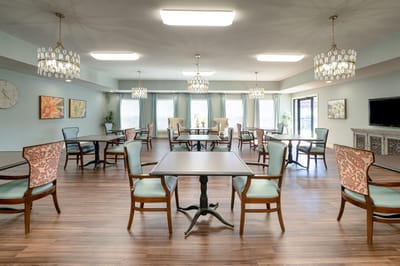
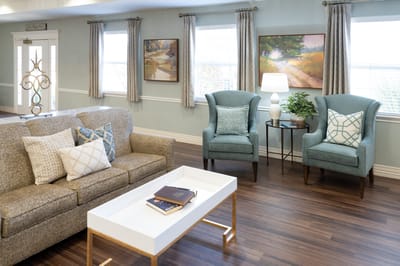
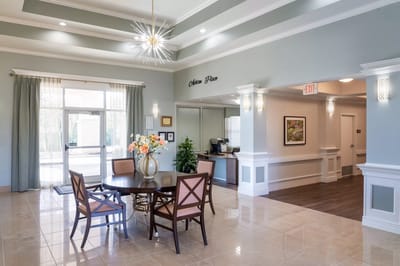
Ashton Place Health and Rehabilitation is a remarkable home nestled in Barling, Arkansas, that boasts a plethora of exceptional offerings. From short-term rehabilitation services to long-term care and respite care, they have it all. Every aspect of this community is thoughtfully curated to radiate warm comfort and elevate the senior living experience. Step inside and be greeted by a light-filled interior, creating an environment where seniors can truly enjoy mundane experiences.

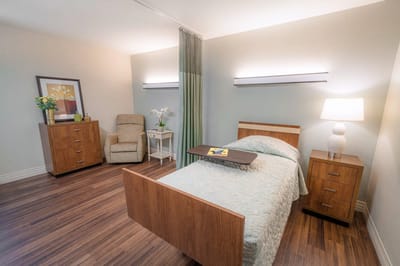
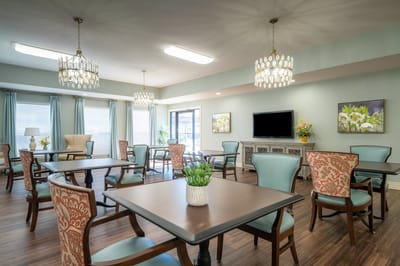
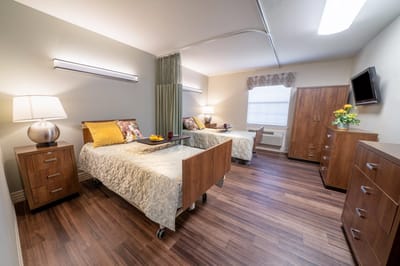
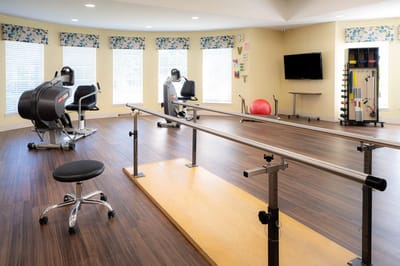
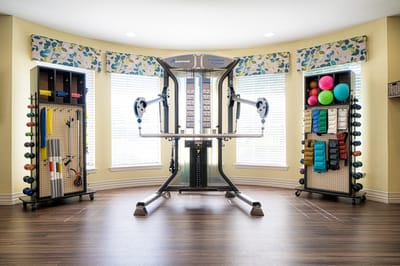
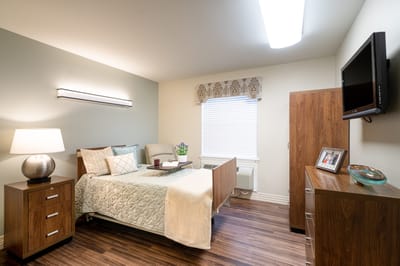
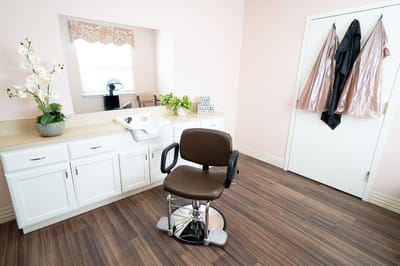
The home also goes above and beyond with its outdoor spaces, offering breathtaking surroundings that invite residents to bask in nature’s beauty. The amenities provided are equally impressive, including a state-of-the-art rehabilitation gym, free Wi-Fi for staying connected, luxurious Tempur-Pedic mattresses for utmost comfort, and even beauty salon services to enhance well-being and confidence. From social gatherings to stimulating events, residents are encouraged to embrace new experiences and create meaningful connections. The accommodations are nothing short of exceptional as well, with both private and semi-private options available. Every detail is designed to provide the utmost comfort and privacy, ensuring a premier senior living experience that surpasses expectations.

Quality ratings

Measured by Centers for Medicare & Medicaid Services (CMS)

Overall rating Info The Overall CMS Rating combines results from health inspections, staffing levels and quality measures. Health inspections carry the most weight. Staffing and quality scores can increase or decrease the final rating based on performance compared to state and national standards.
▲ 27.5% Above AR avg. ▲ 27.5% Above AR avg.AR average: 3.1Click the badge to see the full State ranking.Click here to see the full State ranking.
Health Inspection Info Based on the results of the facility's three most recent standard inspections and any complaint investigations. CMS reviews the number, scope, and severity of deficiencies, with more recent findings weighted more heavily.
▲ 38.4% Above AR avg. ▲ 38.4% Above AR avg.AR average: 2.9Click the badge to see the full State ranking.Click here to see the full State ranking.
Staffing Info Measures average nursing staff hours per resident per day, including Registered Nurses (RNs) and total nursing staff. Ratings are adjusted based on the level of care residents require and are compared to state and national benchmarks.
▲ 25.6% Above AR avg. ▲ 25.6% Above AR avg.AR average: 3.2Click the badge to see the full State ranking.Click here to see the full State ranking.
Quality Measures Info Based on clinical and physical health indicators reported to CMS, such as hospital readmissions, falls, pressure ulcers, and improvements in mobility. These measures reflect how well residents' health needs are being managed.
▲ 9.3% Above AR avg. ▲ 9.3% Above AR avg.AR average: 3.7Click the badge to see the full State ranking.Click here to see the full State ranking.

Staffing hours breakdown

Info Daily nursing hours per resident by staff type, reported to CMS. Higher is generally better — compare this facility to state and national averages to see where staffing stands.

Hours per resident per day — compared to Arkansas state averages

Total nursing care / resident Info Total adjusted nursing hours per resident per day, combining RN, LPN, and aide time. CMS adjusts this for case-mix so facilities can be fairly compared.
5h 7m per day
This facility Arkansas avg (4h 40m per day)
vs Arkansas avg
+10%

3 of 6 metrics below state avg

Standout metric Nurse Aide is +20% above state avg
Staff typeHours / Day / Residentvs state avg
Registered Nurse (RN) Info RNs hold the highest nursing license and can assess residents, interpret test results, and direct care plans. More RN hours per day often signals stronger clinical oversight and faster response to health changes. 19m per day ▼ 21% State avg: 24m per day · National avg: 41m per day
LPN / LVN Info Licensed Practical Nurses (LPNs) or Licensed Vocational Nurses (LVNs) deliver routine hands-on care — medication administration, wound dressing, and monitoring vital signs. They work under RN supervision and make up a large share of daily bedside care. 1h 6m per day ▲ 14% State avg: 58m per day · National avg: 52m per day
Nurse Aide Info Certified Nurse Aides (CNAs) provide the most direct day-to-day assistance: bathing, dressing, feeding, and mobility. Nurse aide hours are typically the largest staffing category and directly affect residents' quality of life. 3h 18m per day ▲ 20% State avg: 2h 45m per day · National avg: 2h 20m per day
Weekend Total Nursing Info Combined nursing hours (RN + LPN + Nurse Aide) per resident per day on weekends. Staffing often drops on weekends — this figure reveals whether the facility maintains adequate coverage outside of weekday hours. 3h 57m per day ▲ 12% State avg: 3h 32m per day · National avg: 3h 27m per day
Physical Therapist Info Hours per resident per day provided by licensed Physical Therapists (PTs) or PT Assistants. PT services help residents recover mobility after injury or illness and are especially important for post-acute (short-stay) rehabilitation. 1m per day ▼ 16% State avg: 2m per day · National avg: 4m per day
Weekend RN Info Registered nurse hours specifically on weekends. Facilities sometimes reduce RN presence on Saturdays and Sundays — a low weekend RN figure compared to weekday hours can indicate reduced clinical oversight when most administrative staff are absent. 9m per day ▼ 44% State avg: 16m per day · National avg: 29m per day

Capacity and availability

Avg. Length of Stay
135 days
Bed community size
122-bed community Rank #53 / 330Bed count — State benchmarkedThis home is ranked 53rd out of 330 homes in Arkansas. Shows this facility's certified or reported bed count compared to other Arkansas facilities. Larger communities may offer more amenities, programs, and on-site services for residents and families.Rankings are based only on facilities in Arkansas that report data for that category. Facilities without available data are excluded from the ranking.Click the rank badge to see the full State ranking.Click here to see the full State ranking.
A larger shared setting that may offer more common spaces and organized community services.
Walk Score
Walk Score: 19 / 100 Rank #299 / 419Walk Score — State benchmarkedThis home is ranked 299th out of 419 homes in Arkansas. Shows how walkable this facility's neighborhood is compared to the average Walk Score across Arkansas facilities. Higher scores benefit residents, families, and staff.Rankings are based only on facilities in Arkansas that report data for that category. Facilities without available data are excluded from the ranking.Click the rank badge to see the full State ranking.Click here to see the full State ranking.
Car-dependent. Most errands require a car, with limited nearby walkable options.

About this community

Occupancy

Occupancy rate
93%
Higher than the Arkansas average: 71.3%
Occupied beds
113 / 122
Average occupied beds in Arkansas homes 77 beds

License Details

Facility TypeSkilled Nursing Facility With Dual Certified Beds (medicaid / Medicare)
CountySebastian
Business TypeLimited Liability Company
CMS Certification Number45419
Certification TypeMedicaid / Medicare

Ownership & Operating Entity

Ashton Place Health and Rehabilitation is legally operated by Ashton Place Health and Rehab, LLC, and administered by Kristi Terry.

Type Of Units

Medicaid and Medicare
122 units
Total beds
122 units

Therapy & Rehabilitation

3 services
Rehabilitation Services
Respite Care
Short-Term Rehab

Staffing & Medical

2 services
Licensed Nurses/CNAs
24-Hour Staffing

Additional Services

1 service
Short Term Rehabilitation

Contact Information

Fax479-452-8183

Amenities & Lifestyle

Private And Semi-Private Accommodations
Physical
Occupational
And Speech Therapy Services
State Of The Art Rehabilitation Gym
Planned Activities Daily
Free Wireless Internet
Tempur-Pedic Mattresses
Private Dining Room For Family Events
Beauty Salon Services
ActivitiesPlanned Activities Daily

Contact Ashton Place Health and Rehabilitation

Inspection History

In Arkansas, the Department of Human Services, Office of Long Term Care is authorized to conduct unannounced inspections and issue official quality of care reports for all senior living providers.

Health Inspection History

Inspections since 2022
Total health inspections 4

Arkansas average 4.2


Last Health inspection on Mar 2025

Total health citations
17

Arkansas average 21.8

Citations per inspection
4.25

Arkansas average 5.32


Health citations are formal notices following inspections when they fail to comply with safety and care standards.

16 of 17 citations resulted from standard inspections; and 1 of 17 resulted from complaint investigations.

Breakdown of citation severity (last 4 years)
Critical health citations
0
100% better than Arkansas average

Arkansas average: 0.4


Serious health citations
0
100% better than Arkansas average

Arkansas average: 0.2

0 critical citations Arkansas average: 0.4

0 serious citations Arkansas average: 0.2

16 moderate citations Arkansas average: 20.9

1 minor citation Arkansas average: 0.4
Citations history (last 4 years)
Infection Control moderate citation Mar 27, 2025
Corrected

Nutrition moderate citation Mar 27, 2025
Corrected

Quality of Care moderate citation Mar 27, 2025
Corrected

Environmental moderate citation Jan 05, 2024
Corrected

Staffing Data

Reporting period: October 1 – December 31, 2025 (Q4 2025). Source: CMS Payroll-Based Journal report.

Total staff 193
Employees 177
Contractors 16
Staff to resident ratio 1.74 : 1
10% more staff per resident than Arkansas average
Arkansas average ratio: 1.59 : 1 Arkansas average ratio: 1.59 : 1See full Arkansas ranking
Avg staff/day 73
Average shift 8.2 hours
0% compared with Arkansas average
Arkansas average: 8 hours Arkansas average shift: 8 hoursSee full Arkansas ranking
Total staff hours (quarter) 55,347

Nursing staff breakdown

Q4 2025 · Oct 1 – Dec 31 More info This data comes from the CMS Payroll-Based Journal report covering October 1 – December 31, 2025.
Registered Nurse

Manages medical care and health needs.

RN Staff Info All 8 RN Staff are full-time employees. No contractors work on this role. 8
Average shift length Info Average shift length. Calculated as total hours divided by days worked and average staff per day. 8.4 hours
Licensed Practical Nurse

Assists with medical care and medications.

LPN Staff Info All 35 LPN Staff are full-time employees. No contractors work on this role. 35
Average shift length Info Average shift length. Calculated as total hours divided by days worked and average staff per day. 9.7 hours
Certified Nursing Assistant

Helps with daily care and mobility.

CNA Staff Info All 92 CNA Staff are full-time employees. No contractors work on this role. 92
Average shift length Info Average shift length. Calculated as total hours divided by days worked and average staff per day. 8 hours

Contractor staffing

Q4 2025 · Oct 1 – Dec 31 More info This data comes from the CMS Payroll-Based Journal report covering October 1 – December 31, 2025.

Total hours from contractors

4.4%

2,443 contractor hours this quarter

Physical Therapy Aide: 4 Speech Language Pathologist: 4 Qualified Social Worker: 2 Respiratory Therapy Technician: 2 Clinical Nurse Specialist: 1 Physical Therapy Assistant: 1 Occupational Therapy Aide: 1 Occupational Therapy Assistant: 1

Staff by category

Q4 2025 · Oct 1 – Dec 31 More info This data comes from the CMS Payroll-Based Journal report covering October 1 – December 31, 2025.
Certified Nursing Assistant9209226,04692100%8
Licensed Practical Nurse3503510,67292100%9.7
Medication Aide/Technician200208,01592100%9.2
Clinical Nurse Specialist4152,00092100%8.5
Nurse Aide in Training7071,3128289%7.9
RN Director of Nursing3031,1207177%7.6
Registered Nurse8081,0016773%8.4
Speech Language Pathologist0447906773%4.9
Occupational Therapy Aide1127456874%9.1
Dental Services Staff1015416368%8.6
Other Dietary Services Staff1015076267%8.2
Administrator1014325459%8
Nurse Practitioner2023884953%7.9
Physical Therapy Aide0443866672%5.7
Dietitian1013764650%8.2
Physical Therapy Assistant0112766368%4.4
Mental Health Service Worker1012613033%8.7
Respiratory Therapy Technician0222455762%4.3
Qualified Social Worker0222155964%3.6
Occupational Therapy Assistant0112333%7.5
92 Certified Nursing Assistant
% of Days 100%
35 Licensed Practical Nurse
% of Days 100%
20 Medication Aide/Technician
% of Days 100%
5 Clinical Nurse Specialist
% of Days 100%
7 Nurse Aide in Training
% of Days 89%
3 RN Director of Nursing
% of Days 77%
8 Registered Nurse
% of Days 73%
4 Speech Language Pathologist
% of Days 73%
2 Occupational Therapy Aide
% of Days 74%
1 Dental Services Staff
% of Days 68%
1 Other Dietary Services Staff
% of Days 67%
1 Administrator
% of Days 59%
2 Nurse Practitioner
% of Days 53%
4 Physical Therapy Aide
% of Days 72%
1 Dietitian
% of Days 50%
1 Physical Therapy Assistant
% of Days 68%
1 Mental Health Service Worker
% of Days 33%
2 Respiratory Therapy Technician
% of Days 62%
2 Qualified Social Worker
% of Days 64%
1 Occupational Therapy Assistant
% of Days 3%

Penalties and fines

Federal penalties imposed by CMS for regulatory violations, including civil money penalties (fines) and denials of payment for new Medicare/Medicaid admissions.

Source: CMS Penalties Database

No penalties in the past 3 years

No civil money penalties or payment denials were reported in the last 3 years.

Quality of care over time

These measures show how residents usually do over time at this home, based on health outcomes and preventive care.

High-risk clinical events score Info A composite score based on pressure ulcers, falls with injury, weight loss, walking ability decline, and activities of daily living decline. 6.9
10% better than Arkansas average

Arkansas average: 7.7

Functional decline score Info A composite score based on activities of daily living decline, walking ability decline, and incontinence. 11.9
11% better than Arkansas average

Arkansas average: 13.3

Long-stay resident measures
Need for Help with Daily Activities Increased Info Percent of long-stay residents whose need for help with daily activities has increased 7.2%
37% better than Arkansas average

Arkansas average: 11.5%

Walking Ability Worsened Info Percent of long-stay residents whose ability to move independently worsened 15.8%
18% worse than Arkansas average

Arkansas average: 13.4%

Low Risk Residents with Bowel/Bladder Incontinence Info Percent of low risk long-stay residents who lose control of their bowels or bladder 12.6%
17% better than Arkansas average

Arkansas average: 15.1%

Falls with Major Injury Info Percent of long-stay residents experiencing one or more falls with major injury 2.8%
29% better than Arkansas average

Arkansas average: 3.9%

High Risk Residents with Pressure Ulcers Info Percent of long-stay high risk residents with pressure ulcers 5.2%
9% worse than Arkansas average

Arkansas average: 4.7%

Urinary Tract Infection Info Percent of long-stay residents with a urinary tract infection 0.0%
100% better than Arkansas average

Arkansas average: 1.3%

Lost Too Much Weight Info Percent of long-stay residents who lose too much weight 3.5%
30% better than Arkansas average

Arkansas average: 5.0%

Depressive Symptoms Info Percent of long-stay residents who have depressive symptoms 0.0%
100% better than Arkansas average

Arkansas average: 1.5%

Antipsychotic Use Info Percent of long-stay residents who received an antipsychotic medication 3.2%
70% better than Arkansas average

Arkansas average: 10.5%

Pneumococcal Vaccine Info Percent of long-stay residents assessed and appropriately given the pneumococcal vaccine 100.0%
6% better than Arkansas average

Arkansas average: 94.4%

Influenza Vaccine Info Percent of long-stay residents assessed and appropriately given the seasonal influenza vaccine 100.0%
In line with Arkansas average

Arkansas average: 96.2%

Short-stay resident measures
Pneumococcal Vaccine Info Percent of short-stay residents assessed and appropriately given the pneumococcal vaccine 99.8%
23% better than Arkansas average

Arkansas average: 80.9%

Antipsychotic medication increase Info Percent of short-stay residents who newly received an antipsychotic medication 0.0%
100% better than Arkansas average

Arkansas average: 1.5%

Influenza Vaccine Info Percent of short-stay residents assessed and appropriately given the seasonal influenza vaccine 98.9%
27% better than Arkansas average

Arkansas average: 77.7%

Breakdown by payment type

Medicare

46% of new residents, usually for short-term rehab.

Typical stay 1 - 2 months

Private pay

44% of new residents, often for short stays.

Typical stay 2 - 3 months

Medicaid

10% of new residents, often for long-term daily care.

Typical stay 3 years

Facility Characteristics

Source: CMS Long-Term Care Facility Characteristics (Data as of Jan 2026)

Total residents 111
Medicare
18
16.2% of residents
Medicaid
54
48.6% of residents
Private pay or other
39
35.1% of residents
Programs & Services
Residents Group

Residents meet regularly to discuss policies, care quality, and activities

Nurse Aide Training

State-approved Nurse Aide Training and Competency Evaluation Program on-site

Active Resident Council

Organized group of residents that meets regularly to discuss facility policies, quality of life, and activities.

Finances and operations

Based on CMS SNF Cost Report for fiscal year ending in 12/2023.

For-profit
Operated by a single business entity.
Net patient revenue Info Net patient revenue — what the home actually collects for resident care, after contractual allowances, bad debt and discounts are subtracted from its gross charges (CMS cost report, Worksheet G-3). It covers resident care only; money the home earns from other sources is shown separately as "Other income."
$15.3M
Net patient income Info Net patient income: net patient revenue minus the home's total operating expenses. A positive figure means it earns more from resident care than it spends to deliver it; a negative figure means the opposite. It excludes non-operating "other income."
$836.2K
For-profit Operated by a single business entity.
Net patient revenue Info Net patient revenue — what the home actually collects for resident care, after contractual allowances, bad debt and discounts are subtracted from its gross charges (CMS cost report, Worksheet G-3). It covers resident care only; money the home earns from other sources is shown separately as "Other income."
$15.3M
Net patient income Info Net patient income: net patient revenue minus the home's total operating expenses. A positive figure means it earns more from resident care than it spends to deliver it; a negative figure means the opposite. It excludes non-operating "other income."
$836.2K
Other income Info Money the home earns outside of resident care — such as investments, grants, rentals and other non-operating sources (CMS cost report, Worksheet G-3). It is tracked separately from net patient revenue: it is not part of that figure, and it is not included in net patient income.
$1.8K
Payroll costs Info Staff salaries plus wage-related costs — benefits such as payroll taxes, health insurance and retirement — from the home's own accounting records (CMS cost report, Worksheet A). Contract or agency labor is counted separately, under other operating costs.
$7.1M 46.6% of net patient revenue Info Payroll as a share of revenue: staff salaries and wage-related benefits divided by net patient revenue. A higher figure means more of each revenue dollar goes to staff pay.
Other operating costs Info Everything it costs to run the home apart from payroll — food, utilities, supplies, maintenance, contract labor and administration. Calculated as total operating expense minus payroll (staff salaries and wage-related benefits).
$7.3M
Total costs Info The home's total operating expense for the year — all the costs of running it, salaries included (CMS cost report, Worksheet G-3).
$14.5M

Who this home usually serves

TYPE OF STAY

Mostly short-term rehab stays

Most residents typically stay for a few weeks or months before returning home or moving on.

New residents most often arrive under Medicare (46% of admissions), and a typical Medicare stay runs around 1 - 2 months.

Admissions
255 total

Coverage residents most often arrive under.

Medicare 46%
Private pay 44%
Medicaid 10%
Discharges
306 total

Coverage residents most often leave under.

Medicare 50%
Private pay 38%
Medicaid 12%

Living Spaces & Floor Plans for Ashton Place Health and Rehabilitation

Studio Unit Townhome
Studio
1 Bedroom
1 Bedroom
2 Bedroom
2 bedroom

Places of interest near Ashton Place Health and Rehabilitation

Address 0.7 miles from city center Info Estimated distance in miles from Barling's city center to Ashton Place Health and Rehabilitation's address, calculated via Google Maps.

Calculate Travel Distance to Ashton Place Health and Rehabilitation

Add your location

Address

Financial Assistance for
Independent Living in Arkansas

Ashton Place Health and Rehabilitation is located in Barling, Arkansas.
Here are the financial assistance programs available to residents in Arkansas.

Get Financial aid guidance

ARChoices

Arkansas Medicaid ARChoices

Age 65+ or 21+ with disability
General Arkansas resident, Medicaid- eligible, nursing home-level care need.
Income Limits (2025) ~$2,829/month 300% FBR, individual
Asset Limits $2,000 (individual), $3,000 (couple).
AR

Rural focus; possible waitlists.

Benefits
Personal care (5-7 hours/day) Meals ($7/meal) Respite care (240 hours/year) Adult day services ($60/day)

Choices in Living Resource Center

Arkansas Choices in Living

Age 60+
General Arkansas resident.
Income Limits No strict limit; prioritizes low-income.
Asset Limits Not applicable.
AR

Limited direct funding; mostly referral-based.

Benefits
Care coordination Limited respite (up to 5 days/year) Transportation assistance (~5 trips/month)

Living Choices Assisted Living Waiver

Arkansas Medicaid Living Choices Assisted Living Waiver

Age 65+
General Arkansas resident, requires nursing home-level care, lives in a Level II assisted living facility.
Income Limits (2025) ~$2,829/month 300% FBR, individual
Asset Limits $2,000 (individual), $3,000 (couple); spousal rules apply.
AR

Limited provider network; excludes Level I facilities (no nursing services).

Benefits
Personal care (~5 hours/day) Medication management Nursing Activities Transportation

Program of All-Inclusive Care for the Elderly (PACE)

Arkansas Medicaid PACE

Age 55+
General Arkansas resident, nursing home-level care, safe with PACE support.
Income Limits (2025) ~$2,829/month 300% FBR
Asset Limits $2,000 (individual), $3,000 (couple).
AR

Limited geographic availability.

Benefits
Primary/preventive care Personal care (5-7 hours/day) Meals Transportation Therapy

Arkansas State Plan Personal Care

Arkansas Medicaid Personal Care Program

Age
General Any age, Arkansas resident, needs ADL/IADL help, Medicaid-eligible.
Income Limits (2025) ~$1,004/month individual
Asset Limits $9,660 (individual), $14,470 (couple).
AR

No nursing home-level care requirement.

Benefits
Personal care (~4-6 hours/day) Homemaker services (e.g., meal prep)

Frequently Asked Questions about Ashton Place Health and Rehabilitation

Who is the owner of Ashton Place Health and Rehabilitation?

Ashton Place Health and Rehabilitation is legally operated by Ashton Place Health and Rehab, LLC, and administered by Kristi Terry.

Is Ashton Place Health and Rehabilitation in a walkable area?

Ashton Place Health and Rehabilitation has a walk score of 19. Car-dependent. Most errands require a car, with limited nearby walkable options.

What is the occupancy rate at Ashton Place Health and Rehabilitation?

Ashton Place Health and Rehabilitation's occupancy is 93%.

Does Ashton Place Health and Rehabilitation have different floorplan options?

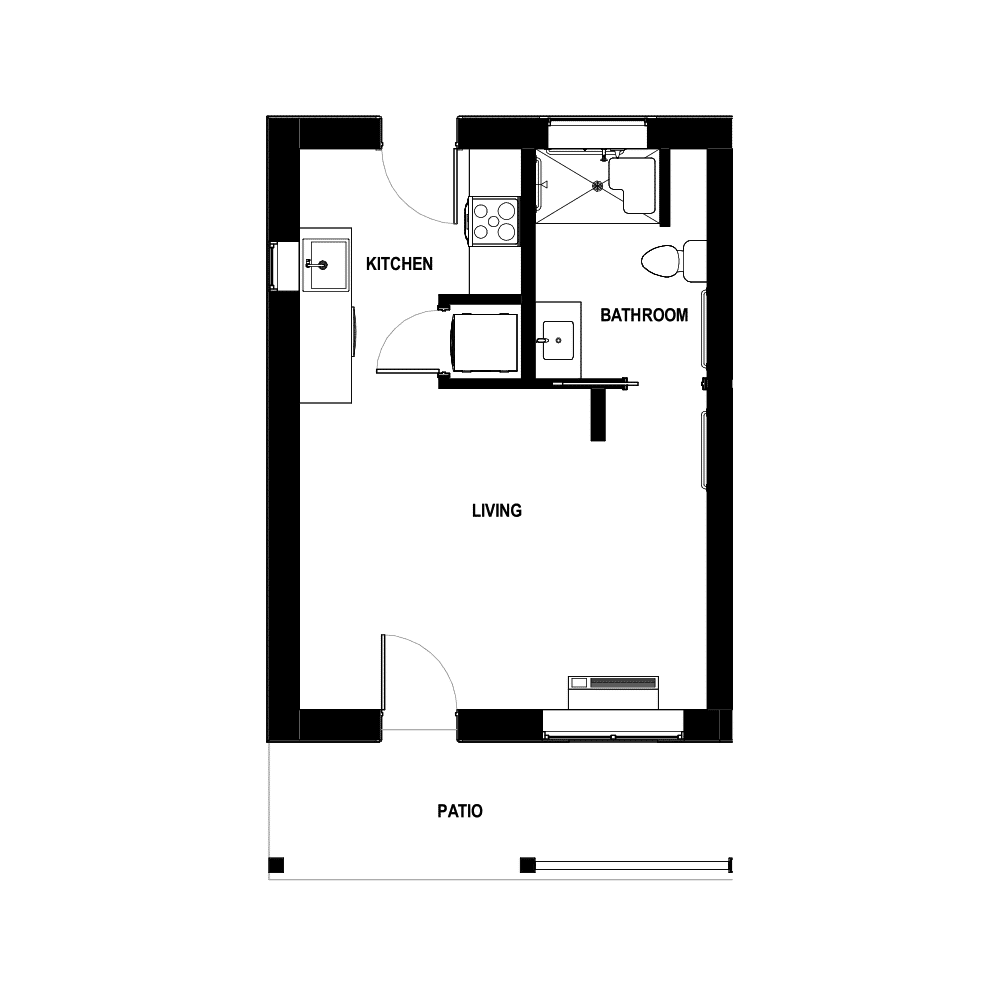
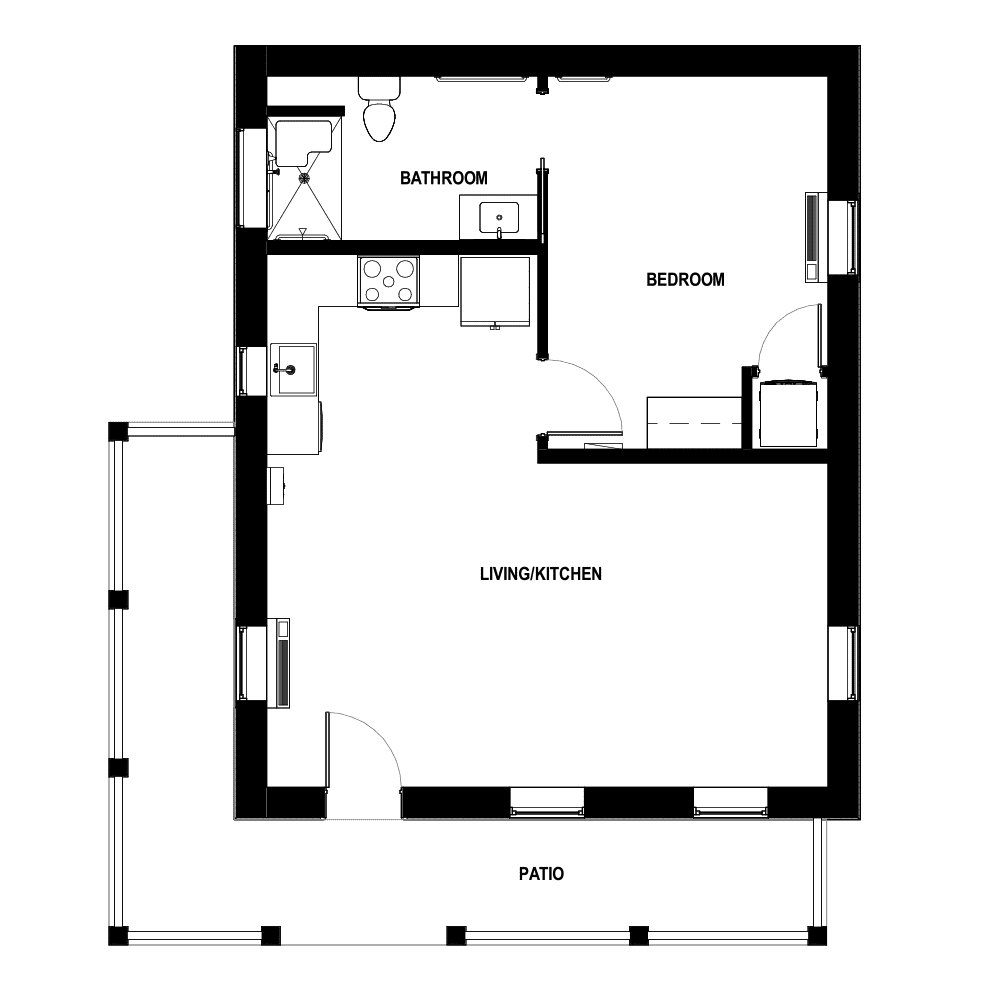
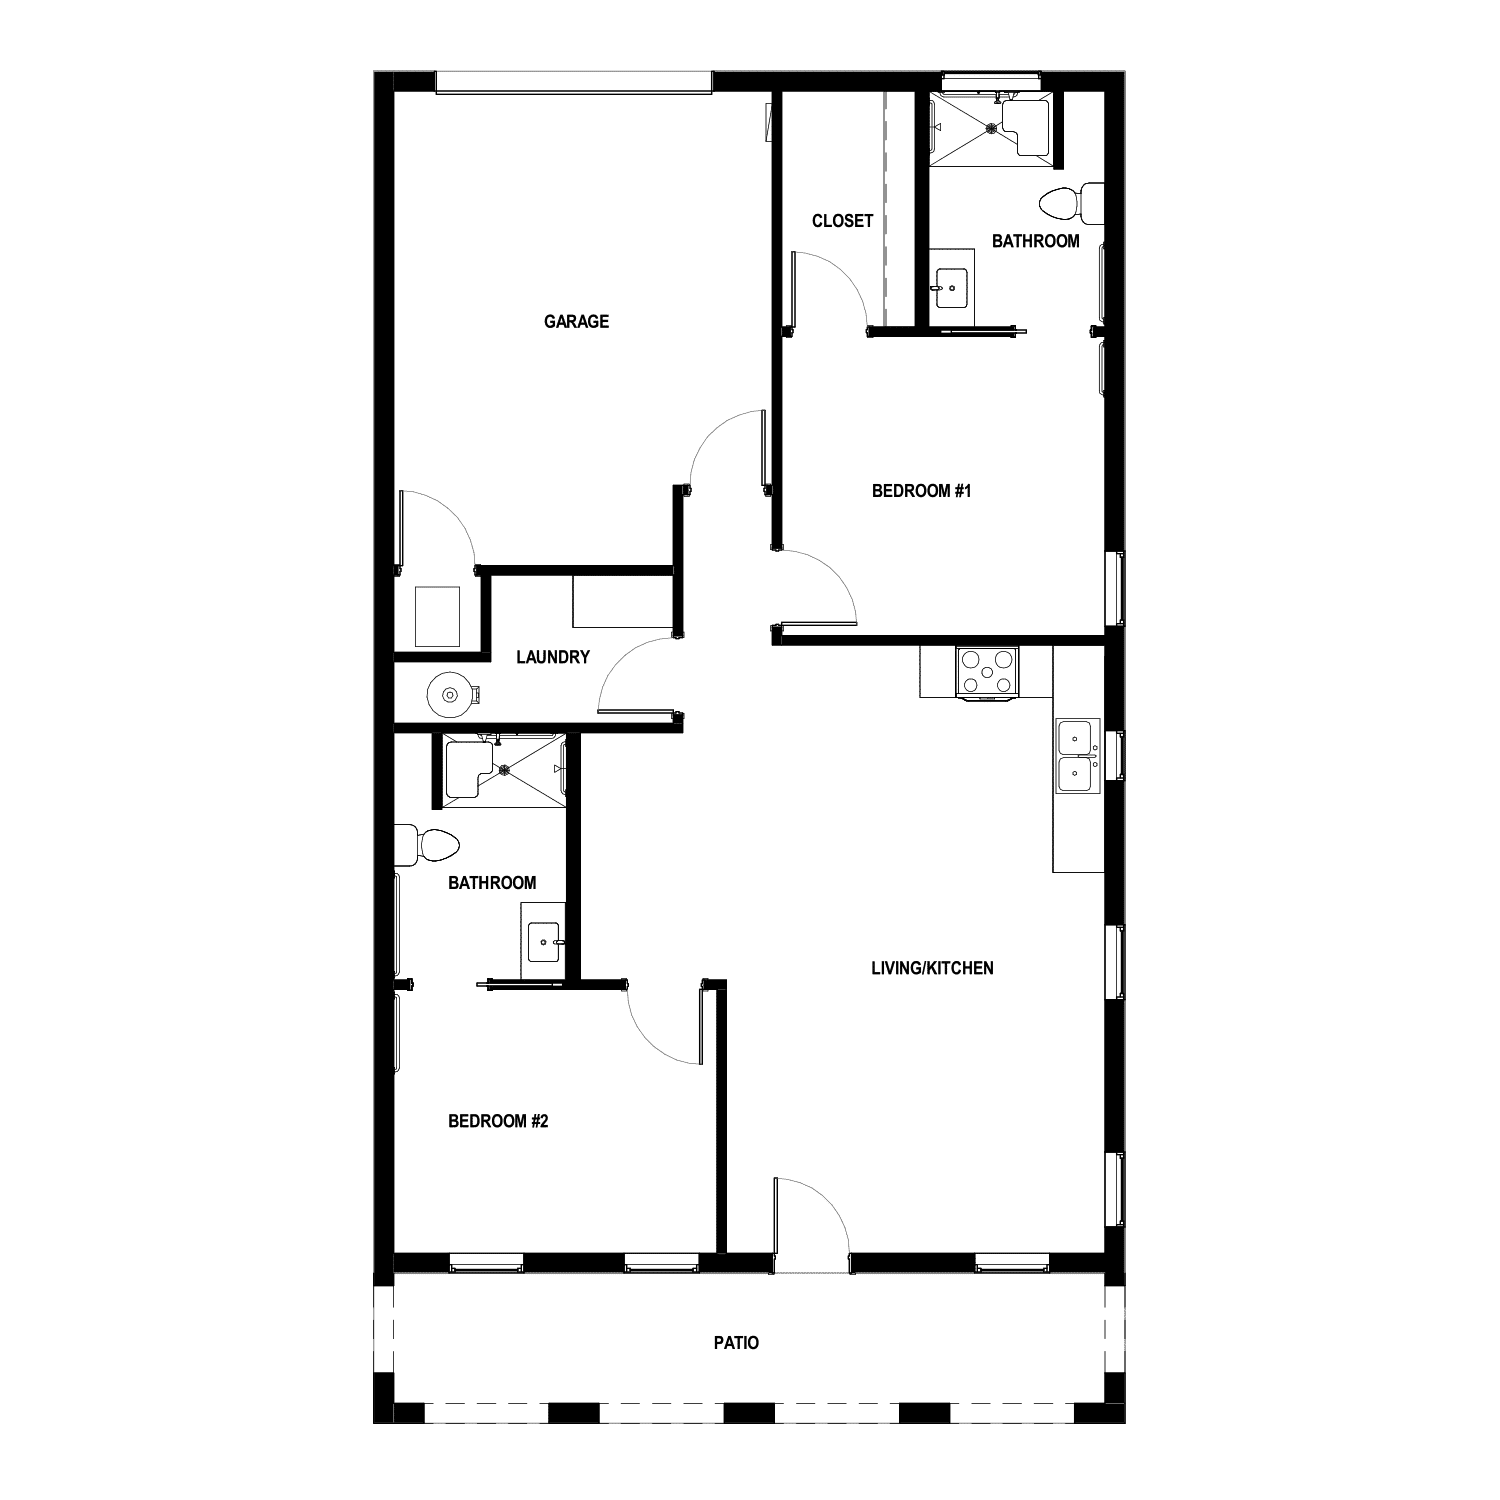
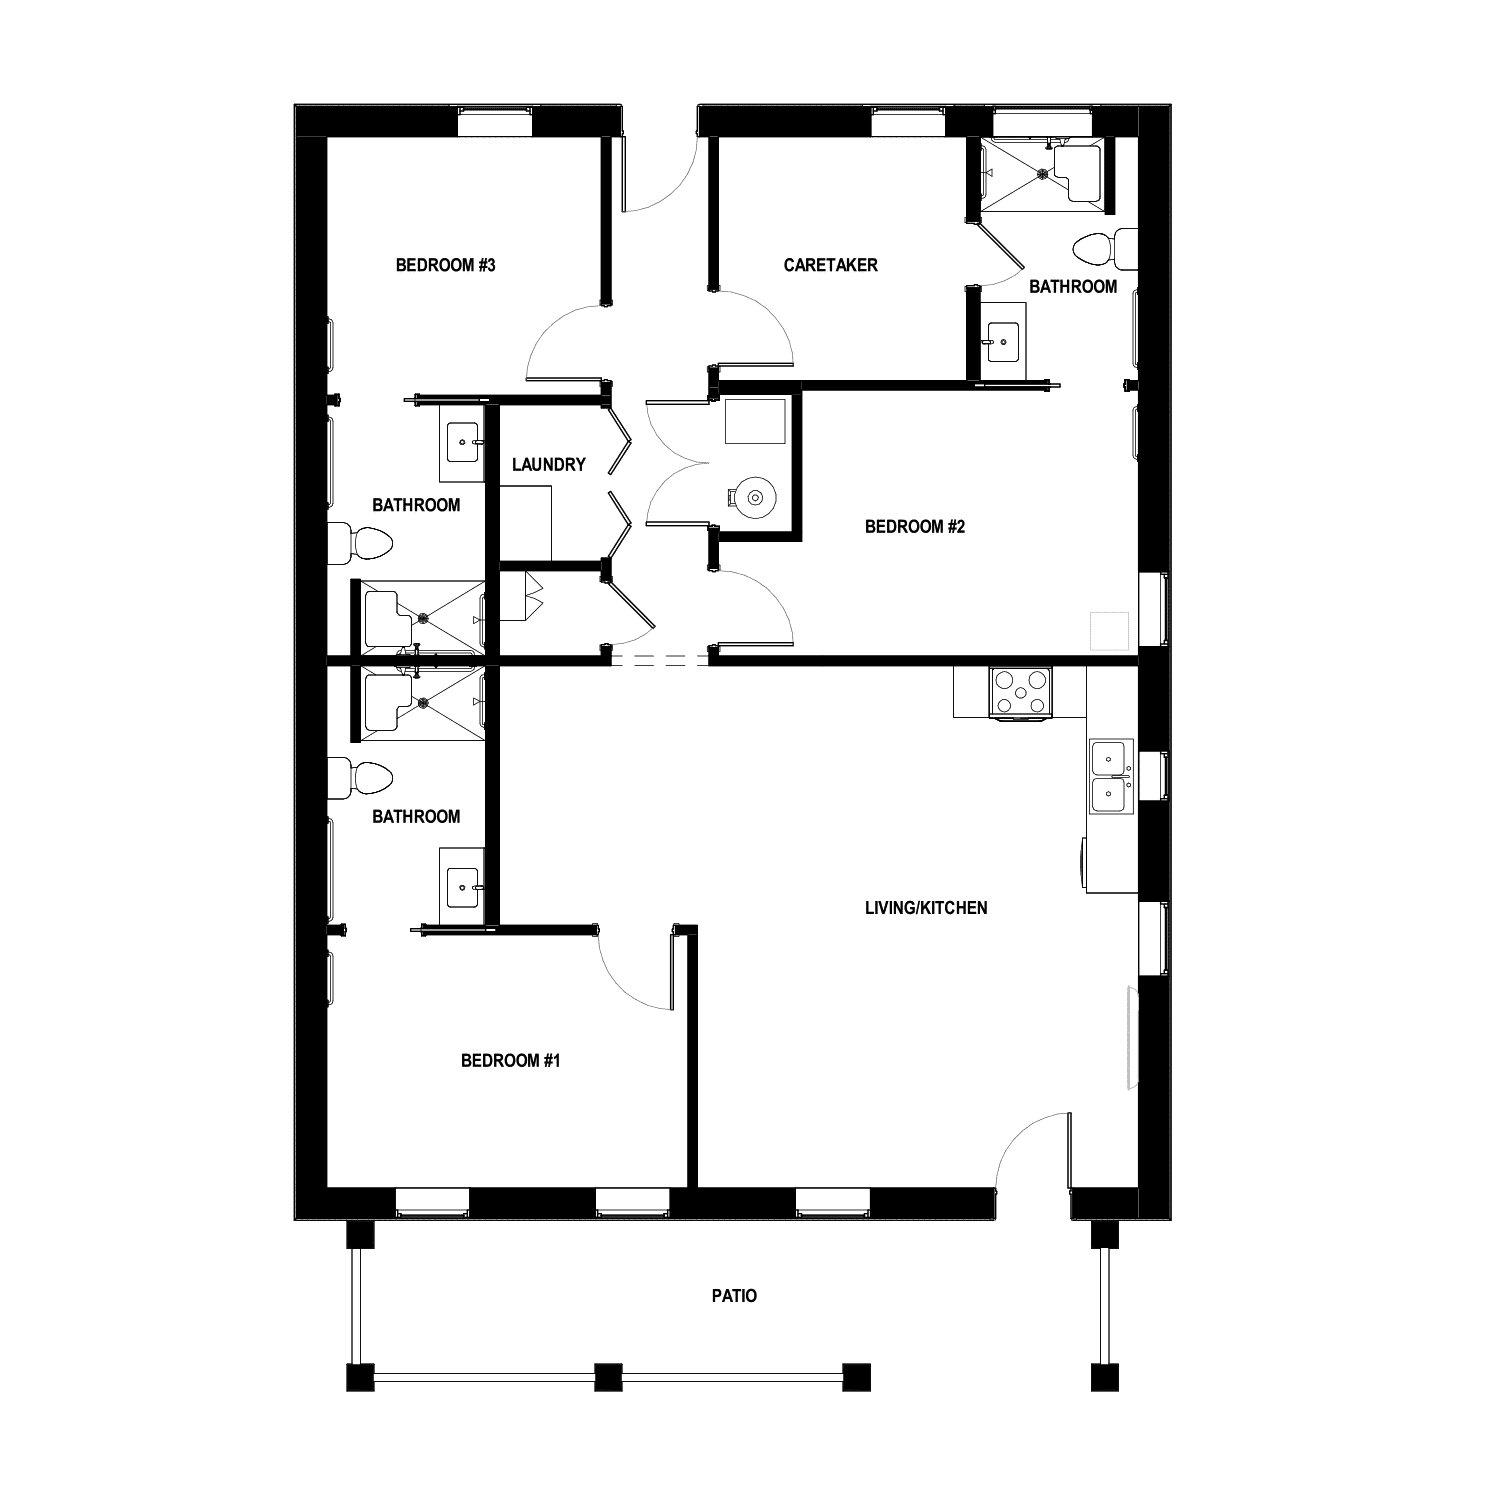
Yes — see the floorplan options available at Ashton Place Health and Rehabilitation on this page.

Does Ashton Place Health and Rehabilitation operate as a for-profit or non-profit?

Ashton Place Health and Rehabilitation is registered as a for-profit in AR.

Who is the administrator of Ashton Place Health and Rehabilitation?

Kristi Terry is the administrator of Ashton Place Health and Rehabilitation.

How many beds does Ashton Place Health and Rehabilitation have?

Ashton Place Health and Rehabilitation has 122 beds.

Guides for Better Senior Living

Care Cost Calculator: See Prices in Your Area

Nursing Home Data Explorer

Don’t Wait Too Long: 7 Red Flag Signs Your Parent Needs Assisted Living Now

The True Cost of Assisted Living in 2025 – And How Families Are Paying For It

Understanding Senior Living Costs: Pricing Models, Discounts & Financial Assistance