Autumn Care of Statesville

Nursing Home
Overview of Autumn Care of Statesville

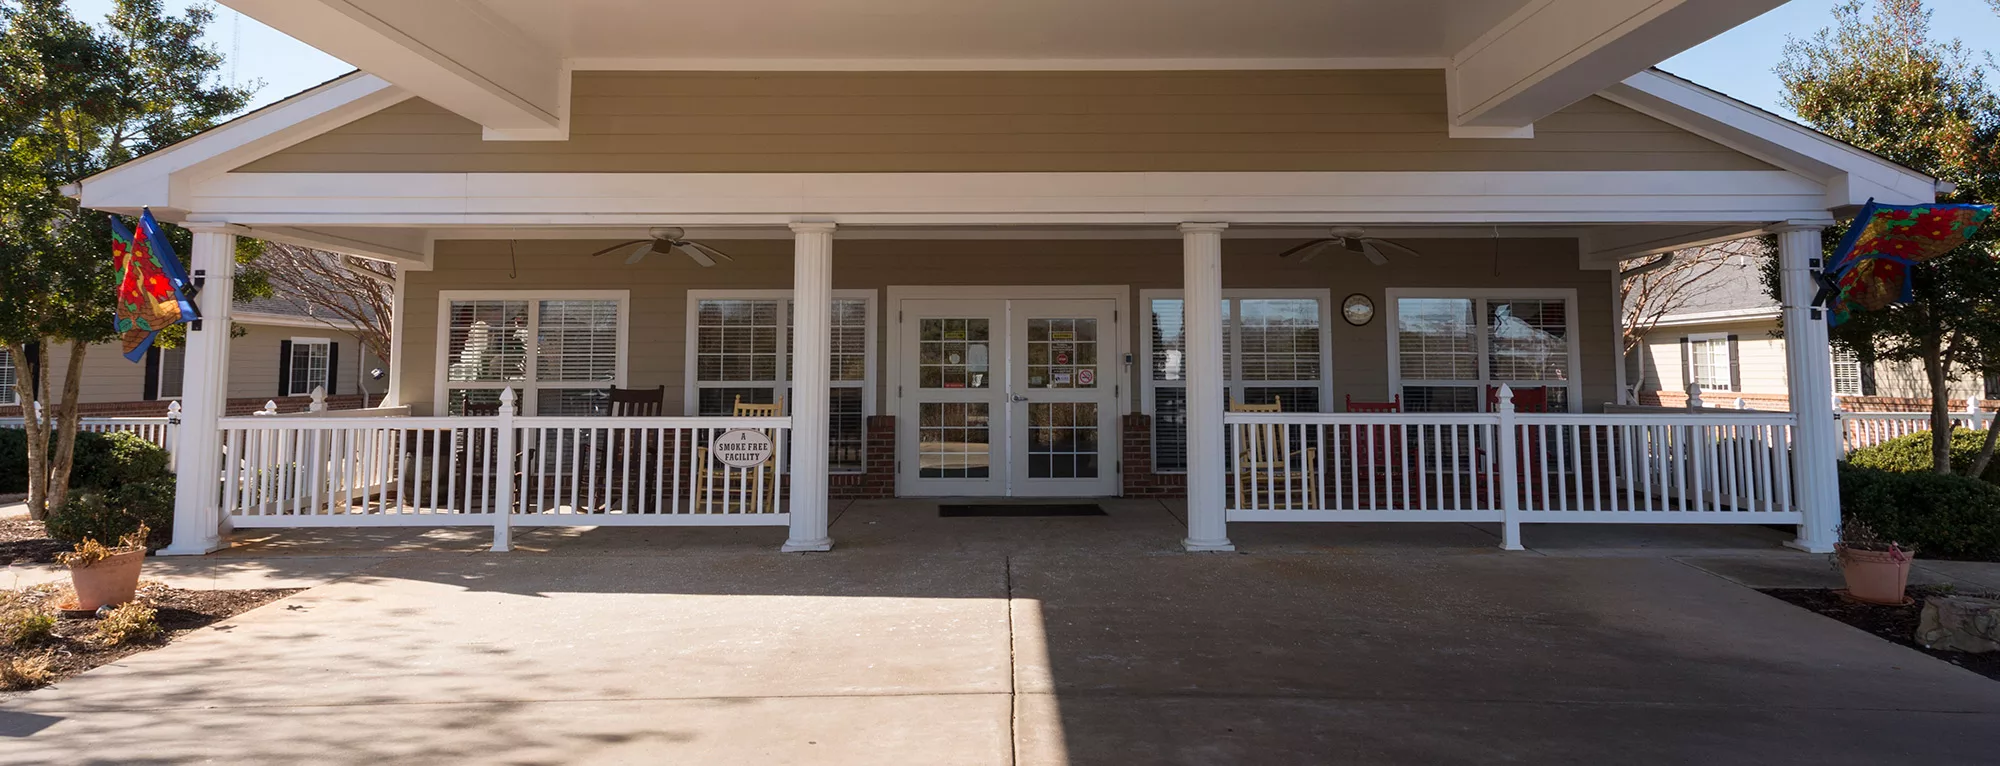
Recognized as the leading center for short-term rehabilitation, long-term skilled nursing care, and respite care in Statesville, North Carolina, Autumn Care of Statesville boasts a long-standing legacy of providing care with compassion and empathy to seniors. With a history of care, this community is committed to every senior’s well-being.

Autumn Care of Statesville is renowned for its specialized programs and personalized care plans to achieve the best possible outcomes for each resident. This community prioritizes individualized senior care to enhance residents’ physical and emotional well-being. Whether it’s short-term services or long-term care, their team is dedicated to addressing the unique needs of every senior. Experience the dedication and personalized care that has been the hallmark of Autumn Care of Statesville for years, where your well-being is their top priority.

(704) 883-9700

Quality ratings

Measured by Centers for Medicare & Medicaid Services (CMS)

Overall rating Info Official CMS rating based on health inspections, staffing and quality measures.
4/5
North Carolina average: 2.8/5
Health Inspection Info Official CMS rating based on deficiencies found during state health inspections.
4/5
North Carolina average: 2.8/5
Staffing Info Official CMS rating based on nurse staffing hours per resident per day.
2/5
North Carolina average: 2.7/5
Quality Measures Info Official CMS rating based on clinical outcomes for residents.
3/5
North Carolina average: 3.2/5

Nursing care per resident

Info Average daily nursing hours per resident (adjusted for acuity). Higher values indicate more nursing time per resident.
3h 42m per day

This home provides 7% less nursing time per resident than the state average.

North Carolina average: 3h 59m per day

Staffing hours breakdown

Info Hours of care per resident per day, broken down by staff type. Data from CMS Medicare.
Staff type Facility State avg National avg
Registered Nurse (RN) Info Registered nurse hours per resident per day. 24m per day 35m per day 41m per day
LPN / LVN Info Licensed Practical Nurse / Licensed Vocational Nurse hours per resident per day. 45m per day 52m per day 52m per day
Nurse Aide Info Nurse aide hours per resident per day. 2h 16m per day 2h 19m per day 2h 21m per day
Total Nursing (Weekend) Info Total number of nurse staff hours per resident per day on weekends. 2h 52m per day 3h 20m per day 3h 26m per day
Physical Therapist Info Physical therapist staff hours per resident per day. 6m per day 5m per day 4m per day
RN (Weekend) Info Registered nurse hours per resident per day on weekends. 13m per day 23m per day 29m per day

Capacity and availability

Medium-capacity home

Offers a balance of services and community atmosphere.

Total beds 113

This home usually has limited availability

Occupancy is moderate, suggesting balanced demand.

Similar demand to the North Carolina average
Occupancy rate 94.8%
Residents per day (avg) 98
Occupancy rate
94.8%
Residents per day (avg)
98

Who this home usually serves

TYPE OF STAY

Mix of rehab and long-term care

This home supports both short-term rehab and long-term care, with residents staying for a wide range of durations.

Breakdown by payment type

Medicare

36% of new residents, usually for short-term rehab.

Typical stay 1 months

Private pay

53% of new residents, often for short stays.

Typical stay 2 - 3 months

Medicaid

11% of new residents, often for long-term daily care.

Typical stay 1 - 2 years

Finances and operations

Proprietary home
Corporation
Home revenue
$14.9M
Profit
$1.5M
Proprietary home Corporation
Home revenue
$14,853,588.00
Profit
$1,501,024.00
Payroll costs Info The portion of the home's budget spent on staff, including nurses, caregivers, and other employees who support care and operations.
$4.8M
32.2% of revenue
Other operating costs Info All remaining costs needed to run the home, such as food, utilities, building maintenance, supplies and administrative expenses.
$8.6M
Total costs $13.4M
Walk Score
Walk Score: 34 / 100
Somewhat walkable. A few nearby services may be reachable on foot, but most trips require transportation.

Additional licensing details

CMS Certification Number: 345511

Staffing

Key information about the people who lead and staff this community.

Leadership

Contact: Ms. Tambria Rabuck, Administrator

Types of Care at Autumn Care of Statesville

Skilled Nursing Assisted Living Memory Care
Contact Autumn Care of Statesville

Compare Nursing Homes around Statesville

The information below is reported by the North Carolina Department of Health and Human Services, Division of Health Service Regulation.
Autumn Care of Statesville
AL

Assisted Living For seniors needing help with daily tasks but not full-time nursing.

MC

Memory Care Specialized care for those with Memory Loss, Alzheimer's, or dementia, ensuring safety and support.

SNF

Nursing Homes 24/7 care needed

Statesville
113
No
34
WILLIAM I WEISBERG FAMILY DYNASTY TRUST (DATED JUNE 1, 2011)
94.8%
$14,845,581.00
$4,780,748.00
32.2%
97.50
4/5
3.7033
4/5
2/5
3/5
-
18
2
-54%
-7%
+24%
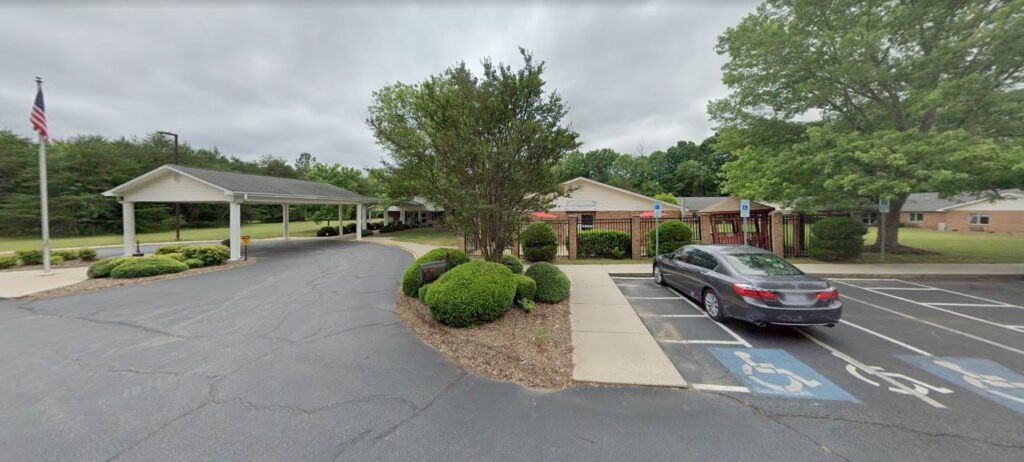
The Greens at Maple Leaf
AL

Assisted Living For seniors needing help with daily tasks but not full-time nursing.

SNF

Nursing Homes 24/7 care needed

Statesville
102
No
15
STARLIGHT HEALTHCARE, LLC
85.7%
$13,696,953.00
$3,598,057.00
26.3%
85.10
4/5
3.9964
3/5
3/5
5/5
2
21
2
-47%
+1%
+12%

Places of interest near Autumn Care of Statesville

Address 2.7 miles from city center — 2.04 miles to nearest hospital (Iredell Davis Behavioral Health Hospital)

Address 2001 Van Haven Dr, Statesville, NC 28625

Calculate Travel Distance to Autumn Care of Statesville

Add your location

Address

Staffing Data

Source: CMS Payroll-Based Journal (Q2 2025)

146
Total Staff
107
Employees
39
Contractors
38,036
Total Hours (Quarter)
56
Avg Staff/Day
7.5
Avg Shift (hrs)
Nursing Staff Breakdown
Role Count Avg Shift (hrs) Uses Contractors?
Registered Nurse68.5 Yes
Licensed Practical Nurse199.3 Yes
Certified Nursing Assistant717 Yes
Staff by Category
Administration
3 staff
7.7hs shift avg
Nursing Staff
106 staff
7.7hs shift avg
Physicians & Practitioners
5 staff
7.9hs shift avg
Therapy Services
23 staff
6.1hs shift avg
Activities & Recreation
0 staff
0hs shift avg
Social Services
2 staff
7.1hs shift avg
Dietary Services
5 staff
7.8hs shift avg
Other Services
2 staff
5.8hs shift avg
Contractor Analysis
18.1%
of total hours from contractors
6,873 contractor hours this quarter
Licensed Practical Nurse: 3 Certified Nursing Assistant: 7 Speech Language Pathologist: 4 Clinical Nurse Specialist: 1 RN Director of Nursing: 1 Qualified Social Worker: 2 Physical Therapy Assistant: 8 Respiratory Therapy Technician: 4 Registered Nurse: 1 Occupational Therapy Assistant: 4 Physical Therapy Aide: 2 Medical Director: 2
Role Employees Contractors Total Staff Total Hours Days Worked % of Days Avg Shift (hrs)
Certified Nursing Assistant6477117,58491100%7
Licensed Practical Nurse163196,99791100%9.3
Medication Aide/Technician8082,50891100%9.2
Registered Nurse5161,9949099%8.5
Clinical Nurse Specialist3141,2986976%7.8
Physical Therapy Assistant0881,2287178%6.1
Speech Language Pathologist0441,0027785%6.3
Respiratory Therapy Technician0448857987%7.6
Dental Services Staff2027456774%5.8
Other Dietary Services Staff4046746875%7.9
Nurse Practitioner1015126470%8
Qualified Social Worker0224926571%7.1
RN Director of Nursing1124856167%7.6
Administrator1014806066%8
Dietitian1014786268%7.7
Physical Therapy Aide0224437279%6.2
Occupational Therapy Aide1011842325%8
Occupational Therapy Assistant044444651%0.9
Medical Director022333%1

Health Inspection History

Inspections
Total health inspections 3

North Carolina average 4


Last Health inspection on Apr 2025

Total health citations 18
Citations per inspection
6

Health citations are formal notices following inspections when they fail to comply with safety and care standards.

All 18 citations resulted from standard inspections.

Breakdown of citation severity (last 3 years)
Critical Health citations More info 0
100% better than North Carolina average

North Carolina average: 1.3


Serious Health citations More info 2
122% worse than North Carolina average

North Carolina average: 0.9

0 critical citations More info North Carolina average: 1.3

2 serious citations More info North Carolina average: 0.9

16 moderate citations More info North Carolina average: 17.1

0 minor citations More info North Carolina average: 1.6
Citations history (last 3 years)
Infection Control moderate citation Apr 16, 2025
Corrected

Resident Rights moderate citation Apr 16, 2025
Corrected

Resident Rights moderate citation Apr 16, 2025
Corrected

Administration moderate citation Feb 08, 2024
Corrected

Facility Characteristics

Source: CMS Long-Term Care Facility Characteristics (Data as of Jan 2026)

Ownership: For-Profit LLC
Resident Census by Payment Source
94 Total Residents
Medicare 21 (22.3%)
Medicaid 64 (68.1%)
Private Pay/Other 9 (9.6%)
Programs & Services
Residents' Group
Family Engagement

Active councils help families stay involved in care decisions and facility operations.

Quality of care over time

These measures show how residents usually do over time at this home, based on health outcomes and preventive care.

High-risk clinical events score Info A composite score based on pressure ulcers, falls with injury, weight loss, walking ability decline, and activities of daily living decline. 13.1
14% worse than North Carolina average

North Carolina average: 11.5

Functional decline score Info A composite score based on activities of daily living decline, walking ability decline, and incontinence. 25.3
22% worse than North Carolina average

North Carolina average: 20.6

Long-stay resident measures
Need for Help with Daily Activities Increased Info Percent of long-stay residents whose need for help with daily activities has increased 19.3%
10% worse than North Carolina average

North Carolina average: 17.5%

Walking Ability Worsened Info Percent of long-stay residents whose ability to move independently worsened 33.0%
42% worse than North Carolina average

North Carolina average: 23.3%

Low Risk Residents with Bowel/Bladder Incontinence Info Percent of low risk long-stay residents who lose control of their bowels or bladder 23.4%
9% worse than North Carolina average

North Carolina average: 21.4%

Falls with Major Injury Info Percent of long-stay residents experiencing one or more falls with major injury 2.6%
29% better than North Carolina average

North Carolina average: 3.6%

High Risk Residents with Pressure Ulcers Info Percent of long-stay high risk residents with pressure ulcers 3.2%
49% better than North Carolina average

North Carolina average: 6.3%

Urinary Tract Infection Info Percent of long-stay residents with a urinary tract infection 2.9%
10% worse than North Carolina average

North Carolina average: 2.6%

Lost Too Much Weight Info Percent of long-stay residents who lose too much weight 7.2%
In line with North Carolina average

North Carolina average: 7.4%

Depressive Symptoms Info Percent of long-stay residents who have depressive symptoms 1.0%
76% better than North Carolina average

North Carolina average: 4.4%

Antipsychotic Use Info Percent of long-stay residents who received an antipsychotic medication 7.3%
46% better than North Carolina average

North Carolina average: 13.4%

Pneumococcal Vaccine Info Percent of long-stay residents assessed and appropriately given the pneumococcal vaccine 99.7%
9% better than North Carolina average

North Carolina average: 91.6%

Influenza Vaccine Info Percent of long-stay residents assessed and appropriately given the seasonal influenza vaccine 100.0%
6% better than North Carolina average

North Carolina average: 94.1%

Hospitalizations per 1,000 days Info Number of hospitalizations per 1,000 long-stay resident days. 1.11
37% better than North Carolina average

North Carolina average: 1.77

ED visits per 1,000 days Info Number of outpatient emergency department visits per 1,000 long-stay resident days. 0.76
58% better than North Carolina average

North Carolina average: 1.82

Short-stay resident measures
Pneumococcal Vaccine Info Percent of short-stay residents assessed and appropriately given the pneumococcal vaccine 77.7%
In line with North Carolina average

North Carolina average: 79.9%

Antipsychotic medication increase Info Percent of short-stay residents who newly received an antipsychotic medication 2.7%
83% worse than North Carolina average

North Carolina average: 1.5%

Influenza Vaccine Info Percent of short-stay residents assessed and appropriately given the seasonal influenza vaccine 79.9%
In line with North Carolina average

North Carolina average: 78.1%

Re-hospitalized after SNF stay Info Percentage of short-stay residents who were re-hospitalized after their nursing home admission. 22.0%
In line with North Carolina average

North Carolina average: 22.9%

Emergency department visits Info Percentage of short-stay residents who had an outpatient emergency department visit. 7.7%
42% better than North Carolina average

North Carolina average: 13.2%

Falls with major injury Info Percentage of SNF residents who experience falls with major injury during their stay. 1.5%
90% worse than North Carolina average

North Carolina average: 0.8%

Ability to care for self at discharge Info Percentage of residents at or above expected ability to care for themselves at discharge. 48.9%
9% worse than North Carolina average

North Carolina average: 53.7%

Successful return to home or community Info Rate of successful return to home or community from a skilled nursing facility. 45.1%
11% worse than North Carolina average

North Carolina average: 50.6%

Guides for Better Senior Living

Care Cost Calculator: See Prices in Your Area

Nursing Home Data Explorer

Don’t Wait Too Long: 7 Red Flag Signs Your Parent Needs Assisted Living Now

The True Cost of Assisted Living in 2025 – And How Families Are Paying For It

Understanding Senior Living Costs: Pricing Models, Discounts & Financial Assistance

Financial Aid for North Carolina Seniors

Get financial aid guidance

Community Alternatives Program for Disabled Adults

NC Medicaid CAP/DA

Age 65+ or disabled, North Carolina resident, Medicaid- eligible, nursing home-level care need.

~$2,829/month (300% FBR, individual).

$2,000 (individual), $3,000 (couple).

High demand; waitlists common in urban areas.

North Carolina Senior Care Options

NC SCO (via NFCSP)

Caregiver of someone 60+ (or with dementia), North Carolina resident.

No strict limit; prioritizes low-income.

Not applicable.

Limited slots; rural/urban balance.

Program of All-Inclusive Care for the Elderly (PACE)

North Carolina PACE (e.g., PACE of the Triad)

Age 55+, NC resident (specific counties), NFLOC, safe with PACE support.

~$2,829/month (Medicaid-eligible); private pay option available.

$2,000 (individual), $3,000 (couple) for Medicaid enrollees.

Available in 10+ counties (e.g., Guilford, Wake); multiple providers (e.g., PACE of the Southern Piedmont).

In-Home Aide Services

North Carolina In-Home Aide Services

Age 60+, NC resident, unable to perform 1+ ADL, at risk of nursing home placement.

No strict cap; prioritizes low-income (~$24,980/year).

Not assessed; need-based.

Family can be aides; varies by county funding.

Medicare Savings Program (MSP)

North Carolina Medicare Savings Program

Age 65+ or disabled, NC resident, Medicare Part A/B.

~$2,510/month (QMB), ~$3,380/month (SLMB), ~$3,598/month (QI)—individual.

$9,430 (individual), $14,130 (couple).

Three tiers; no waitlist; includes Extra Help for Part D.

Low-Income Energy Assistance Program (LIHEAP)

North Carolina LIHEAP

Age 60+ prioritized, NC resident, low-income household.

~$3,970/month (individual, 185% FPL).

Not assessed; income-focused.

Covers oil, gas, electric; emergency aid via Crisis Intervention Program (CIP).

Senior Community Service Employment Program (SCSEP)

North Carolina SCSEP

Age 55+, unemployed, low-income, NC resident.

~$1,983/month (125% FPL).

Not specified; income-focused.

Priority for veterans, rural residents; AARP partnership.

VA Aid and Attendance (A&A) and Housebound Benefits

North Carolina VA Aid and Attendance/Housebound

Age 65+ or disabled veteran/spouse, NC resident, wartime service, need for ADL help (A&A) or homebound.

Net income < ~$1,984/month (veteran with dependent, A&A); pension offsets income.

~$155,356 (net worth limit).

High veteran demand in rural/urban areas.

Urgent Repair Program (URP)

North Carolina Urgent Repair Program

Age 60+ prioritized, NC resident, homeowner, low-income.

~$30,258/year (50% AMI, varies by county).

Not strictly assessed; home value considered.

Forgivable at $2,000/year; statewide via local partners.

State/County Special Assistance (SA)

North Carolina Special Assistance

Age 65+ (or disabled), NC resident, in licensed adult care home, low-income.

~$1,255/month (individual, 100% FPL); varies by facility rate.

$2,000 (individual).

Covers assisted living; counties supplement state funds.

Who we are

Your Senior Care Partner, Every Step of the Way

We help families find affordable senior communities and unlock same day discounts, Medicaid, and Medicare options tailored to your needs.

Contact us Today
Tour Icon
Planning a tour? Check our touring checklist.
Chat Icon
Thinking of living here? We can help you speak to a current resident