Autumn Care of Statesville
Nursing Home, Skilled Nursing, Assisted Living & Memory Care · Statesville, NC
CMS overall rating Info The Overall CMS Rating is scored from 1 to 5 stars and combines results from health inspections, staffing levels, and quality measures. Health inspections carry the most weight. Staffing and quality scores can increase or decrease the final rating based on performance compared to state and national standards.

Autumn Care of Statesville

Nursing Home, Skilled Nursing, Assisted Living & Memory Care · Statesville, NC
CMS overall rating Info The Overall CMS Rating is scored from 1 to 5 stars and combines results from health inspections, staffing levels, and quality measures. Health inspections carry the most weight. Staffing and quality scores can increase or decrease the final rating based on performance compared to state and national standards.
Calculator: See prices in your area
Autumn Care of Statesville accepts Medicare, Medicaid, and private pay.

Overview of Autumn Care of Statesville

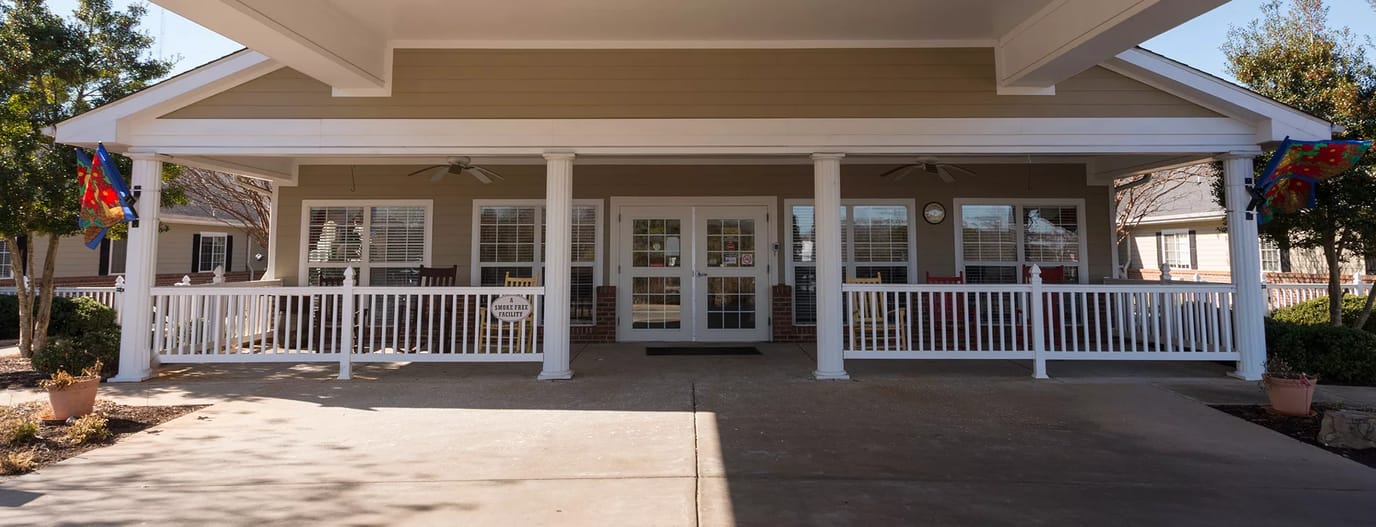
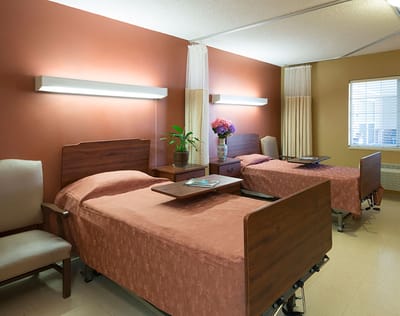
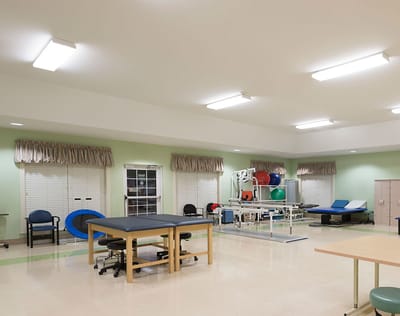
Recognized as the leading center for short-term rehabilitation, long-term skilled nursing care, and respite care in Statesville, North Carolina, Autumn Care of Statesville boasts a long-standing legacy of providing care with compassion and empathy to seniors. With a history of care, this community is committed to every senior’s well-being.

Autumn Care of Statesville is renowned for its specialized programs and personalized care plans to achieve the best possible outcomes for each resident. This community prioritizes individualized senior care to enhance residents’ physical and emotional well-being. Whether it’s short-term services or long-term care, their team is dedicated to addressing the unique needs of every senior. Experience the dedication and personalized care that has been the hallmark of Autumn Care of Statesville for years, where your well-being is their top priority.

(704) 883-9700

Quality ratings

Measured by Centers for Medicare & Medicaid Services (CMS)

Overall rating Info The Overall CMS Rating combines results from health inspections, staffing levels and quality measures. Health inspections carry the most weight. Staffing and quality scores can increase or decrease the final rating based on performance compared to state and national standards.
▲ 34.7% Above NC avg. ▲ 34.7% Above NC avg.Click the badge to see the full State ranking.Click here to see the full State ranking.
Health Inspection Info Based on the results of the facility's three most recent standard inspections and any complaint investigations. CMS reviews the number, scope, and severity of deficiencies, with more recent findings weighted more heavily.
▲ 17.6% Above NC avg. ▲ 17.6% Above NC avg.Click the badge to see the full State ranking.Click here to see the full State ranking.
Staffing Info Measures average nursing staff hours per resident per day, including Registered Nurses (RNs) and total nursing staff. Ratings are adjusted based on the level of care residents require and are compared to state and national benchmarks.
▼ 39.8% Below NC avg. ▼ 39.8% Below NC avg.Click the badge to see the full State ranking.Click here to see the full State ranking.
Quality Measures Info Based on clinical and physical health indicators reported to CMS, such as hospital readmissions, falls, pressure ulcers, and improvements in mobility. These measures reflect how well residents' health needs are being managed.
▼ 15.7% Below NC avg. ▼ 15.7% Below NC avg.Click the badge to see the full State ranking.Click here to see the full State ranking.

Staffing hours breakdown

Info Daily nursing hours per resident by staff type, reported to CMS. Higher is generally better — compare this facility to state and national averages to see where staffing stands.

Hours per resident per day — compared to North Carolina state averages

Total nursing care / resident Info This home is ranked 60th out of 90 homes in North Carolina. Total adjusted nursing hours per resident per day, combining RN, LPN, and aide time. CMS adjusts this for case-mix so facilities can be fairly compared.
3h 42m per day
Rank #60 / 90Nurse hours — State benchmarkedThis home is ranked 60th out of 90 homes in North Carolina. Shows adjusted nurse hours per resident per day benchmarked to the North Carolina average, with a ranking across 90 North Carolina SNFs. More hours mean more direct care. The national average is about 3.5 hrs; below 3.0 is a red flag.Click the rank badge to see the full State ranking.Click here to see the full State ranking.
This facility North Carolina avg (4h 55m per day)
vs North Carolina avg
-25%

4 of 6 metrics below state avg

Standout metric Physical Therapist is +20% above state avg
Staff typeHours / Day / Residentvs state avg
Registered Nurse (RN) Info RNs hold the highest nursing license and can assess residents, interpret test results, and direct care plans. More RN hours per day often signals stronger clinical oversight and faster response to health changes. 24m per day ▼ 31% State avg: 35m per day · National avg: 41m per day
LPN / LVN Info Licensed Practical Nurses (LPNs) or Licensed Vocational Nurses (LVNs) deliver routine hands-on care — medication administration, wound dressing, and monitoring vital signs. They work under RN supervision and make up a large share of daily bedside care. 45m per day ▼ 13% State avg: 52m per day · National avg: 52m per day
Nurse Aide Info Certified Nurse Aides (CNAs) provide the most direct day-to-day assistance: bathing, dressing, feeding, and mobility. Nurse aide hours are typically the largest staffing category and directly affect residents' quality of life. 2h 16m per day ■ Avg State avg: 2h 19m per day · National avg: 2h 21m per day
Weekend Total Nursing Info Combined nursing hours (RN + LPN + Nurse Aide) per resident per day on weekends. Staffing often drops on weekends — this figure reveals whether the facility maintains adequate coverage outside of weekday hours. 3h 2m per day ▼ 9% State avg: 3h 20m per day · National avg: 3h 26m per day
Physical Therapist Info Hours per resident per day provided by licensed Physical Therapists (PTs) or PT Assistants. PT services help residents recover mobility after injury or illness and are especially important for post-acute (short-stay) rehabilitation. 6m per day ▲ 20% State avg: 5m per day · National avg: 4m per day
Weekend RN Info Registered nurse hours specifically on weekends. Facilities sometimes reduce RN presence on Saturdays and Sundays — a low weekend RN figure compared to weekday hours can indicate reduced clinical oversight when most administrative staff are absent. 13m per day ▼ 43% State avg: 23m per day · National avg: 29m per day

Types of Care at Autumn Care of Statesville

Skilled Nursing Assisted Living Memory Care

Capacity and availability

This home usually has limited availability

Occupancy between 85% and 95% suggests balanced demand.

Higher occupancy than the North Carolina average: 76.4%
Occupancy rate 94.8% Rank #39 / 264Occupancy rate — State benchmarkedThis home is ranked 39th out of 264 homes in North Carolina. Shows this facility's occupancy rate versus the North Carolina average, with its Statewide rank out of 264. Higher occupancy signals strong local demand and financial stability.Click the rank badge to see the full State ranking.Click here to see the full State ranking.
Avg. Length of Stay 101 days
Occupancy rate
94.8% Rank #39 / 264Occupancy rate — State benchmarkedThis home is ranked 39th out of 264 homes in North Carolina. Shows this facility's occupancy rate versus the North Carolina average, with its Statewide rank out of 264. Higher occupancy signals strong local demand and financial stability.Click the rank badge to see the full State ranking.Click here to see the full State ranking.
Avg. Length of Stay
101 days
Walk Score
Walk Score: 34 / 100 Rank #272 / 572Walk Score — State benchmarkedThis home is ranked 272nd out of 572 homes in North Carolina. Shows how walkable this facility's neighborhood is compared to the average Walk Score across North Carolina SNFs. Higher scores benefit residents, families, and staff.Click the rank badge to see the full State ranking.Click here to see the full State ranking.
Somewhat walkable. A few nearby services may be reachable on foot, but most trips require transportation.

About this community

Awards

Awards2020 Quality Initiative Recognition Program from the American Health Care Association

License Details

CMS Certification Number345511
AccreditationsAmerican Health Care Association (AHCA) 2020 Quality Initiative Recognition Program

Staffing

Key information about the people who lead and staff this community.

Leadership

ContactMs. Tambria Rabuck, Administrator

Therapy & Rehabilitation

3 services
Rehabilitation Services
Respite Care
Short-Term Rehab

Staffing & Medical

1 service
24-Hour Staffing

Additional Services

1 service
Personal Care

Amenities & Lifestyle

Physical Therapy
Occupational Therapy
Speech Therapy
24-Hour Skilled Nursing Care
Specific ProgramsDialysis Care, Vent Management, Pulmonary Care, Cardiac Care, Life Enriched

Contact Autumn Care of Statesville

Inspection History

In North Carolina, the Department of Health and Human Services, Division of Health Service Regulation conducts unannounced surveys to ensure nursing and adult care homes meet safety standards.

Since 2022 · 4 years of data 19 deficiencies 0 penalties

Inspection Scorecard Info This scorecard compares key inspection, citation, and complaint metrics at this facility against the North Carolina state average. Metrics rated ≥15% worse than average are highlighted in red; those ≥15% better are highlighted in green.

Since 2022 vs. North Carolina state average
Overall vs. NC average 0 Worse No metrics in this bucket. 2 Better Metrics better than North Carolina average:
• Total deficiencies (59% below)
• Deficiencies per year (58% below)
Latest Inspection April 16, 2025 Routine

Deficiencies Info Deficiencies are formal regulatory issues recorded during state inspections.

This FacilityNC Averagevs. NC Avg
Total deficiencies Info Formal regulatory issues recorded by inspectors across all inspection types. 1946 This facility has 59% fewer total deficiencies than a typical North Carolina nursing home (19 vs. NC avg 46).↓ 59% better
Deficiencies per year Info Average deficiencies per year since 2022. 4.811.5 This facility has 58% fewer deficiencies per year than a typical North Carolina nursing home (4.8 vs. NC avg 11.5).↓ 58% better

Inspection Reports Summary Info An editor-reviewed summary of the themes and findings across this facility's recent inspection reports.

The most recent inspection on April 16, 2025, found deficiencies related to medication self-administration assessments, code status documentation, glucometer cleaning, and wound care precautions. Earlier inspections showed a pattern of issues with medication management, infection control, respiratory care, resident safety, and facility operations, including some repeated deficiencies in infection control and respiratory care from a complaint investigation in February 2024. Inspectors cited problems mainly with medication administration, infection prevention practices, and documentation accuracy. There were no fines, immediate jeopardy findings, or license actions listed in the available reports. The inspection history indicates ongoing challenges in clinical care processes, with some improvement noted in the absence of deficiencies during the August 2023 annual inspection.

Read the full inspection reports for this facility, including detailed findings and corrective actions.

Show Inspection Reports

Health Inspection History

Inspections since 2022
Total health inspections 3

North Carolina average 4


Last Health inspection on Apr 2025

Total health citations
18 Rank #59 / 95Health citations — State benchmarkedThis home is ranked 59th out of 95 homes in North Carolina. Shows this facility's total health deficiency citations benchmarked to the North Carolina State average, with a ranking across all 95 NC SNFs. Lower citation counts earn a better rank.Click the rank badge to see the full State ranking.Click here to see the full State ranking.

North Carolina average 20.9

Citations per inspection
6 Rank #74 / 95Citations per inspection — State benchmarkedThis home is ranked 74th out of 95 homes in North Carolina. Shows average deficiency citations per CMS inspection for this facility versus the North Carolina mean across 95 SNFs with citation data. Lower is better.Click the rank badge to see the full State ranking.Click here to see the full State ranking.

North Carolina average 4.99


Health citations are formal notices following inspections when they fail to comply with safety and care standards.

All 18 citations resulted from standard inspections.

Breakdown of citation severity (last 4 years)
Critical Health citations
0
100% better than North Carolina average

North Carolina average: 1.3


Serious Health citations
2 Rank #22 / 36Serious citations (G–I) — State benchmarkedThis home is ranked 22nd out of 36 homes in North Carolina. Shows G–I scope serious health citations for this facility versus other North Carolina SNFs. Lower counts rank better.Click the rank badge to see the full State ranking.Click here to see the full State ranking.
122% worse than North Carolina average

North Carolina average: 0.9

0 critical citations North Carolina average: 1.3

2 serious citations North Carolina average: 0.9

16 moderate citations North Carolina average: 17.1

0 minor citations North Carolina average: 1.6
Citations history (last 4 years)
Infection Control moderate citation Apr 16, 2025
Corrected

Resident Rights moderate citation Apr 16, 2025
Corrected

Resident Rights moderate citation Apr 16, 2025
Corrected

Administration moderate citation Feb 08, 2024
Corrected

Staffing Data

Reporting period: October 1 – December 31, 2025 (Q4 2025). Source: CMS Payroll-Based Journal report.

Total staff 158
Employees 103
Contractors 55
Staff to resident ratio 1.68:1
7% worse than North Carolina average
North Carolina average ratio: 1.80:1 North Carolina average ratio: 1.80:1See full North Carolina ranking
Avg staff/day 53
Average shift 7.6 hours
5% worse than North Carolina average
North Carolina average: 8 hours North Carolina average shift: 8 hoursSee full North Carolina ranking
Total staff hours (quarter) 36,904

Nursing staff breakdown

Q4 2025 · Oct 1 – Dec 31 More info This data comes from the CMS Payroll-Based Journal report covering October 1 – December 31, 2025.
Registered Nurse

Manages medical care and health needs.

RN Staff 8
Average shift length Info Average shift length. Calculated as total hours divided by days worked and average staff per day. 8.4 hours

This role is partially covered by contractors.

Licensed Practical Nurse

Assists with medical care and medications.

LPN Staff 20
Average shift length Info Average shift length. Calculated as total hours divided by days worked and average staff per day. 9.5 hours

This role is partially covered by contractors.

Certified Nursing Assistant

Helps with daily care and mobility.

CNA Staff 81
Average shift length Info Average shift length. Calculated as total hours divided by days worked and average staff per day. 7.1 hours

This role is partially covered by contractors.

Contractor staffing

Q4 2025 · Oct 1 – Dec 31 More info This data comes from the CMS Payroll-Based Journal report covering October 1 – December 31, 2025.

Total hours from contractors

18.6%

6,852 contractor hours this quarter

Certified Nursing Assistant: 23 Occupational Therapy Assistant: 7 Physical Therapy Assistant: 6 Speech Language Pathologist: 4 Licensed Practical Nurse: 2 Qualified Social Worker: 2 Respiratory Therapy Technician: 2 Registered Nurse: 2 Physical Therapy Aide: 2 Clinical Nurse Specialist: 1 RN Director of Nursing: 1 Nurse Practitioner: 1 Occupational Therapy Aide: 1 Medical Director: 1

Staff by category

Q4 2025 · Oct 1 – Dec 31 More info This data comes from the CMS Payroll-Based Journal report covering October 1 – December 31, 2025.
Certified Nursing Assistant58238116,85392100%7.1
Licensed Practical Nurse182206,62892100%9.5
Medication Aide/Technician8082,93192100%9.4
Registered Nurse6281,5979199%8.4
Clinical Nurse Specialist3141,2557177%7.9
Physical Therapy Assistant0661,1377784%6.1
Speech Language Pathologist0441,0007177%6.6
Other Dietary Services Staff3038758390%7.8
Dental Services Staff2026726874%6.1
Physical Therapy Aide0226046470%6.3
Respiratory Therapy Technician0225797683%7.1
Nurse Practitioner1125296571%8
Administrator1015046368%8
Qualified Social Worker0224896166%7.9
RN Director of Nursing1124806166%7.7
Dietitian1014535964%7.7
Occupational Therapy Aide1122713033%8.5
Occupational Therapy Assistant077464043%1
Medical Director011333%1
81 Certified Nursing Assistant
% of Days 100%
20 Licensed Practical Nurse
% of Days 100%
8 Medication Aide/Technician
% of Days 100%
8 Registered Nurse
% of Days 99%
4 Clinical Nurse Specialist
% of Days 77%
6 Physical Therapy Assistant
% of Days 84%
4 Speech Language Pathologist
% of Days 77%
3 Other Dietary Services Staff
% of Days 90%
2 Dental Services Staff
% of Days 74%
2 Physical Therapy Aide
% of Days 70%
2 Respiratory Therapy Technician
% of Days 83%
2 Nurse Practitioner
% of Days 71%
1 Administrator
% of Days 68%
2 Qualified Social Worker
% of Days 66%
2 RN Director of Nursing
% of Days 66%
1 Dietitian
% of Days 64%
2 Occupational Therapy Aide
% of Days 33%
7 Occupational Therapy Assistant
% of Days 43%
1 Medical Director
% of Days 3%

Penalties and fines

Federal penalties imposed by CMS for regulatory violations, including civil money penalties (fines) and denials of payment for new Medicare/Medicaid admissions.

Source: CMS Penalties Database

No penalties in the past 3 years

No civil money penalties or payment denials were reported in the last 3 years.

Quality of care over time

These measures show how residents usually do over time at this home, based on health outcomes and preventive care.

High-risk clinical events score Info A composite score based on pressure ulcers, falls with injury, weight loss, walking ability decline, and activities of daily living decline. 13.1
14% worse than North Carolina average

North Carolina average: 11.5

Functional decline score Info A composite score based on activities of daily living decline, walking ability decline, and incontinence. 25.3
22% worse than North Carolina average

North Carolina average: 20.6

Long-stay resident measures
Significantly above average North Carolina avg: 2.9 Info CMS star rating based on long-stay quality measure performance. 5 stars = significantly above average, 1 star = significantly below average.
Need for Help with Daily Activities Increased Info Percent of long-stay residents whose need for help with daily activities has increased 19.3%
10% worse than North Carolina average

North Carolina average: 17.5%

Walking Ability Worsened Info Percent of long-stay residents whose ability to move independently worsened 33.0%
42% worse than North Carolina average

North Carolina average: 23.3%

Low Risk Residents with Bowel/Bladder Incontinence Info Percent of low risk long-stay residents who lose control of their bowels or bladder 23.4%
9% worse than North Carolina average

North Carolina average: 21.4%

Falls with Major Injury Info Percent of long-stay residents experiencing one or more falls with major injury 2.6%
29% better than North Carolina average

North Carolina average: 3.6%

High Risk Residents with Pressure Ulcers Info Percent of long-stay high risk residents with pressure ulcers 3.2%
49% better than North Carolina average

North Carolina average: 6.3%

Urinary Tract Infection Info Percent of long-stay residents with a urinary tract infection 2.9%
10% worse than North Carolina average

North Carolina average: 2.6%

Lost Too Much Weight Info Percent of long-stay residents who lose too much weight 7.2%
In line with North Carolina average

North Carolina average: 7.4%

Depressive Symptoms Info Percent of long-stay residents who have depressive symptoms 1.0%
76% better than North Carolina average

North Carolina average: 4.4%

Antipsychotic Use Info Percent of long-stay residents who received an antipsychotic medication 7.3%
46% better than North Carolina average

North Carolina average: 13.4%

Pneumococcal Vaccine Info Percent of long-stay residents assessed and appropriately given the pneumococcal vaccine 99.7%
9% better than North Carolina average

North Carolina average: 91.6%

Influenza Vaccine Info Percent of long-stay residents assessed and appropriately given the seasonal influenza vaccine 100.0%
6% better than North Carolina average

North Carolina average: 94.1%

Hospitalizations per 1,000 days Info Number of hospitalizations per 1,000 long-stay resident days. 1.11
37% better than North Carolina average

North Carolina average: 1.77

ED visits per 1,000 days Info Number of outpatient emergency department visits per 1,000 long-stay resident days. 0.76
58% better than North Carolina average

North Carolina average: 1.82

Short-stay resident measures
Below average North Carolina avg: 2.9 Info CMS star rating based on short-stay quality measure performance. 5 stars = much above average, 1 star = much below average.
Pneumococcal Vaccine Info Percent of short-stay residents assessed and appropriately given the pneumococcal vaccine 77.7%
In line with North Carolina average

North Carolina average: 79.9%

Antipsychotic medication increase Info Percent of short-stay residents who newly received an antipsychotic medication 2.7%
83% worse than North Carolina average

North Carolina average: 1.5%

Influenza Vaccine Info Percent of short-stay residents assessed and appropriately given the seasonal influenza vaccine 79.9%
In line with North Carolina average

North Carolina average: 78.1%

Re-hospitalized after SNF stay Info Percentage of short-stay residents who were re-hospitalized after their nursing home admission. 22.0%
In line with North Carolina average

North Carolina average: 22.9%

Emergency department visits Info Percentage of short-stay residents who had an outpatient emergency department visit. 7.7%
42% better than North Carolina average

North Carolina average: 13.2%

Falls with major injury Info Percentage of SNF residents who experience falls with major injury during their stay. 1.5%
90% worse than North Carolina average

North Carolina average: 0.8%

Ability to care for self at discharge Info Percentage of residents at or above expected ability to care for themselves at discharge. 48.9%
9% worse than North Carolina average

North Carolina average: 53.7%

Successful return to home or community Info Rate of successful return to home or community from a skilled nursing facility. 45.1%
11% worse than North Carolina average

North Carolina average: 50.6%

Breakdown by payment type

Medicare

36% of new residents, usually for short-term rehab.

Typical stay 1 months

Private pay

53% of new residents, often for short stays.

Typical stay 2 - 3 months

Medicaid

11% of new residents, often for long-term daily care.

Typical stay 1 - 2 years

Facility Characteristics

Source: CMS Long-Term Care Facility Characteristics (Data as of Jan 2026)

Total residents 94
Medicare
21
22.3% of residents
Medicaid
64
68.1% of residents
Private pay or other
9
9.6% of residents
Programs & Services
Residents Group

Residents meet regularly to discuss policies, care quality, and activities

Active Resident Council

Organized group of residents that meets regularly to discuss facility policies, quality of life, and activities.

Finances and operations

Privately-owned community
Operated by a business corporation.
Home revenue
$14.9M
Profit
$1.5M
Privately-owned community Operated by a business corporation.
Home revenue
$14.9M Rank #49 / 97Revenue — State benchmarkedThis home is ranked 49th out of 97 homes in North Carolina. Shows this facility's annual revenue compared to the North Carolina SNF average. Higher revenue generally means more resources for staffing and capital — read alongside Payroll %.Click the rank badge to see the full State ranking.Click here to see the full State ranking.
Profit
$1.5M
Payroll costs Info The portion of the home's budget spent on staff, including nurses, caregivers, and other employees who support care and operations. Rank #39 / 97Payroll — State benchmarkedThis home is ranked 39th out of 97 homes in North Carolina. Shows total annual staff payroll benchmarked to the North Carolina average. Higher payroll investment relative to peers often signals better staffing and less reliance on cheaper contract labor.Click the rank badge to see the full State ranking.Click here to see the full State ranking.
$8.1M
54.8% of revenue Rank #18 / 97Payroll % — State benchmarkedThis home is ranked 18th out of 97 homes in North Carolina. Shows payroll as a percentage of revenue versus the North Carolina average. Well-run North Carolina SNFs typically land around 49–62% — the top third Statewide. Below 25% may signal understaffing or heavy agency use — read with Staffing ratings.Click the rank badge to see the full State ranking.Click here to see the full State ranking.
Other operating costs Info All remaining costs needed to run the home, such as food, utilities, building maintenance, supplies and administrative expenses.
$5.2M
Total costs $13.4M

Who this home usually serves

TYPE OF STAY

Mix of rehab and long-term care

This home supports both short-term rehab and long-term care, with residents staying for a wide range of durations.

Places of interest near Autumn Care of Statesville

Address 2.7 miles from city center Info Estimated distance in miles from Statesville's city center to Autumn Care of Statesville's address, calculated via Google Maps. — 2.04 miles to nearest hospital (Iredell Davis Behavioral Health Hospital)

Calculate Travel Distance to Autumn Care of Statesville

Add your location

Address

Financial Assistance for
Nursing Home in North Carolina

Autumn Care of Statesville is located in Statesville, North Carolina.
Here are the financial assistance programs available to residents in North Carolina.

Get Financial aid guidance

Community Alternatives Program for Disabled Adults

NC Medicaid CAP/DA

Age 65+ or disabled
General North Carolina resident, Medicaid- eligible, nursing home-level care need.
Income Limits (2025) ~$2,829/month 300% FBR, individual
Asset Limits $2,000 (individual), $3,000 (couple).
NC

High demand; waitlists common in urban areas.

Benefits
Personal care (5-7 hours/day) Respite (240 hours/year) Adult day care ($60/day) Home modifications ($1,500 avg.)

North Carolina Senior Care Options

NC SCO (via NFCSP)

Age Caregiver of someone 60+ (or with dementia)
General North Carolina resident.
Income Limits No strict limit; prioritizes low-income.
Asset Limits Not applicable.
NC

Limited slots; rural/urban balance.

Benefits
In-home respite (4-6 hours/day) Adult day care (~$60/day) Short-term facility care (up to 5 days)

Program of All-Inclusive Care for the Elderly (PACE)

North Carolina PACE (e.g., PACE of the Triad)

Age 55+
General NC resident (specific counties), NFLOC, safe with PACE support.
Income Limits (2025) ~$2,829/month (Medicaid-eligible); private pay option available.
Asset Limits $2,000 (individual), $3,000 (couple) for Medicaid enrollees.
NC

Available in 10+ counties (e.g., Guilford, Wake); multiple providers (e.g., PACE of the Southern Piedmont).

Benefits
Personal care (5-7 hours/day) Medical care Meals Transportation Respite Therapies

In-Home Aide Services

North Carolina In-Home Aide Services

Age 60+
General NC resident, unable to perform 1+ ADL, at risk of nursing home placement.
Income Limits (2025) No strict cap; prioritizes low-income ~$24,980/year
Asset Limits Not assessed; need-based.
NC

Family can be aides; varies by county funding.

Benefits
Personal care (5-20 hours/week) Meal prep Respite (~5 days/year) Errands

Medicare Savings Program (MSP)

North Carolina Medicare Savings Program

Age 65+ or disabled
General NC resident, Medicare Part A/B.
Income Limits (2025) ~$2,510/month (QMB), ~$3,380/month (SLMB), ~$3,598/month (QI)—individual.
Asset Limits $9,430 (individual), $14,130 (couple).
NC

Three tiers; no waitlist; includes Extra Help for Part D.

Benefits
Covers Part B premiums ($174.70/month) Deductibles ($240/year) Copays (~20%)

VA Aid and Attendance (A&A) and Housebound Benefits

North Carolina VA Aid and Attendance/Housebound

Age 65+ or disabled veteran/spouse
General NC resident, wartime service, need for ADL help (A&A) or homebound.
Income Limits (2025) Net income < ~$1,984/month (veteran with dependent, A&A); pension offsets income.
Asset Limits ~$155,356 net worth limit
NC

High veteran demand in rural/urban areas.

Benefits
Cash (~$1,433-$2,642/month veteran, ~$951-$1,318 spouse) for care costs (e.g., in-home, assisted living)

Urgent Repair Program (URP)

North Carolina Urgent Repair Program

Age 60+ prioritized
General NC resident, homeowner, low-income.
Income Limits (2025) ~$30,258/year 50% AMI, varies by county
Asset Limits Not strictly assessed; home value considered.
NC

Forgivable at $2,000/year; statewide via local partners.

Benefits
Repairs (~$8,000-$12,000 avg.) for safety (e.g., roofs, heating, accessibility)

State/County Special Assistance (SA)

North Carolina Special Assistance

Age 65+ (or disabled)
General NC resident, in licensed adult care home, low-income.
Income Limits (2025) ~$1,255/month (individual, 100% FPL); varies by facility rate.
Asset Limits $2,000 individual
NC

Covers assisted living; counties supplement state funds.

Benefits
Cash (~$1,200-$1,500/month) for room/board; Medicaid covers care services

Compare Nursing Home around Statesville

The information below is reported by the North Carolina Department of Health and Human Services, Division of Health Service Regulation.

2 facilities compared · CMS & NC Dept. of Health data

Filter by care type
Autumn Care of Statesville
NH

Nursing Home Licensed facility providing 24/7 skilled nursing care for residents with complex, ongoing medical needs. Staffed by RNs, LPNs, and CNAs. Inspected and star-rated annually by CMS. Accepts Medicare (short-term rehab) and Medicaid (long-term care).

AL

Assisted Living A licensed, long-term care setting for seniors or individuals with disabilities who need help with daily activities — like bathing, dressing, and medication management — but not 24-hour skilled nursing. Offers housing, meals, and around-the-clock support while aiming to maximize resident independence.

MC

Memory Care Secured, specialized care for people living with Alzheimer's or dementia. Staff trained in cognitive impairment, with higher staff-to-resident ratios and an environment designed to reduce confusion and wandering risk.

Statesville (Eastfield Estates)113 94.8% +24%3.70 -44%-7%$0186.0298 34 2011) William I Weisberg Family Dynasty Trust (Dated June 1$14.9M$8.1M54.8%345511
The Greens at Maple Leaf
NH

Nursing Home Licensed facility providing 24/7 skilled nursing care for residents with complex, ongoing medical needs. Staffed by RNs, LPNs, and CNAs. Inspected and star-rated annually by CMS. Accepts Medicare (short-term rehab) and Medicaid (long-term care).

AL

Assisted Living A licensed, long-term care setting for seniors or individuals with disabilities who need help with daily activities — like bathing, dressing, and medication management — but not 24-hour skilled nursing. Offers housing, meals, and around-the-clock support while aiming to maximize resident independence.

Statesville102 85.7% +12%4.00 -50%+1%$32.9k217.0285 15 Starlight Healthcare, LLC$13.7M$5.5M39.9%345340

Frequently Asked Questions about Autumn Care of Statesville

What neighborhood is Autumn Care of Statesville in?

Autumn Care of Statesville is in the Eastfield Estates neighborhood of Statesville.

Is Autumn Care of Statesville in a walkable area?

Autumn Care of Statesville has a walk score of 34. Somewhat walkable. A few nearby services may be reachable on foot, but most trips require transportation.

What is the occupancy rate at Autumn Care of Statesville?

Autumn Care of Statesville's occupancy is 94.8%.

Are there photos of Autumn Care of Statesville?

Yes — there are 10 photos of Autumn Care of Statesville in the photo gallery on this page.

What is the phone number of Autumn Care of Statesville?

(704) 883-9700 will put you in contact with the team at Autumn Care of Statesville.

Is Autumn Care of Statesville Medicare or Medicaid certified?

Yes — Autumn Care of Statesville is a CMS-certified provider of Medicare and Medicaid.

Guides for Better Senior Living

Care Cost Calculator: See Prices in Your Area

Nursing Home Data Explorer

Don’t Wait Too Long: 7 Red Flag Signs Your Parent Needs Assisted Living Now

The True Cost of Assisted Living in 2025 – And How Families Are Paying For It

Understanding Senior Living Costs: Pricing Models, Discounts & Financial Assistance

Explore Open Rooms
1 Contact details
2 What type of senior care service are you looking for?
3 What budget do you have in mind for senior care?
4 How soon do you need to find care?
5 Additional details

Thank you for your interest!

Our team will be in touch shortly to help with next steps.