


Total staff
151
Employees
133
Contractors
18
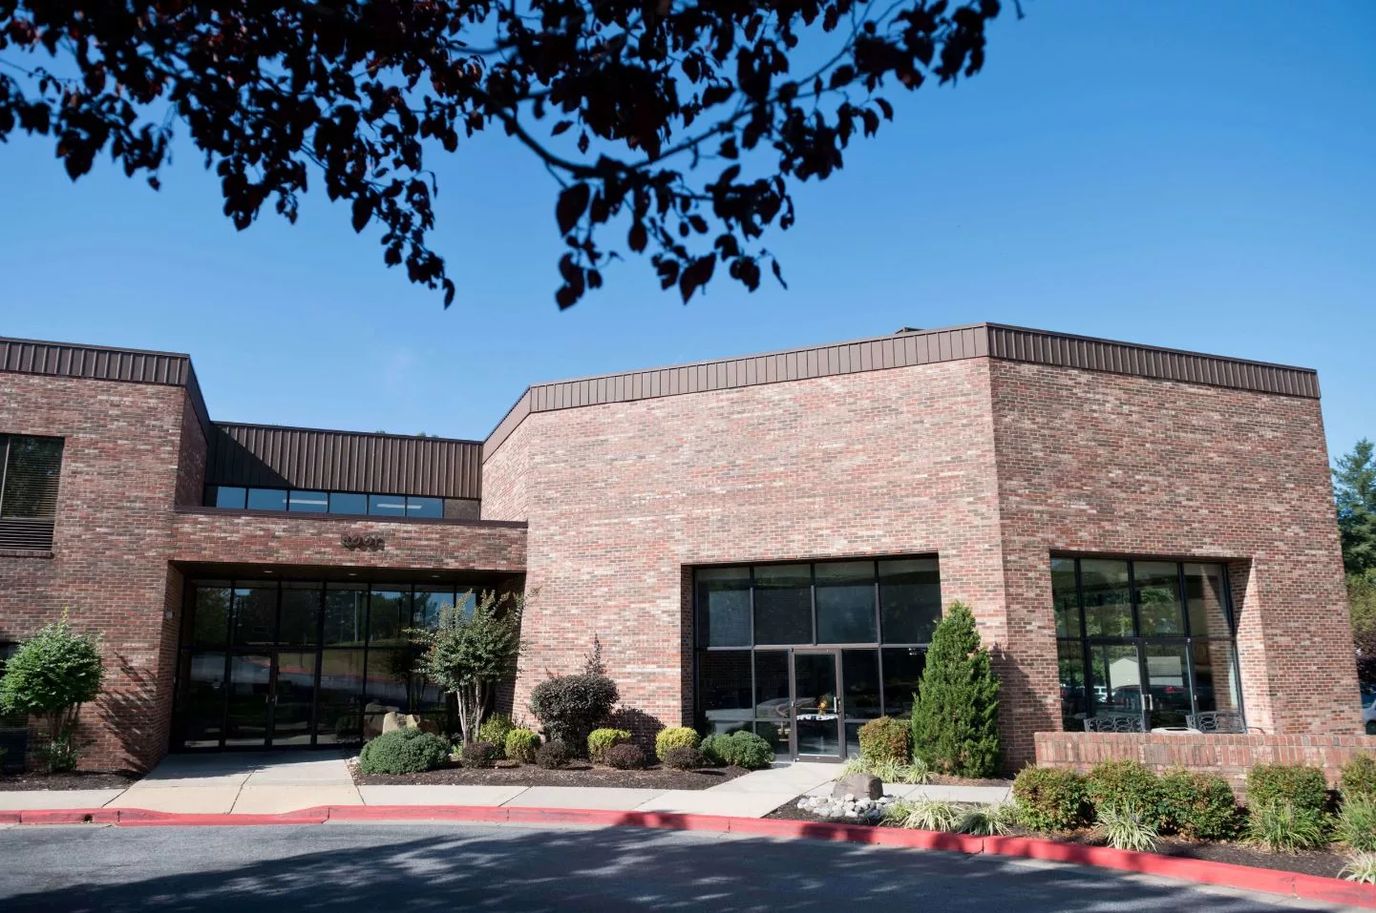

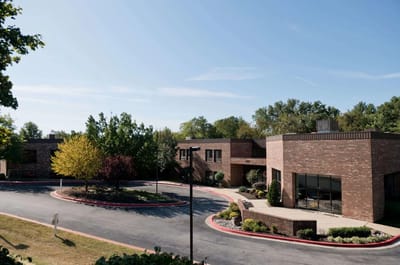
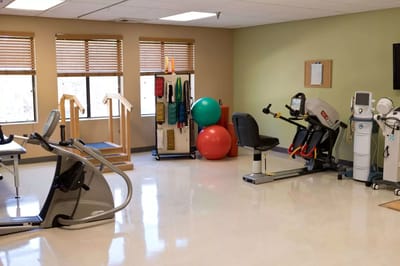
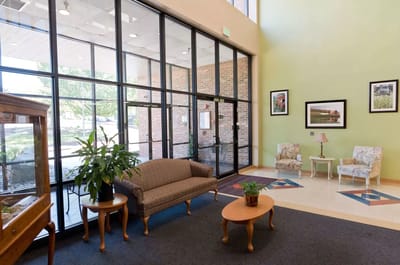
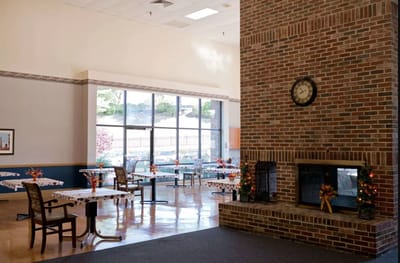
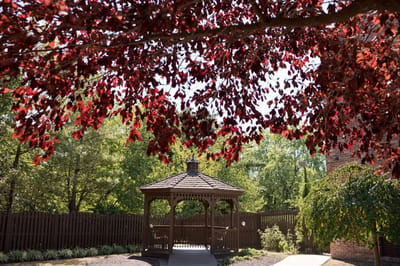
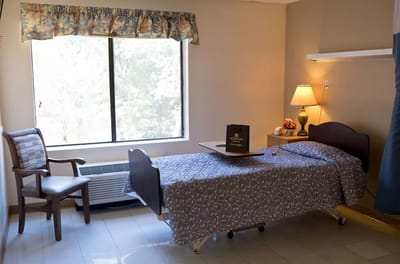
Autumn Lake Healthcare at Cherry Lane proudly presents a modern nursing center infused with a genuine small-town spirit. Beyond their acclaimed sub-acute rehabilitation services, the center has earned a distinguished reputation for its unwavering dedication to long-term care. They deliver round-the-clock, skilled nursing support for a diverse array of complex medical conditions, ensuring residents receive exceptional care at all hours. Nestled between Washington DC and Baltimore away from the bustling road, this assisted living community is enveloped by lush trees, charming gardens, and verdant landscapes, inviting residents to find solace, serenity, and renewal under the compassionate care of their dedicated staff.
Autumn Lake Healthcare at Cherry Lane is an independently owned and operated healthcare center that is licensed to use the Autumn Lake Healthcare name and receive non-healthcare related services. All healthcare-related services are provided solely by Autumn Lake Healthcare at Cherry Lane.
| Staff type | Hours / Day / Resident | vs state avg |
|---|---|---|
|
Registered Nurse (RN)
| 38m per day | ▼ 23% State avg: 50m per day · National avg: 41m per day |
|
LPN / LVN
| 1h 4m per day | ▲ 18% State avg: 54m per day · National avg: 52m per day |
|
Nurse Aide
| 1h 50m per day | ▼ 15% State avg: 2h 10m per day · National avg: 2h 21m per day |
|
Weekend Total Nursing
| 3h 13m per day | ▼ 8% State avg: 3h 29m per day · National avg: 3h 26m per day |
|
Physical Therapist
| 4m per day | ▼ 17% State avg: 5m per day · National avg: 4m per day |
|
Weekend RN
| 35m per day | ▼ 4% State avg: 37m per day · National avg: 29m per day |
Reporting period: October 1 – December 31, 2025 (Q4 2025). Source: CMS Payroll-Based Journal report.
Manages medical care and health needs.
Assists with medical care and medications.
Helps with daily care and mobility.
Total hours from contractors
3,673 contractor hours this quarter
| Certified Nursing Assistant | 56 | 0 | 56 | 25,001 | 92 | 100% | 7.9 |
| Licensed Practical Nurse | 30 | 0 | 30 | 12,580 | 92 | 100% | 8.6 |
| Registered Nurse | 26 | 0 | 26 | 6,037 | 92 | 100% | 7.6 |
| Clinical Nurse Specialist | 6 | 0 | 6 | 2,199 | 64 | 70% | 7.8 |
| RN Director of Nursing | 4 | 0 | 4 | 1,913 | 80 | 87% | 8.1 |
| Other Dietary Services Staff | 4 | 0 | 4 | 1,844 | 91 | 99% | 7.5 |
| Speech Language Pathologist | 0 | 4 | 4 | 1,073 | 71 | 77% | 7.8 |
| Respiratory Therapy Technician | 0 | 3 | 3 | 937 | 76 | 83% | 7.7 |
| Physical Therapy Assistant | 0 | 5 | 5 | 937 | 66 | 72% | 7.8 |
| Administrator | 1 | 0 | 1 | 528 | 66 | 72% | 8 |
| Qualified Social Worker | 0 | 5 | 5 | 517 | 52 | 57% | 7.3 |
| Nurse Practitioner | 1 | 0 | 1 | 458 | 58 | 63% | 7.9 |
| Dental Services Staff | 1 | 0 | 1 | 456 | 57 | 62% | 8 |
| Occupational Therapy Aide | 1 | 0 | 1 | 446 | 57 | 62% | 7.8 |
| Dietitian | 1 | 0 | 1 | 438 | 57 | 62% | 7.7 |
| Qualified Activities Professional | 1 | 0 | 1 | 421 | 73 | 79% | 5.8 |
| Mental Health Service Worker | 1 | 0 | 1 | 366 | 46 | 50% | 7.9 |
| Physical Therapy Aide | 0 | 1 | 1 | 209 | 31 | 34% | 6.7 |
Federal penalties imposed by CMS for regulatory violations, including civil money penalties (fines) and denials of payment for new Medicare/Medicaid admissions.
Source: CMS Penalties Database
No penalties in the past 3 years
No civil money penalties or payment denials were reported in the last 3 years.
These measures show how residents usually do over time at this home, based on health outcomes and preventive care.
Maryland average: 12.9
Maryland average: 25.7
Maryland average: 23.7%
Maryland average: 27.7%
Maryland average: 25.9%
Maryland average: 2.3%
Maryland average: 6.5%
Maryland average: 1.6%
Maryland average: 5.8%
Maryland average: 20.2%
Maryland average: 12.9%
Maryland average: 92.0%
Maryland average: 96.6%
Maryland average: 1.32
Maryland average: 1.21
Maryland average: 78.4%
Maryland average: 1.4%
Maryland average: 80.6%
Maryland average: 21.2%
Maryland average: 9.9%
Maryland average: 0.8%
Maryland average: 53.7%
Maryland average: 50.6%
Quality measures are calculated from Minimum Data Set (MDS) assessments. For most measures, lower percentages indicate better care quality.
63% of new residents, usually for short-term rehab.
29% of new residents, often for short stays.
8% of new residents, often for long-term daily care.
Source: CMS Long-Term Care Facility Characteristics (Data as of Jan 2026)
Residents meet regularly to discuss policies, care quality, and activities
Family members meet regularly to discuss policies, care quality, and activities
Organized group of family members that meets regularly to discuss facility policies, resident care, and activities.
Organized group of residents that meets regularly to discuss facility policies, quality of life, and activities.
Data sourced from CMS Long-Term Care Facility Characteristics quarterly report. Payer mix reflects the current resident census by primary payment source.
Historical financial and operational data for Autumn Lake Healthcare at Cherry Lane from 2012–2023, based on CMS SNF Cost Reports.
Key figures below are for fiscal year ending in 12/2023.
Based on CMS SNF Cost Report for fiscal year ending in 12/2023.
Most residents typically stay for a few weeks or months before returning home or moving on.
Most new residents arrive under Medicare (63% of admissions), and a typical Medicare stay runs around 1 months.
Coverage residents most often arrive under.
Coverage residents most often leave under.
![]() 1.5 miles from city center
1.5 miles from city center
![]() Estimated distance in miles from Laurel's city center to Autumn Lake Healthcare at Cherry Lane's address, calculated via Google Maps.
— 1.73 miles to nearest hospital (UM Laurel Medical Center)
Estimated distance in miles from Laurel's city center to Autumn Lake Healthcare at Cherry Lane's address, calculated via Google Maps.
— 1.73 miles to nearest hospital (UM Laurel Medical Center)
Add your location
Info below is compiled from CMS reports & the MD Dept. of Health (OHCQ), senior community websites & trusted data sources such as Walk Score & BBB.
Communities are listed from highest to lowest based on our ranking methodology.
| Autumn Lake Healthcare at Cherry Lane | NH PC RC SNF | Laurel (Mistletoe Springs) | 155
Facility
155
MD AVG
42
Rank
#38 / 685 |
95.4%
Facility
95.4%
MD AVG
80.3
Rank
#11 / 97 | +19% | 3.21
Facility
3.21
MD AVG
3.77
Rank
#93 / 125 | +25% | -15% | $0
Facility
$0
MD AVG
$65.0k
Rank
#1 / 127 | 41
Facility
41
MD AVG
49.9
Rank
#61 / 127 | 13.7
Facility
13.7
MD AVG
12.8
Rank
#80 / 127 | - | 148 | - |
36
Facility
36
MD AVG
43
Rank
#563 / 985 | A&R Stern Family Cl Holdings, LLC | $24.0MFiscal year ending 12/2023
Facility
$24.0MFiscal year ending 12/2023
MD AVG
$18.7M
Rank
#38 / 126 | $3.4MFiscal year ending 12/2023
Facility
$3.4MFiscal year ending 12/2023
MD AVG
$6.5M
Rank
#33 / 126 | 14.1%Fiscal year ending 12/2023
Facility
14.1%Fiscal year ending 12/2023
MD AVG
38.5%
Rank
#64 / 126 | 215177 | ||||
| Autumn Lake Healthcare at Patuxent River | NH SNF | Laurel | 153
Facility
153
MD AVG
42
Rank
#41 / 685 |
87.9%
Facility
87.9%
MD AVG
80.3
Rank
#48 / 97 | +9% | 3.17
Facility
3.17
MD AVG
3.77
Rank
#93 / 125 | +104% | -16% | $0
Facility
$0
MD AVG
$65.0k
Rank
#1 / 127 | 56
Facility
56
MD AVG
49.9
Rank
#87 / 127 | 11.2
Facility
11.2
MD AVG
12.8
Rank
#64 / 127 | 1 | 135 | - |
22
Facility
22
MD AVG
43
Rank
#719 / 985 | 14200 Laurel Park Drive Holdco LLC | $18.5MFiscal year ending 12/2023
Facility
$18.5MFiscal year ending 12/2023
MD AVG
$18.7M
Rank
#57 / 126 | $1.3MFiscal year ending 12/2023
Facility
$1.3MFiscal year ending 12/2023
MD AVG
$6.5M
Rank
#37 / 126 | 6.9%Fiscal year ending 12/2023
Facility
6.9%Fiscal year ending 12/2023
MD AVG
38.5%
Rank
#17 / 126 | 215141 |
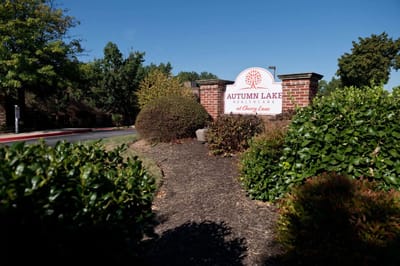
Autumn Lake Healthcare at Cherry Lane is located in Laurel, Maryland.
Here are the financial assistance programs available to residents in Maryland.
Autumn Lake Healthcare at Cherry Lane is in the Mistletoe Springs neighborhood.
Autumn Lake Healthcare at Cherry Lane has a walk score of 36. Somewhat walkable. A few nearby services may be reachable on foot, but most trips require transportation.
Autumn Lake Healthcare at Cherry Lane's occupancy is 95.3%.
No, Autumn Lake Healthcare at Cherry Lane has a no-pet policy.
Autumn Lake Healthcare at Cherry Lane is registered as a for-profit.
Yes — there are 9 photos of Autumn Lake Healthcare at Cherry Lane in the photo gallery on this page.
Autumn Lake Healthcare at Cherry Lane is located at 9001 Cherry Ln, Laurel, MD 20708.
Care Cost Calculator: See Prices in Your Area
Nursing Home Data Explorer
Don’t Wait Too Long: 7 Red Flag Signs Your Parent Needs Assisted Living Now
The True Cost of Assisted Living in 2025 – And How Families Are Paying For It
Understanding Senior Living Costs: Pricing Models, Discounts & Financial Assistance


