Total health inspections
24
California average 12.5
Last Health inspection on Sep 2025

We arrange tours, appointments, and even moving support so you don’t have to
Thank you for your interest!
Our team will be in touch shortly to help with next steps.


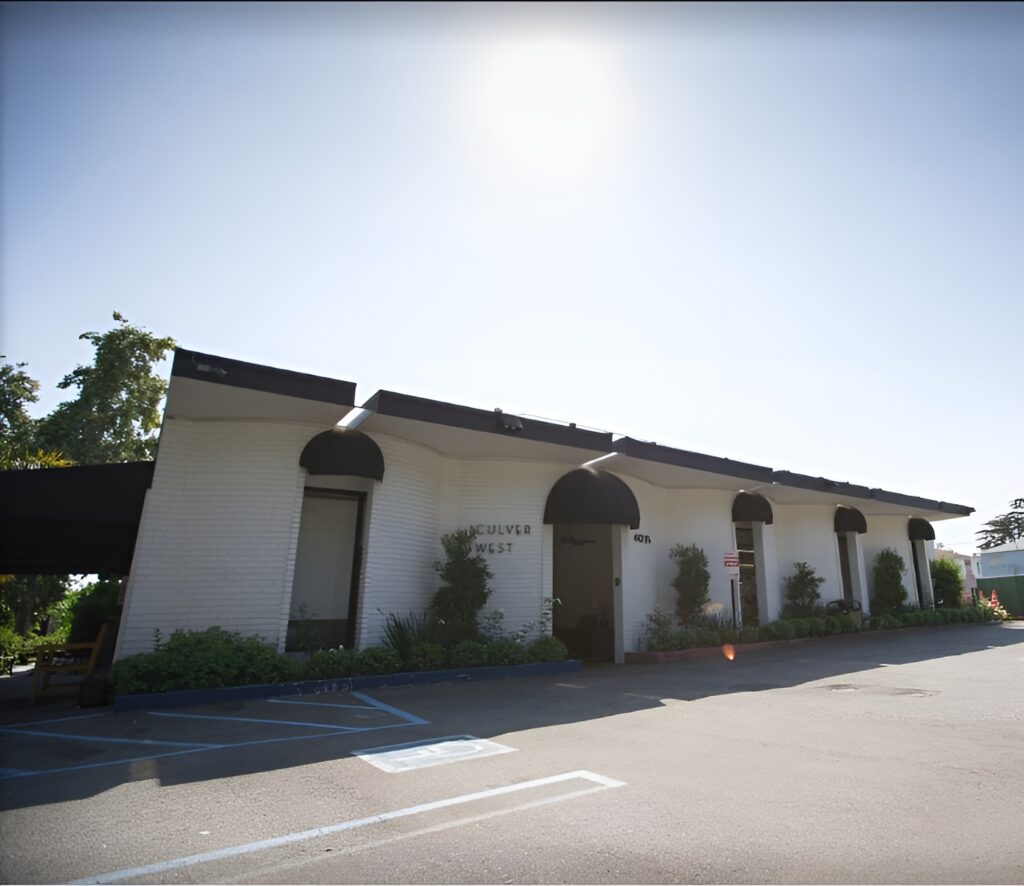
Peacefully nestled near Magic Johnson Park in Los Angeles, CA, Avalon Villa Care Center is an exceptional community that focuses on skilled nursing. Residents can keep their peace of mind with a compassionate and well-trained team that helps with their personal needs around the clock. Thoughtfully designed and sophisticated accommodations are provided, so residents feel at ease during their stay.
Aside from their healthcare needs, residents’ leisure and wellness are also taken into consideration, conducting fun recreational activities and exciting events. Rehabilitation and therapy services are also available to enhance residents’ living experiences. This Medicare-certified community is a good option for those looking for a wide range of care to live comfortably in retirement.
Frank Caporusso serves as the Administrator at Avalon Villa Care Center. He leads the community with a focus on quality care and operational excellence, supported by his credentials as a Master of Health Administration and Licensed Nursing Home Administrator.
Offers a balance of services and community atmosphere.
Occupancy is moderate, suggesting balanced demand.
Most residents typically stay for a few weeks or months before returning home or moving on.
38% of new residents, usually for short-term rehab.
26% of new residents, often for short stays.
36% of new residents, often for long-term daily care.
Housing Options: Private / Shared Rooms
Building Type: Single-story
Dining Services
Beauty Services
Social and Recreational Activities

On-site Medical Care and Health Services
Exercise Programs
Ways to qualify for care at this community, including accepted programs and payment options.
This facility is certified for eligible Medicaid services.
This facility is certified for eligible Medicare services.
In California, the Department of Social Services (for assisted living facilities) and the Department of Public Health (for nursing homes) conduct inspections to ensure resident safety and regulatory compliance.
California average 12.5
Last Health inspection on Sep 2025
California average 50.2
California average 4.65
Health citations are formal notices following inspections when they fail to comply with safety and care standards.
46 of 110 citations resulted from standard inspections; 43 of 110 resulted from complaint investigations; and 21 of 110 came from combined inspections (standard and complaint).
California average: 0.4
California average: 1
Data sourced from CMS Health Deficiencies reports. Citation severity codes range from A (least serious) to L (most serious). Immediate Jeopardy (J-L) citations indicate situations where the facility's noncompliance has placed residents at risk of death or serious harm.
Nursing Home Licensed facility providing 24/7 skilled nursing care for residents with complex, ongoing medical needs. Staffed by RNs, LPNs, and CNAs. Inspected and star-rated annually by CMS. Accepts Medicare (short-term rehab) and Medicaid (long-term care).
Assisted Living A licensed, long-term care setting for seniors or individuals with disabilities who need help with daily activities — like bathing, dressing, and medication management — but not 24-hour skilled nursing. Offers housing, meals, and around-the-clock support while aiming to maximize resident independence.
![]() 12.7 miles from city center
12.7 miles from city center
![]() 12029 Avalon Blvd, Los Angeles, CA 90061
12029 Avalon Blvd, Los Angeles, CA 90061
Add your location
This data corresponds to Q2 2025 and is based on CMS Payroll-Based Journal.
California average ratio: 0.00:1
California average: 7.7 hours
Manages medical care and health needs.
This role is partially covered by contractors.
Assists with medical care and medications.
This role is partially covered by contractors.
Helps with daily care and mobility.
No contractors work on this role.
Total hours from contractors
5,293 contractor hours this quarter
| Certified Nursing Assistant | 90 | 0 | 90 | 27,253 | 91 | 100% | 7.5 |
| Licensed Practical Nurse | 29 | 9 | 38 | 9,366 | 91 | 100% | 7.2 |
| Registered Nurse | 19 | 7 | 26 | 3,620 | 91 | 100% | 7.3 |
| Other Dietary Services Staff | 10 | 0 | 10 | 2,782 | 91 | 100% | 7.1 |
| RN Director of Nursing | 8 | 0 | 8 | 1,870 | 76 | 84% | 7.5 |
| Speech Language Pathologist | 0 | 2 | 2 | 1,089 | 75 | 82% | 9.8 |
| Physical Therapy Aide | 0 | 2 | 2 | 933 | 74 | 81% | 10.2 |
| Physical Therapy Assistant | 0 | 2 | 2 | 889 | 78 | 86% | 11.4 |
| Dental Services Staff | 2 | 0 | 2 | 745 | 64 | 70% | 7 |
| Respiratory Therapy Technician | 0 | 1 | 1 | 616 | 72 | 79% | 8.6 |
| Therapeutic Recreation Specialist | 0 | 2 | 2 | 504 | 48 | 53% | 8 |
| Mental Health Service Worker | 2 | 0 | 2 | 499 | 61 | 67% | 8 |
| Nurse Practitioner | 2 | 0 | 2 | 488 | 61 | 67% | 8 |
| Dietitian | 1 | 0 | 1 | 443 | 57 | 63% | 7.8 |
| Administrator | 1 | 0 | 1 | 417 | 53 | 58% | 7.9 |
| Occupational Therapy Aide | 0 | 2 | 2 | 329 | 41 | 45% | 7.6 |
| Qualified Social Worker | 0 | 3 | 3 | 282 | 45 | 49% | 6.1 |
| Occupational Therapy Assistant | 0 | 1 | 1 | 72 | 9 | 10% | 8 |
| Other Physician | 0 | 1 | 1 | 22 | 3 | 3% | 7.2 |
| Medical Director | 0 | 1 | 1 | 19 | 3 | 3% | 6.4 |
| Clinical Nurse Specialist | 0 | 1 | 1 | 8 | 1 | 1% | 8 |
Source: CMS Long-Term Care Facility Characteristics (Data as of Jan 2026)
Residents meet regularly to discuss policies, care quality, and activities
Family members meet regularly to discuss policies, care quality, and activities
Organized group of family members that meets regularly to discuss facility policies, resident care, and activities.
Organized group of residents that meets regularly to discuss facility policies, quality of life, and activities.
Data sourced from CMS Long-Term Care Facility Characteristics quarterly report. Payer mix reflects the current resident census by primary payment source.
These measures show how residents usually do over time at this home, based on health outcomes and preventive care.
California average: 6.6
California average: 11.3
California average: 11.1%
California average: 12.0%
California average: 11.3%
California average: 1.7%
California average: 5.0%
California average: 1.2%
California average: 4.2%
California average: 6.7%
California average: 10.1%
California average: 98.5%
California average: 98.2%
California average: 2.25
California average: 1.59
California average: 94.0%
California average: 1.5%
California average: 93.2%
California average: 23.2%
California average: 11.2%
California average: 0.8%
California average: 53.7%
California average: 50.6%
Quality measures are calculated from Minimum Data Set (MDS) assessments. For most measures, lower percentages indicate better care quality.
Federal penalties imposed by CMS for regulatory violations, including civil money penalties (fines) and denials of payment for new Medicare/Medicaid admissions.
Source: CMS Penalties Database (Data as of Jan 2026)
California average: $55K
California average: 2.4
California average: 0.5
Penalties are imposed by CMS for violations of federal nursing home regulations.
Last updated: Jan 2026
Historical financial and operational data for Avalon Villa Care Center based on CMS SNF Cost Reports.
Loading trend charts...
Care Cost Calculator: See Prices in Your Area
Nursing Home Data Explorer
Don’t Wait Too Long: 7 Red Flag Signs Your Parent Needs Assisted Living Now
The True Cost of Assisted Living in 2025 – And How Families Are Paying For It
Understanding Senior Living Costs: Pricing Models, Discounts & Financial Assistance

Touring a community? Use this expert-backed checklist to stay organized, ask the right questions, and find the perfect fit.
We'll send you a PDF version of the touring checklist.